Centaurus A: multiple outbursts or bursting bubble?
Abstract
We present new radio observations of the brighter region of the northern lobe (the Northern Middle Lobe, NML) of Centaurus A obtained at 20 cm with the Australia Telescope Compact Array. The angular resolutions are 50 and 130 arcsec, therefore much higher than for the previously available radio images of this region. The most interesting feature detected in our images is a large-scale jet that connects the inner radio lobe and the NML and that is imaged for the first time. The NML itself appears as diffuse emission with a relatively bright ridge on the eastern side.
The radio morphology of Centaurus A and, in particular, its NML could be the result of a precessing jet that has undergone a strong interaction with the environment at least in the northern side. The very big drop in intensity between the inner jet and the large-scale jet can be explained with a sequence of bursts of activity at different epochs in the life of the source. Alternatively (or additionally) a “bursting bubble” model is proposed to explain this big drop in intensity, which could also explain the good collimation of the large-scale jet. In this model, the plasma accumulated in the inner lobe would be able to “burst” out only through one nozzle that would be the region where the large-scale jet forms. The location of the nozzle would represent a region where the pressure gradient is more favourable.
From the comparison between the radio emission and the regions of ionized gas discovered by Graham & Price (the so-called optical filaments) we find that the inner optical filament ( kpc from the centre) falls about 2 arcmin ( kpc) away from the large-scale radio jet. Thus, the inner filament does not seem to have experienced a direct interaction with the radio plasma. The complex velocity field observed in this filament could be therefore due to strong instabilities produced by the “bursting bubble”. The outer filaments appear to be, in projection, closer to and aligned with the radio emission in the transition region between the jet and the lobe, arguing for a direct interaction with the radio jet. However, also in this case a more complicated interaction than assumed so far has to be occuring because of the relative position of the ionized and neutral gas regions compared to the radio jet as well as the kinematics of the ionized gas.
keywords:
galaxies: radio continuum, galaxies: individual (Centaurus A, NGC 5128), galaxies: active1 Introduction
There are a number of phenomena observed in radio galaxies that require a good knowledge of the radio morphology (on different scales) in order to be better understood. For example, the effects of the external medium can be revealed in the way they modify/disrupt the radio morphology. Sharp changes and bends in the morphology can be used as tracer of the external conditions. Furthermore, the radio morphology can be related to the way the plasma is transported from the active nucleus to the outer lobes. The relation between the large scale morphology (Fanaroff-Riley (FR) type, Fanaroff & Riley 1974) of the sources and, e.g., the characteristics of the jets in radio galaxies is well-known (Bridle & Perley 1984, Laing 1993). For example, in the case of FR class I sources, the observed large scale radio morphology has been used as indication that the jets are turbulent and low Mach-number on large scale with entrainment playing an important role in shaping their morphology (Bicknell 1986, Bicknell et al. 1990). Finally, the interstellar and/or the intergalactic medium (ISM/IGM) around radio sources can be compressed and perhaps also ionized by the interaction with the radio plasma.
As the nearest radio galaxy, Centaurus A (NGC 5128) has been very often used as a “laboratory” object where to study some of the phenomena that are typical of active galactic nuclei and that only in this object can be studied in detail. A comprehensive review of the present state of knowledge of Centaurus A is given by Israel (1998). However, for studying the radio emission, the vicinity of Centaurus A has often been a problem for the observations. Although Centaurus A is a radio source of modest power ( W Hz-1), which places it among the low-luminosity radio galaxies typically classified as FR I, its radio flux is very high ( Jy, Wright & Otrupcek 1990). Moreover, the entire radio structure of Centaurus A covers an area of about on the sky111in fact, Cen A is one of the very few extragalactic objects in the sky for which perspective has to be taken into account!. This huge angular size (that corresponds to a projected linear size222we assume a distance to Centaurus A of 3.7 Mpc (Hui et al. 1993). This gives 1 arcsec = 18 pc, 1 arcmin 1 kpc. of 650 kpc) and the strong emission from the central regions makes it very difficult to carry out observations at intermediate resolution of the large scale structure. This has limited the radio observations to either low resolution images or to detailed studies of the central region, as can be seen in Fig. 1 where some of the available radio images are collected. Thus, although Centaurus A would be an ideal object for studying in detail the radio morphology and its relation with the surrounding medium, its vicinity makes this task quite difficult.
So far, its large-scale radio structure has been imaged only using single-dish Parkes observations with resolutions ranging from a few to several arcminutes (Cooper, Price & Cole 1965, Junkes et al. 1993). An image of the whole structure of the radio emission at 4.7 GHz (taken from Junkes et al. 1993) is shown in Fig. 1a,b. The dominant structures at these resolutions are the low-brightness very extended lobes (the Outer Lobes). A bright central region (the Inner Lobes) is visible in the Parkes radio image and it includes (at 21 cm) % of the observed total flux (Cooper et al. 1965). This central region has been studied at high resolution with the VLA by Burns et al. (1983) and Clarke et al. (1992) and an image is shown in Fig. 1c. On the VLBI (sub-parsec) scale a jet and a counter-jet have been detected in the same position angle as the arcsec scale jet (Fig. 1d, Jones et al. 1996).
The two Outer Lobes are not completely symmetrical. The Northern Outer Lobe includes, at about 30 arcmin ( kpc) from the centre, the so-called Northern Middle Lobe (NML), which is the brightest region in the Northern Outer Lobe and does not have a counterpart in the southern lobe.
The region of the NML is particularly interesting because of a number of features observed there: the extended emission line regions of highly ionized gas (also known as “the optical filaments”) discovered by Blanco et al. (1975) and situated in the region between the Northern Inner Lobe and the NML (at distances ranging from 7.5 arcmin up to 28 arcmin from the nucleus); the soft X-ray emission associated with the NML and detected with the Einstein Observatory (Feigelson et al. 1981); a cloud of neutral hydrogen detected by Schiminovich et al. (1994) next to the outer optical filament. These features are only observed in and around the NML, and together with the fact that there is no counterpart of the NML in the Southern Outer Lobe, they indicate that in this region of the radio source some kind of interaction may be happening between the radio plasma and the ISM/IGM of Centaurus A.
The optical filaments are particularly interesting. They are characterized by a very high ionization level and their spectra have been investigated in detail by Morganti et al. (1991, 1992). Two possible explanations have been suggested to account for their high ionization. One possibility is that the gas is photoionized by UV radiation from the nucleus (Morganti et al. 1991). The other possibility is that they are the result of a strong interaction between the radio plasma and the ISM (Sutherland et al. 1993). The latter explanation would require a degree of correspondence between the ionized gas of the filaments and the radio structure. The radio/optical interaction has been also claimed to be the most likely mechanism able to explain the complex velocity fields observed in the filaments. A number of objects have been studied so far (see e.g. PKS 2250-41, Clark et al. 1997 and Villar-Martin et al. 1998a; PKS 1934-46, Villar-Martin et al. 1998b; 3C171, Clark et al. 1998; PKS 2152-69, Fosbury et al. 1998) and Centaurus A can be an ideal object for a study of this kind.
It follows from the above that, in order to investigate the effects of the interaction between the radio plasma and the environment, the evolution of the jet and the connection (if any) between the inner radio jet and the NML, as well as the effect of the radio plasma on the optical filaments, radio observations of this region at relatively high resolution may give valuable information.
Here we present the results of new observations done with the Australia Telescope Compact Array (ATCA) at 20 cm of the region of the NML. The main goal of these observations is to investigate the structure of this lobe at higher resolution compared to the previous single-dish images, to investigate the polarization in this lobe and to study the radio morphology in connection with the optical filaments and other structures present in the region of the NML.
2 ATCA observations
The observations were done on 5, 11 and 23 June 1995 using three of the four standard 750-m configurations available with ATCA (the data obtained with the fourth 750-m configuration (750A) were of much poorer quality and were therefore not used). All the configurations were combined together in order to get a good uv coverage. Observations with the 375-m configuration were carried out in March 1998. In all the observations the central frequency was 1392 MHz and the standard 32 channels, 128 MHz bandwidth continuum mode was used.
Table 1. Log of the observations
| Fields | Pointing Centres | Configurations | Min-Max Baseline | rmsI | rmsP | ||
|---|---|---|---|---|---|---|---|
| R.A. | Dec. | meters | mJy/beam | ||||
| #1 | 13:25:24 | -43:01:11 | 1343 | 750B,C,D | 31-765 | 15.3 | … |
| #1 | 13:25:24 | -43:01:11 | 1384 | 375 | 31-459 | 18.8 | 11.5 |
| #2 | 13:26:54 | -42:32:36 | 1343 | 750B,C,D | 31-765 | 6.7 | 2.4 |
| #2 | 13:26:54 | -42:32:36 | 1384 | 375 | 31-459 | 9.7 | 3.0 |


In this paper we will present and discuss the results obtained for two pointing centres: the central field (i.e. the field centred on the core of Centaurus A, defined as field #1 in Table 1) and the field centred north of the NML (defined as field #2 in Table 1). The latter turned out to be the best for mapping the NML and this is likely due to the attenuation of the central very bright region by the primary beam.
The source was observed for 12h in each configuration. The data were calibrated by using the MIRIAD package (Sault, Teuben & Wright 1995), which is necessary for the polarization calibration of ATCA data. The flux scale is based on the recent compilation of measurements of the primary calibrator PKS 1934-638 by Reynolds (1996) which corresponds to 14.9 at 1.4 GHz. We used PKS 1315-46 as a secondary calibrator with a flux of 2.20 Jy at 1.4 GHz.
The images were produced using uniform weighting. The resolution of the image obtained combining the data from the 750-m configurations is arcsec (in p.a.=2∘) while it is arcsec (in p.a.=–3∘) for the images obtained using the data from the 375-m configuration. These resolutions correspond to an average linear scale of kpc and kpc respectively. The rms noise of the and maps varies for the two pointing centres and they are listed in Table 1.
Together with the total intensity images we have also obtained the images for the Stokes parameters (), the polarized intensity () and position-angle () images. The polarized intensity and the fractional polarization () were estimated only for the pixels for which .
In the case of the data from the 375-m configuration, we have estimated the polarization for the channels at the edges and in the middle of the band (1372, 1416 MHz and 1392 MHz). This has allowed us to derive the Faraday rotation (although we are somewhat limited by the small difference between the frequencies).
3 Results
3.1 Total intensity
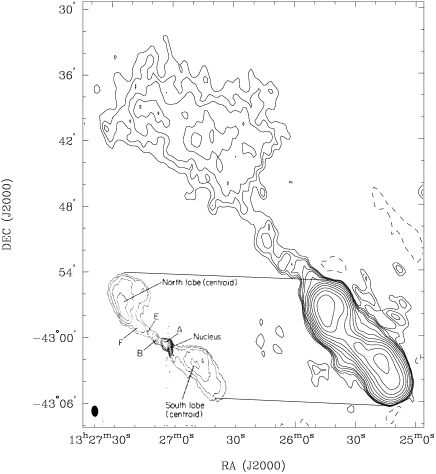
Fig. 2 left shows the image (corrected for the primary beam) obtained using the 750-m configuration data (i.e. our higher resolution data) and resulting from linearly mosaicing the images from the two pointing centres, and Fig. 2 right shows an image of field #2. Fig. 3 shows the same image superimposed to the Parkes image to allow a more direct comparison of the morphology at different resolutions. The most interesting feature detected in our new images is the jet-like structure that connects the inner lobe and the NML. Although the nature of this structure is not yet fully understood (see §4.1), throughout the paper we will refer to it as the large-scale jet (to distinguish it from the inner jet imaged by the VLA). The large-scale jet was not known before and it extends from 6 arcmin up to 15 arcmin (i.e. from to about 15 kpc) from the centre. The large-scale jet is not perfectly straight but “wiggles” slightly. At larger distances from the nucleus, this jet widens to form the NML. The large-scale jet has a position angle of and is therefore slightly misaligned compared to the inner jet that has a position angle , as observed by the VLBI (Jones et al. 1996, Tingay et al. 1998) and by the VLA (Clarke et al. 1992).
The NML appears as diffuse emission with a relatively bright ridge and a sharp edge on the eastern side, more evident in the low resolution image. This bright ridge appears to represent the continuation of the large-scale jet (suggested also by the agreement in the position angle, both at ). The NML is the place where another change in the position angle of the radio structure occurs from to corresponding to the position angle of the northern Outer Lobe (Cooper et al. 1965, Junkes et al. 1993; see Fig. 1). Our lower resolution image (from the 375-m configuration data; see Fig. 4) shows part of the very low brightness region of the NML that extends in the NW direction.
Finally, we note that the peak of the NML is only 365.6 mJy beam-1 (at 1392 MHz) in the image from the 375-m data. Compared with the peak of the inner lobe from the same data, 56.1 Jy, this shows the considerably lower brightness of the NML (ratio 1:157) and, therefore, the difficulty of imaging the extended emission in the NML at this intermediate resolution.

3.2 Polarization
The analysis of the polarization presented here has been done using the data from the 375-m configuration (similar results have also been obtained with the 750-m data and we omit these for brevity). Fig. 4 shows the contours of the total intensity for field #2 from the 375-m configuration data, with superimposed vectors whose length is proportional to the fractional polarization and whose position angle is that of the magnetic field corrected for an average rad m-2 (see below). The polarization reveals a number of interesting structures that were not evident in the low resolution Parkes images.
The large scale jet appears to be clearly polarized with a position angle of the magnetic vectors parallel to the jet in the region where it connects to the inner lobe.
Along the large-scale jet, at about kpc from the nucleus, the magnetic vectors turn perpendicular to the direction of the jet. In polarized emission the large-scale jet seems to bend west instead of proceeding to the brighter part (ridge) of the NML. The brighter ridge in the NML shows indeed a lower fractional polarization with a “corridor” of low polarization or even unpolarized emission in the east side of the lobe. The average fractional polarization in the bright ridge is between 10 and 20 %. On the contrary, the western region of the lobe, shows very high polarization (between 50 and 60 %) consistent with the fact that the position angles of the magnetic vectors are very constant across this region with a typical p.a. of , indicating that no major inhomogeneities are present on the scale of our observations. The high fractional polarization and the position angle of the magnetic vectors are in agreement with previous observations (Cooper et al. 1965, Junkes et al. 1993 from 5-GHz data, see Fig. 1b) despite the large difference in resolution. This indicates that the effects of depolarization due to the beam are not very strong.
We have used the images made with the channels at the edges and in the middle of the band (1372, 1416 MHz and 1392 MHz) to estimate the rotation measure (). The use of three channels in the band allows us to avoid ambiguity in the estimate of the . The is defined as , where is the intrinsic position angle and the apparent position angle at the of the observations. Fig. 5 shows the obtained rotation measure. Large scale variations are present although one should keep in mind that in some areas the errors on the derived values are quite large, up to rad m-2. The average rotation measure is rad m-2. This is in agreement with what found by Cooper et al. (1965; see also Junkes et al. 1993). The position angle of the magnetic vectors has been corrected for this average value.
In order to investigate how reliable the RM measurements are, we have done a similar study of the polarization (i.e. using the channels at the edges of the band) for the central field. Fig. 6 shows the total intensity for field #1 with superimposed vectors whose length is proportional to the fractional polarization and whose position angle is that of the magnetic field (for a frequency of 1392 MHz). The average fractional polarization in the northern inner lobe is between 10 and 25% while the rotation measure is between –45 and –65 rad m-2. These values can be compared with what obtained from the previous VLA studies (Clarke et al. 1992 and Clarke priv. communication) although the large difference in resolution has to be taken into account. Clarke et al. (1992), from their arcsec resolution images, found a fractional polarization in the northern inner lobe between 11 and 25 % for the brighter regions, going up to % for the more diffuse low brightness parts. The RM they found (again in the northern inner lobe) is between –43 and –65 rad m-2. Therefore our values are in very good agreement with those from the VLA, despite the large difference in resolution.
3.3 Radio and X-ray emission
It is useful, for the discussion that will follow, to compare the new radio image with the X-ray emission in the NML. An association between soft X-ray and the radio emission in the NML was detected with the Einstein Observatory by Feigelson et al. (1981). A look at the ASCA GIS low-energy (0.7 – 2 keV) image (pointed on the NML) from the public archive appears to confirm the extended soft X-ray emission in the region of the NML and aligned with the brighter radio ridge on the eastern side.
Feigelson et al. (1981) discuss three possibilities for the origin of the X-ray emission: inverse Compton scattering of the microwave background, synchrotron emission and thermal processes. Inverse Compton scattering was ruled out by Feigelson et al., because the required magnetic field (0.2 G) was not consistent with the value derived from the old radio data using the standard equipartition arguments. Following the formulae in Pacholczyk (1970) we have estimated the minimum magnetic field in the case of equipartition: where is the ratio between the energy of the heavy particles and of the electrons, is the filling factor, the source size and the distance. With the parameters derived from our new data, we confirm that a magnetic field of about 2 G characterizes the NML, therefore too high for Inverse Compton scattering. This value has been derived using the commonly used value (and ) and the situation is, of course, even worse if we assume an higher value for (see discussion in Killeen et al. 1988). In other words, based on the equipartition magnetic field, we would expect an higher X-ray flux.
When our radio image is compared with the soft X-ray image from ASCA, the X-ray emission appears co-spatial with the brighter ridge of radio emission in the eastern side of the NML. However, the X-ray emission is weak ( ergs s-1 in the range 0.5 – 4.5 keV according to Feigelson et al. 1981) and it appears to be very difficult to investigate a possible coincidence between the X-ray and radio peaks (that could support the synchrotron hypothesis, but see also Mack, Kerp & Klein 1997). The X-ray appears more diffuse and especially in the south-west part not coincident with the peak of the radio emission. However, a more detailed reduction of the ASCA X-ray data is necessary to confirm this.
According to Feigelson et al. (1981) the most likely explanation for the soft X-ray emission in the region of the NML, are thermal processes produced by compression of the interstellar medium by the radio lobe. Interestingly, the X-ray emission appears to be associated with the region of lower fractional polarization in the NML. This coincidence indeed suggests that this is the process responsible for the X-ray emission and that the X-ray gas is producing a depolarizing screen around the radio lobe. A study of the depolarization will allow to investigate this hypothesis.


4 Discussion
4.1 The nature of the NML
The new radio images allow us to investigate in more detail the structure of the NML in Centaurus A. We shall now attempt to understand how the large scale radio structure, and in particular the large-scale jet revealed by our new images, can be explained.
4.1.1 Interaction, change of axis and multiple outbursts
In Centaurus A, the precession of the central engine, as described by Haynes et al. (1983), is strongly suggested by the overall S-shape of the large-scale radio structure. However, some of the observed characteristics have been also described as the result of interaction between the radio plasma and the ISM/IGM. In particular, the abrupt change in the observed position angle in coincidence of the NML, as well as the asymmetry in the radio structure (i.e. the absence of a middle lobe in the southern part), would not be easy to reconcile only with a smooth precession of the engine. Moreover, interaction is the most likely explanation for the association between the radio and the soft X-ray emission detected in the NML (Feigelson et al. 1981, as already discussed in §3.3). Thus, the radio structure of Centaurus A can be described as the result of a jet that has changed its position angle during its life and that has undergone also a strong interaction with the environment at least in the northern side. It is also worth mentioning that Centaurus A is believed to be the result of a “recent” merger from where the neutral gas and the dust lane have been accreted. Such a merger may have disturbed the position angle of the radio jet as a result of change of axis of the inner disk (Schreier et al. 1998; Pringle 1997).
Similarities between Centaurus A and M87 (Virgo A) have been already pointed out by other authors and therefore it is not surprising to see that similar hypotheses (in particular those described in §4.1.1) have been suggested to explain the radio morphology of these two radio galaxies. Indeed, there seems to be a number of analogies between Centaurus A and M87. In particular, as in M87 (see Klein 1998 for a review), the structure of Centaurus A can be separated in three components. The three components (inner, middle and outer lobes) show in both cases an abrupt change in position angle. To describe the various structures observed in M87, Feigelson et al. (1981) proposed either the ejection of inhomogeneous jets by a precessing nucleus or the continuous ejection of jets that bend because of interactions with the environment. Klein (1998) proposed, as the simplest interpretation, a change of orientation of the ejection during different epochs of activity. In the case of M87, in fact, the structure seems to be difficult to reconcile with being powered by a jet that had constant thrust and orientation over the past 108 years.
On the other hand, M87 and Centaurus A have also a number of differences. Apart from the radio power, the main difference is in the environment: Virgo A is part of a rich cluster and this is more likely to have a strong influence on the morphology of the radio emission. Indeed, the bend in the structure of Centaurus A is not as sharp as observed in M87, probably indicating a less strong interaction.
However, the scenario mentioned above does not explain the large drop in the brightness that is observed between the inner and the outer lobe region. One way of explaining this characteristic is assuming multiple outbursts due to different epochs of activity in the life of the source. The inner lobe would be the result of the most recent (and still active) outburst, while the large-scale jet and the outer lobe would then represent relics of past activity. The high fractional polarization and ordered magnetic field in the NML would be consistent with this hypothesis. Polarization studies of tailed radio galaxies (e.g., Feretti et al. 1998a) show that the degree of polarization increases along the tails, reaching often values up to (and sometimes larger than) 50%, therefore indicating a very ordered component of the magnetic field. The same must occur in the more relaxed part of the Centaurus A lobe.
4.1.2 An alternative scenario: a “bursting bubble”
The need for an alternative model or an additional ingredient is due to the fact that the large-scale jet appears to be quite collimated, more than what would be expected in a relic-like kind of structure. The alternative model comes from the analogy between Centaurus A and Wide Angle Tails (WAT) radio galaxies. Some of these objects show sharp bends and jet disruption followed by a recollimation of the jet itself that can propagate for a long distance downstream the deflection point. It is also worth noticing that tails of collimated emission from diffused lobes can be quite common especially when deep radio observations are available. One example are the recent images of 3C449 (Feretti et al. 1998b) where a narrow structure (that appears as a channel with edge brightening) is emerging from the inner lobe.
Norman & Balsara (1993), following an earlier suggestion of Burns (1986), suggested that the jet deflection and disruption in WAT radio galaxies can be due to a jet-cloud collision in a clumpy external medium. However, after this the jet can be “restarted” even to a mildly supersonic velocity via a de Laval nozzle mechanism (i.e. a variation in the cross-section of the plasma flowing channel) as shown in Fig. 4 of Norman & Balsara (1993).
The inner jet in Centaurus A appears to undergo a strong oblique shock at few arcsec from the nucleus where the jet decollimates and decelerate forming a turbulent, subsonic flow. At the same position it also shows a sharp bend. The inner lobe appears to be confined by the IGM/ISM (possibly the same medium causing the shock) and this would explain the high brightness in this lobe. These characteristics bear similarities with WAT sources, as already pointed out in the simulation of Norman et al. (1988), therefore it appears to be possible to apply the model of Norman & Balsara also to the case of Centaurus A. For this object, the plasma accumulated in the inner lobe would be able to “burst” out only through one nozzle (a sort of “hole in the bubble”) that would be the region where the large-scale jet forms. The location of the nozzle must represent either a region where the pressure gradient is more favourable (e.g. the edge of the cloud in the external medium responsable of the interaction and bending) or the region where an old jet was located if we believe the multiple outburst and change of axis picture described above.
In this scenario the effect of the environment in shaping the radio morphology is really important. The above picture requires the presence of an asymmetry or clumpiness in the external atmosphere. This can be justified again by the fact that Centaurus A is believed to be a result of a recent merger and this could have influenced the external medium as well.
Moreover, the presence of X-ray emission in the region of the NML shows that indeed some differences are present in this region: an asymmetry in the external medium would indeed be consistent with the asymmetry observed in the radio, between the northern and southern side.
The bursting bubble model would also offer an explanation for the origin of the inner filament (see §4.2)
4.2 The optical filaments and radio plasma
One of the aims of our observations of Centaurus A is to investigate whether higher resolution radio images can give additional information on the nature and origin of the filaments of highly-ionized gas that are found between the inner radio lobe and the NML.
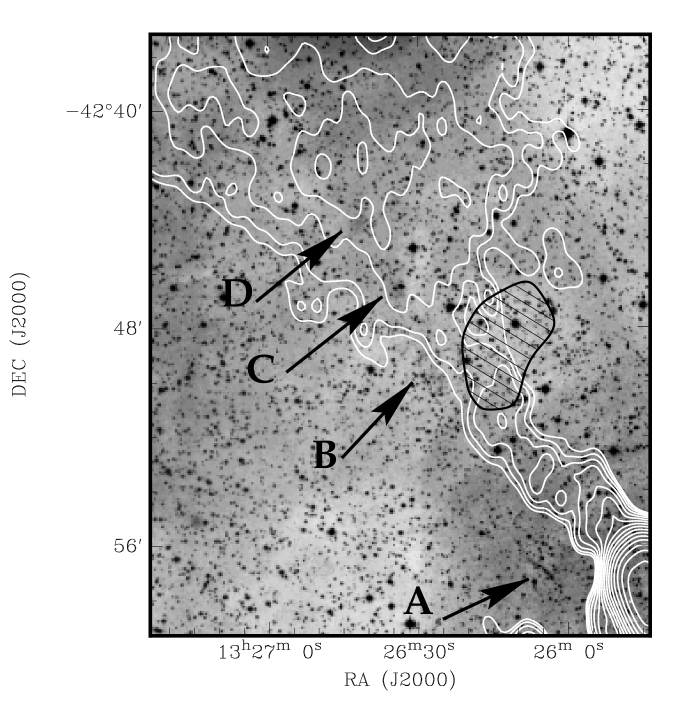
Fig. 7 shows an overlay between our higher resolution image and an optical image kindly provided by D. Malin. Filament is the so-called inner filament, while is usually referred to as the outer filament. The other two filaments, and , represent filaments at larger radii that have been studied by Graham & Price (1981).
As summarized in the introduction, from a spectroscopic study of the filaments and , Morganti et al. (1991, 1992) conclude that they are predominantly photoionized by the radiation field of a nuclear continuum source. However, large velocity gradients (up to 100 km s-1; Graham & Price 1981 and Morganti et al. 1991), and line splitting up to 500 km s-1 on a scale of a few hundred parsec (Evans et al. in prep.) are observed in the inner filament. These gradients cannot be accounted for, e.g., by acceleration of the clouds by radiation pressure of the photon beam, but acceleration by a particle beam appears to be necessary (Taylor, Morganti & Fosbury 1992). A possible scenario is, therefore, that the filaments are compressed and kinematically disturbed by the interaction of the radio plasma and photoionized by the UV radiation from the nucleus. The idea of an interaction between the filaments and the radio jet was further investigated by Sutherland et al. (1993), who found that an alternative explanation for the ionization of the filaments could be shocks resulting from this interaction. In their model, the mechanical flux of a mildly supersonic low-density jet interacting with dense clouds at the location of the filaments is sufficient to energize the shock waves through the production of supersonic turbulent velocities in the dense cloud via a Kelvin-Helmholtz (K-H) instability. The energy radiated away by shocks ionizes the filaments.
Since the location of the radio jet on the large scale was not known before, it was difficult to judge how the interaction between the radio plasma and the filaments was occurring, and how relevant this interaction could be for the ionization of the filaments. Discussions in the literature about the nature of the filaments have always assumed that, at the location of the filaments, the radio jet is at the same position angle as the inner jet. However, our images show that the radio jet is at a slightly different location and we will discuss in the light of this result how the radio jet can influence the kinematics of the filaments.
4.2.1 The inner filament and its complex velocity field
Fig. 7 shows that the inner filament falls about 2 arcmin (2 kpc) away from the large-scale radio jet revealed in our new images. It therefore appears that the inner filament is not directly interacting with the radio plasma. The gap observed between the large-scale radio jet and the inner filament makes it not straightforward to apply the explanation proposed by Sutherland et al. (1993) for the ionization of this filament.
A few alternative hypotheses can be considered. One possibility is that the radio jet is actually broader than we observe, i.e. we have detected only the ”spina dorsale” of the jet. The region disturbed by the passage of the radio jet would therefore be more extended. However, the lower resolution image we have available (Fig. 4) does not show a much broader jet.
Another possibility is that the inner filament was actually formed in the boundary layer of the radio jet, but then the rotation of the system of which the filaments are part carried this gas away from the jet. The average velocity of the filament (V 280 – 320 km s-1) appears to be close to the velocity of the neutral hydrogen in the eastern tip of the dust-lane (Schiminovich et al. 1994). This suggests that filament originally was a H I cloud acquired by the merger that produced the dust lane: the acquired gas is still not settled as suggested by the presence of a warp in the dust lane, and the filament could represent a remnant tail of the gas falling into the stable orbit of the dust-lane plane. If the filament rotates with velocities - km s-1 (as the neutral gas appears to do), it will travel the 2 kpc that separate them from the radio jet in at least yr. It is unlikely that the clouds would survive such a time. The clouds in the filament do not appear to be in thermal equilibrium with the environment. As shown in Morganti et al. (1991), the bright blobs observed in the inner filament would reach pressure equilibrium with the surrounding in a short time: yr. Thus, it does not seem feasible that the most compact blobs have travelled from the edge of the radio jet to the present position and still show such strong velocity gradients and overpressure.
Centaurus A is not the only object that shows the presence of disturbed regions of ionized gas at much larger radii than the radio jet. In other objects like, e.g., the Seyfert galaxy Mrk 3 (Capetti et al. 1999) and the radio galaxy PKS 2250–41 (Villar-Martin et al. 1998a) similar situations have been observed. In the former case, Capetti et al. interpret this as the result of a hot rapidly expanding cocoon surrounding the radio jet. The hot cocoon would be produced in the ISM/IGM heated by the interaction with the jet. Numerical simulations on jet instabilities and exchange of mass, momentum and energy between the jet and the environment have been carried out by, e.g., Bodo et al. (1995, 1997). In particular, in a so-called acoustic phase, the jet is able to perturb the external medium by radiating acoustic and shock waves. These simulations concentrate on high Mach number ( 5) jets and therefore they may not be fully applicable to the large-scale jet in Centaurus A. However, in Centaurus A the filament lies in a “complex” region, close to where the large-scale jet is actually bursting out of the inner lobe if the origin of the large-scale jet is as described in §4.1.2. It is, therefore, likely that strong instabilities are created by these effects and propagated to the distance of the filament. This could create the instabilities that lead to the large velocity gradients that is observed in this filament, in particular on the side facing the radio jet. The inner filament would then not be disturbed by the jet itself, but by effects created by the jet emerging from the inner lobe. This hypothesis may indirectly support the idea of bursting bubble as origin for the large-scale jet.
4.2.2 The outer filaments: a more direct interaction
The outer filaments and appear to be, at least in projection, closer to the radio emission and hence the case for a direct interaction between the jet and the filaments is strong. It is worth remembering that for the outer filament there is a strong case for an association between it and the H I cloud (Schiminovich et al. 1994; see shaded region in Fig. 7) based on the agreement between their velocities (V 350 km s-1 for the ionized gas; Graham 1998 and Evans et al. in prep). In this context, it is worth mentioning that new, high spectral-resolution observations of the H I cloud (Oosterloo et al. in prep.) show that the H I closest to the filament could be disturbed kinematically and that this side of the H I cloud has a very similar velocity gradient to that observed in the ionized gas closest to the H I cloud. Moreover, right at the edge of the H I cloud facing the filament , there is a chain of blue stars that could point at star formation induced by the jet (Graham 1998).
In the case of the filament , most investigators have assumed in the past (by extrapolating the position angle of the inner radio jet) that the radio jet passes on its eastern side. However, using our new radio data it appears that a more complicated interaction than has been previously assumed has to be occuring. Our data shows that the jet passes on the western side of the filament, and in fact passes, in projection, over the brighter part of the H I cloud. Even more, the regions of ionized gas that show a complex velocity structure or large velocity gradients (in particular the most bright and compact regions) lie on the eastern side of the outer filament, away from the H I cloud and away from the radio jet. The ionized gas between these compact regions and the jet have a much more relaxed velocity field. It therefore appears that the source of these turbulent velocities would come from the eastern side of the filament, while the radio jet is on the western side of it.
Thus, if the jet is responsible for creating the outer filament by interacting with the H I cloud, one would have to assume that the H I cloud is in front or behind the jet and that the turbulent layer around the jet is quite thick (in order to explain the distance between the jet and the compact knots in the outer filament) and that it has quite an irregular shape (in order to explain the offset of the knots from the H I cloud).
From the new velocity data obtained by Evans et al. (in prep.) it is evident that going from the outer filament (the side facing, in projection, the radio emission) to the filaments and the velocities go from about –200 km s-1 with respect to the systemic velocity to about –1200 km s-1 in filament (Graham & Price (1981), Evans in prep.). Such very high velocities are unlikely to have a gravitational origin. A possible explanation is that filaments and originally were gas clouds similar to the H I cloud observed next to filament (at a similar location with similar velocities), but that they are being carried outwards by a fast outflow of the radio plasma.
4.2.3 Clues on the ionization mechanism?
In summary, our radio image does not support a simple jet-cloud interaction picture for the filaments and a more complicated scenario is required. It is therefore still quite possible that both the effects of an interaction with material powered by the jet and photoionization from the central AGN are needed to explain all the observed properties of the filaments. Including a photoionization component has some advantages. For example, we note that the ionized gas is only found on one side of the radio emission, well aligned with the position angle of the inner radio jet. Assuming that this position angle defines also the position angle of the radiation from the nucleus, this could support the scenario in which clouds of gas are somehow disturbed by the passage of the radio plasma in the ISM (as discussed above), while the main ionization mechanism is the nuclear that is able to ionize all the clouds in the direction of the beam with the right density. Moreover, the new H I data of Oosterloo et al. suggest that the H I could be disturbed kinematically by the interaction, but it is not ionized by it. Schiminovich et al. already pointed out that the boundary between the H I cloud and the filament is very sharp and this would favour ionization by photons from the centre as the more likely explanation for the ionization of the filament.
It is difficult to disantangle the relative importance of the two possible mechanisms responsable for the ionization of the gas (photoionization from the nucleus or from shocks) in the filaments of Centaurus A. In the case of other radio galaxies (e.g. PKS 2250-41, Villar-Martin et al. 1998) very detailed and high-dispersion data have been used to resolve kinematically the emission from the gas which has interacted with the radio jet and the emission from the non-shocked ambient gas. This is a study that will have to be done as a follow up of the work presented here.
5 Acknowledgements
This work is based on observations with the Australia Telescope Compact Array (ATCA), which is operated by the CSIRO Australia Telescope National Facility. We are grateful to the staff of the Paul Wild Observatory (Narrabri) for the support during the observations. We thank David Clarke for his help in sorting out the polarization by providing us unpublished data. We also would like to thank Norbert Junkes for providing an electronic copy of his Parkes image that we have used in Fig.3 and Jane Turner for helping us with the ASCA data. Finally, we are indebted with Roberto Fanti, Robert Laing, Karl-Heinz Mack and Steven Spangler for useful discussions and suggestions.
References
- [1] Blanco V.M., Graham J.A., Lasker B.M., Osmer P.S. 1975, ApJ, 198, L63
- [2] Bicknell G.V. 1986, ApJ, 305, 109
- [3] Bicknell G.V., de Ruiter H.R., Fanti R., Morganti R., Parma P. 1990, ApJ, 354, 98
- [4] Bodo G., Rossi P., Massaglia S., Ferrari A., Malagoli A., Rosner R. 1998, A&A, 333, 1117
- [5] Bodo G., Massaglia S., Rossi P., Rosner R., Ferrari A., Malagoli A. 1995, A&A, 303, 281
- [6] Bridle A.H., Perley R.A. 1984, ARAA, 22, 319
- [7] Bridle A.H., Fomalont E.B., Cornwell T.J. 1981, AJ, 86, 1294
- [8] Burns J.O., Feigelson E.D., Schreier E.J. 1983, ApJ, 273, 128
- [9] Burns J.O. 1986, Can. Jour.Phys., 63, 373
- [10] Capetti A., Axon D.J., Macchetto F.D., Marconi A., Winge C. 1999, ApJ, in press (astro-ph/9811381)
- [11] Chambers K.C., Miley G.K., van Breugel W. 1987, Nature, 329, 604
- [12] Clark N.E., Tadhunter C.N., Morganti R., Killeen N.E.B., Fosbury R.A.E., Hook R.N., Siebert J., Shaw M.A. 1997, MNRAS, 286, 558
- [13] Clark N.E., Axon D.J., Tadhunter C.N., Robinson A., O’Brien P. 1998, ApJ, 494, 546
- [14] Clarke D.A., Burns J.O., Norman M.L. 1992, ApJ, 395, 444
- [15] Cooper B.F., Price R.M., Cole D.J. 1965, Aust. J. Phys., 18, 589
- [16] Fanaroff B.L., Riley J.M. 1974, MNRAS, 167, 31p
- [17] Feigelson E.D., Schreier E.J., Delvaille J.P., Giacconi R., Grindlay J.E., Lightman A.P. 1981, ApJ, 251, 31
- [18] Feretti L., Giovannini G., Klein U., Mack K.-H., Sijbring L.G., Zech G. 1998a, A&A, 331, 475
- [19] Feretti L., Perley R., Giovannini G., Andernach H. 1998b, A&A, in press (astro-ph/9810305)
- [20] Fosbury R.A.E., Morganti R., Wilson W., Ekers R.D., di Serego Alighieri S., Tadhunter C.N. 1998, MNRAS, 296, 701
- [21] Graham J.A., Price R.M. 1981, ApJ, 247, 813
- [22] Graham J.A. 1998, ApJ, 502, 245
- [23] Haynes R., Cannon R., Ekers R. 1983, Proc.A.S.A., 5, 241
- [24] Hui X., Ford H.C., Ciardullo R., Jacoby G.H. 1993, ApJ, 414, 463
- [25] Jones D.L., Tingay S.J., Murphy D.W. et al. 1996, ApJ, 466, L63
- [26] Junkes N., Haynes R.F., Harnett J.I., Jauncey D.L. 1993, A&A, 269, 29
- [27] Klein U. 1998, Lecture Notes in Physics, Proceedings of a workshop at Ringberg Castle on M 87, H.-P. Röser and K. Meisenheimer (eds.), Springer, Heidelberg
- [28] Killeen N.E.B., Bicknell G.V., Ekers R.D., 1988, ApJ, 325, 180
- [29] Israel F.P. 1998, A&A Rev., in press (astro-ph/9811051)
- [30] Laing R.A. 1993, in ”Astrophysical Jets”, eds. Bulgarella D., Livio M. & O’Dea, Cambridge Univ. Press, p.95
- [31] ack K.-H., Kerp J., Klein U. 1997, A&A, 324, 870
- [32] McCarthy P.J., van Breugel W., Spinrad H., Djorgovski S. 1987, ApJ, 321, L29
- [33] McCarthy P.J. 1993, ARAA, 31, 639
- [34] Morganti R., Fosbury R., Hook R., Robinson A., Tsvetanov Z. 1992, MNRAS, 256, 1p
- [35] Morganti R.,Robinson A., Fosbury R.A.E., di Serego Alighieri S., Tadhunter C., Malin D. 1991, MNRAS, 249, 91
- [36] Norman M.L., Burns J.O., Sulkanen M.E. 1988, Nature, 335, 146
- [37] Norman M.L. & Balsara D.S., 1993, in “Jets in Extragalactic Radio Sources”, Röser H.-P. & K. Meisenheimer, eds., Springer-Verlag, p. 229
- [38] Pacholczyk A.G. 1970, Radio Astrophysics, Freeman, San Francisco
- [39] Pringle J.E. 1997, MNRAS, 292, 136
- [40] Reynolds J.E. 1996, in “Australia Telescope Compact Array User’s Guide”, W.M. Walsh & D.J. McKay, eds
- [41] Sault R.J., Teuben P.J., Wright M.C.H. 1995, in Astronomical Data Analysis Software and Systems IV, R. Shaw, H.E. Payne and J.J.E. Hayes (eds), Astronomical Society of the Pacific Conference Series 77, p. 433
- [42] Schiminovich D., van Gorkom J.H., van der Hulst J.M., Kasow S. 1994, ApJ, 423, L101
- [43] Schreier E.J., Marconi A., Axon D., Caon N., Macchetto D., Capetti A., Hough J.H., Young S., Packham C. 1998, ApJ, 499, 143
- [44] Sutherland D., Bicknell G., Dopita M. 1993, ApJ, 414, 510
- [45] Taylor D., Morganti R. & Fosbury R., 1992, in “Extragalactic Radio Sources – from beams to jets” 7th IAP Meeting Roland J., Sol H. and Pelletier R. (eds.) Cambridge Univ. Press, p. 341
- [46] Tingay S.J. et al. 1998, ApJ, 115, 960
- [47] van Breugel W., Miley G., Heckman T. 1984, AJ, 89, 5
- [48] Villar-Martin M., Tadhunter C.N., Morganti R., Axon D., Koekemoer A. 1998a, MNRAS, submitted
- [49] Villar-Martin M., Tadhunter C.N., Morganti R., Clark N., Killeen N., Axon D. 1998b, A&A, 332, 479
- [50] Wright A. & Otrupcek R. 1990, Parkes Catalogue, Australia Telescope National Facility