Discovery of a Radio Flare from GRB 990123
Abstract
We report the discovery of a radio counterpart to GRB 990123. In contrast to previous well-studied radio afterglows which rise to peak flux on a timescale of a week and then decay over several weeks to months, the radio emission from this GRB was clearly detected one day after the burst, after which it rapidly faded away. The simplest interpretation of this “radio flare” is that it arises from the reverse shock. In the framework of the afterglow models discussed to date, a forward shock origin for the flare is ruled out by our data. However, at late times, some radio afterglow emission (commensurate with the observed late-time optical emission, the optical afterglow) is expected from the forward shock. The relative faintness of the observed late-time radio emission provides an independent indication for a jet-like geometry in this GRB. We use the same radio observations to constrain two key parameters of the forward shock, peak flux and peak frequency, to within a factor of two. These values are inconsistent with the notion advocated by several authors that the prompt optical emission detected by ROTSE smoothly joins the optical afterglow emission. Finally, with hindsight we now recognize another such radio flare and this suggests that one out of eight GRBs has a detectable radio flare. This abundance coupled with the reverse shock interpretation suggests that the radio flare phenomenon has the potential to shed new light into the physics of reverse shocks in GRBs.
1 Introduction
BeppoSAX ushered in 1999 with the discovery of a super-bright -ray burst, GRB 990123. This GRB was intensively studied by many groups worldwide. The burst is notable for the richness of new results: the discovery of prompt optical emission by ROTSE (Akerlof et al. 1999), the discovery of the brightest optical afterglow to date and its redshift (Kulkarni et al. 1999), and a break in the optical afterglow light curve (Kulkarni et al. 1999, Fruchter et al. 1999, Castro-Tirado et al. 1999).
To date, as a result of our radio afterglow program at the Very Large Array (VLA)111The VLA is operated by the National Radio Astronomy Observatory which is a facility of the National Science Foundation operated under a cooperative agreement by Associated Universities, Inc. and the Australia Telescope Compact Array (ATCA) we have detected radio afterglow emission in nine GRBs (e.g. Frail et al. 1997b; Taylor et al. 1998). Observations of radio afterglow have resulted in the first direct proof for relativistic expansion in GRBs (Frail et al. 1997b) and robust estimates of the total burst energy (Frail, Waxman & Kulkarni 1999).
The radio afterglow, when detected, exhibit the following pattern: the flux rises gradually to a maximum, persists for weeks to months before fading away. It is against this backdrop that we report, in this Letter, the discovery of a new phenomenon in the radio afterglow of GRBs – the discovery of a short lived (30 hours) radio emission in GRB 990123. This discovery, in a manner similar to the ROTSE discovery, adds yet another diagnostic – a probe of the reverse shock – to the study of GRBs.
2 Observations
OVRO Millimeter Array. Continuum observations in the 3-mm band were made with the Owens Valley Radio Observatory (OVRO) six element array on 1999 January 28.39 UT. We obtained about 5 hours of on-source integration time in good 3-mm weather. Two 1-GHz bandwidth continuum channels with central frequencies of 98.48 GHz and 101.48 GHz were observed simultaneously in the upper and lower side bands. The quasar 3C345 was used for phase calibration and 3C273 for absolute flux calibration; the observing procedure was otherwise similar to that described in Shepherd et al. (1998).
OVRO 40-m Telescope. The position of the optical transient was observed with the newly commissioned 30-GHz receiver on the 40-m OVRO telescope. The receiver has two beams, each with a full-width at half maximum (FWHM) of 1.5 arcminute, separated by 7.6 arcminute on the sky. The two beams were switched at 125 Hz and flux calibration was achieved by observations of 3C286. Pointing was monitored by frequent (20 minutes) observations of J1419+383 and J1613+342.
JCMT Observations in the 1.35-mm and 850-m bands were made at the James Clerk Maxwell Telescope (JCMT)222The JCMT is operated by The Joint Astronomy Centre on behalf of the Particle Physics and Astronomy Research Council of the United Kingdom, the Netherlands Organization for Scientific Research, and the National Research Council of Canada. using the Submillimeter Common-User Bolometer Array (SCUBA; Holland et al. 1998). The atmospheric opacity in the 850 m band was determined from skydip observations and that in the 1.35 mm band was inferred from skydips made at 225 GHz using a tipping radiometer. The short term variability of the atmospheric emission was estimated from the outer ring of pixels and subtracted from the central (photometric) pixel. Frequent observations of a blazar established that the pointing of the detector was better than 2 arcsecond. Except for the observations on January 24, the rest of the data were taken under excellent sky conditions.
VLA. All observations were obtained in two independent 50-MHz channels centered on 8.43 GHz and 8.48 GHz. The interferometer phase was calibrated using the nearby point source J1545+478. The flux scale was tied to the source 3C286. Data calibration and imaging were carried out with the AIPS software package following standard practice. A log of the observations and a summary of the results can be found in Table 5.
3 Results
OVRO Millimeter Array. The source was not detected on January 28. The final image has an effective central frequency of 99.98 GHz, a synthesized beam of (FWHM) at position angle , and an rms noise level mJy/beam. At the position of the OT we find a peak brightness of mJy/beam.
OVRO 40-m. Each observing run was about 2 hours long and the epochs of the four runs were (UT) January 24.5, February 5.5, February 6.5 and February 7.5. Bad weather prevented us from reaching thermal limits by almost a factor of 10. Averaging the four datasets we can place 3- upper limits of 13 mJy (Band A, 26–28 GHz), 10 mJy (Band B, 28–30 GHz), 12 mJy (Band C, 30–32 GHz) and 17 mJy (Band D, 32–34 GHz).
JCMT. As can be seen from Table 5 the source was not detected at any epoch save perhaps that of February 4.81 UT. On this epoch a source is seen with a signal-to-noise ratio (SNR) of 3.3, nominally a significant detection. However, single dish observations, unlike interferometric observations, are susceptible to several systematic errors. Our confidence in this detection would be strengthened if the if the source was well detected at least at one other epoch.
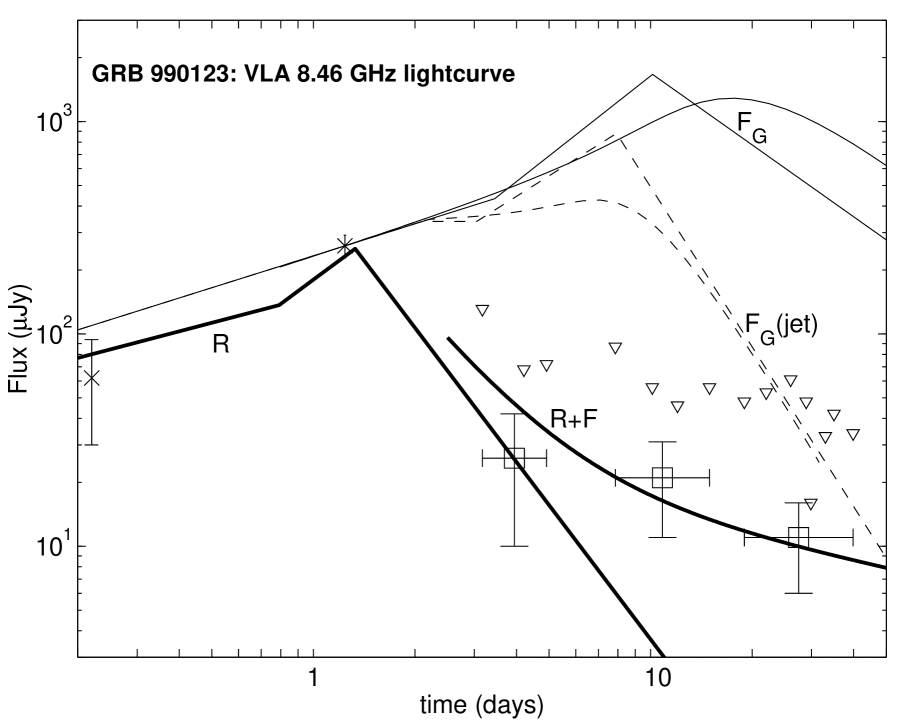
VLA. A strong source was detected in only one observation (January 24; see Table 5). This unresolved source, hereafter VLA J152530.3+444559, is located at (epoch J2000) = () = (). The coordinates of this source are in excellent agreement with the position of the optical transient (Kulkarni et al. 1999). As can be seen from Figure 1 the source rapidly fades and is only marginally detected (at the 2- level) over the next few weeks. Other than the detection on January 24th, there was no reliable detection at any other frequency or at any other epoch including other radio efforts (Galama et al. 1999). To our knowledge, this phenomenon – a short-lived radio emission or flare – is a new phenomenon in radio afterglow studies.
Given our claim of the discovery of a new phenomenon, it is important for us to demonstrate confidence in the existence of the source VLA J152530.3+444559. To this end we make the following observations. (1) The source is seen in many different subsets of the data of January 24. (2) The source is seen in both (circular) hands of polarization (the fractional circular polarization is less than 37% at the 99.9% confidence level). (3) The source is separately detected in each of our 50-MHz wide channels. (4) Finally, within errors the source has the expected point-spread function. In view of these tests, we conclude that the source VLA J152530.3+444559 is indeed a real source.
Around the epoch of the radio discovery, both optical (Kulkarni et al. 1999; Castro-Tirado et al. 1999, Galama et al. 1999) and X-ray afterglow (Heise et al. 1999) were strong and fading. In order to compare the radio observations with those at other wavelengths we parameterize the temporal behavior of the 8.46-GHz flux by a two-component power-law model: flux at time , . Here, the time is measured with reference to the GRB event and d is the epoch of the VLA detection of the radio emission; is the 8.46-GHz flux at that epoch and the subscript “r” (“d”) stands for “rise” and refers to (“decay” with ). Between January 23.63 and 24.65, we find the flux rose with (mean estimator). From a Monte Carlo analysis we find (95% confidence level). For we find Jy and (14 d.o.f., ). At the 95%-confidence level, and is at the 99.9%-confidence level. Clearly the source faded and we can, with great certainty, rule out light curves (for ) with rising, constant or even slowly decaying emission.
4 Origin of the Radio Flare
The simplest possibility is that the radio flare was amplification due to interstellar scattering and scintillation (ISS). However, if this was a typical radio afterglow we expect the afterglow to grow stronger with time along with additional opportunities for scintillation. As can be seen from Figure 1 the source was never reliably detected after January 24 thereby rendering the ISS hypothesis unlikely.
Sari & Piran (1999) suggest that both the prompt optical emission (Akerlof et al. 1999) and our radio flare arise from the reverse shock. In this model, the particles in the reverse shock cool adiabatically while there is a continual supply of newly energized particles in the forward shock. Consequently, with the passage of time, the emission from the reverse shock shifts rapidly to lower frequencies. At early times, self-absorption suppresses the radio flux and at late times adiabatic cooling results in weak emission. Due to these competing effects the emission from reverse shock is seen briefly – a radio flare. In contrast, Galama et al. (1999) have proposed that the radio flare arises in the forward shock i.e. the usual afterglow emission. We now investigate this proposal in some detail.
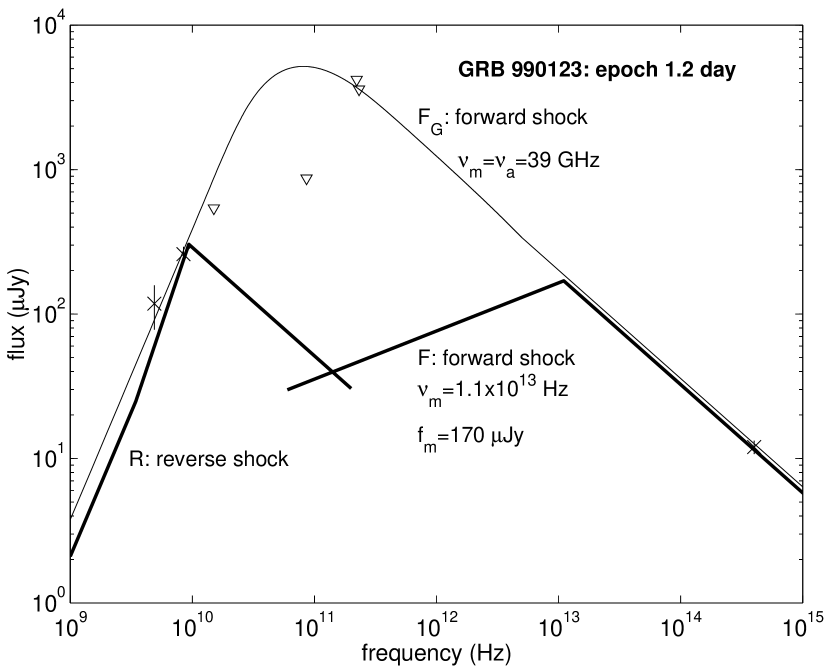
At a given time, the broad-band afterglow spectrum can be described by three power laws and three characteristic frequencies (e.g. Sari, Piran & Narayan 1998): (i) at high frequencies, ; (ii) at low (radio) frequencies, with (iii) bridging the two regimes. Here, is the power law index of the shocked particles in the forward shock and is usually about 2.5. is the frequency at which the broad-band spectrum peaks (peak flux is indicated by ) and is the frequency at which the synchrotron optical depth is unity.
As noted by Galama et al. (1999), the multi-wavelength data at the epoch of the VLA 8.46-GHz detection (epoch, ) can be fitted to an afterglow model with GHz and GHz. In this model, one expects the 8.46-GHz flux to initially rise and decay when falls below . This is expected to take place at epoch ; here, GHz. This expectation is in clear contradiction with our measurements (§3).
The rapid fall in the radio data thus requires that be comparable and preferably below . Galama et al. (1999) noting this requirement suggested a model with GHz at epoch . In Figure 2 we display the spectrum with GHz at epoch ; hereafter, we refer to this as model “”. The specific value of was chosen so the spectrum fits both the optical -band flux and the VLA 8.46 GHz detection. Model violates the 15 GHz and 86 GHz upper limits. Furthermore, in this model, we expect the radio flux to start decaying at epoch or 3.5 d – in violation of the VLA observations. The true situation is even worse. When , the latter will not remain time invariant but evolves as . This should cause the flux to increase faster as . Only when falls below will the 8.46-GHz emission start decaying and this will not happen until d. The above argument used asymptotic limits of the broad-band curve. In Figure 1 we display the evolution of the models with spectra shown in Figure 2 using the usual prescription (e.g. Sari et al. 1998). The refined light curves, while smoother, do not agree with the observations.
To conclude, in the framework of standard afterglow models (by which we mean models which assume a power law shocked particle spectrum and constant fraction of energy in electrons and magnetic fields, relative to the thermal energy of the shocked particles, no choice of and (including the case when ) can explain the rapid decay of the radio flux together with the observed optical afterglow light curve. Our calculations are thus in disagreement with the model proposed by Galama et al. (1999); essentially the same difficulty exists with the models used by Wang, Dai & Lu (1999) and Dai & Lu (1999). Shi & Gyuk (1999) overcome this difficulty by appealing to special geometry (rapid interaction of the blast wave with a cloudlet). Apart from invoking tremendous energy in the burst ( erg) their model is unable to account for the smoothly decaying optical afterglow light curve.
Galama et al. (1999) speculate that the broadening of the characteristic frequencies () may lead to a rapid decay of the radio flux. In our opinion, broadening the characteristic frequencies will smooth the predicted light curve but this does not help address the fundamental problem of rapid decay. In the framework of the forward shock model, the radio flare can be accounted only if the characteristic frequencies can be evolved much faster than that given by standard dynamics. In contrast, the reverse shock model provides a natural and consistent explanation for the radio flare.
5 Radio Emission From the Forward Shock
Accepting the conclusion that the radio flare arises in the reverse shock we now discuss the radio emission at late times, . At such late times, we expect some radio emission from the forward shock but with conventional properties, i.e., radio flux slowly rising to a maximum value () at time weeks, and then decaying in much the same way as the optical afterglow. This is an inevitable consequence of the observed optical afterglow emission.
The highest measured afterglow flux (excluding the ROTSE observations that we associate with the reverse shock emission) is the Gunn -band flux, Jy at epoch hr (Kulkarni et al. 1999). Clearly, and , the epoch at which the band flux peaks is . Thus we expect a peak flux in the 8.46-GHz band and this peaks at epoch d; here, is the center frequency of the -band, Hz. From this it follows that we should have seen at least Jy in d after the burst. As can be seen from Figure 1 and Table 5 (also §3) our observations are sensitive enough to exclude such strong emission. Radio emission can be suppressed by invoking . However, this condition would also suppress the radio emission from the reverse shock and thus be unable to account for the radio flare (see §4).
Kulkarni et al. (1999) have interpreted the break in their -band afterglow emission as due to a jet. The lack of significant radio emission is in excellent agreement with the jet hypothesis. Let be the time at which the jet’s lateral dimensions become visible to the observer and/or the spreading of the jet begins. If then the radio flux is but , otherwise (Sari, Piran & Halpern 1999). We do note that these scalings for a spreading jet are different from those derived by Rhoads (1998) who assumed .
From the -band observations we obtain d (Kulkarni et al. 1999). Up to epoch , the radio flux increases as and the expected radio flux at epoch is Jy. Limiting to we fit a power law to observed fluxes after subtracting the contribution from the reverse shock (see Figure 1; also Sari & Piran 1999 for details of the reverse shock model). The best fit model yields Jy from which we infer Jy. At the 95% confidence level, the radio emission is constrained to be less than Jy which implies Jy. An additional and independent constraint comes from our late time (May 1999) observations (these observations were not used in the fits shown in Figure 1). At the 95% level, our model predicts Jy which should be compared to the observed mean flux of Jy (see Table 5).
Combining the inferred from the radio observations with the -band power law decay (flux ), we find hr. Earlier in this section we noted some constraints on and . Taken together, we find Jy and hr. Several authors (e.g. Galama et al. 1999, Castro-Tirado et al. 1999) have proposed that the ROTSE light curve smoothly blends into the optical afterglow emission. This hypothesis yields mJy, certainly inconsistent with our result above. In our opinion, the observational basis for this assertion is questionable given the differing slopes of the ROTSE light curve and the optical afterglow light curve.
We end by noting that early time radio observations could potentially offer a unique insight into the physics of the reverse shock (Sari & Piran 1999, Mészáros & Rees 1999). Motivated thus, we have re-examined archival data on other bursts and found evidence for a radio flare in GRB 970828. The specific incidence of radio flares of 1:8 appears to be significantly larger than that of prompt optical emission obtained by ROTSE or LOTIS.
REFERENCES
Akerlof, C. W. 1999 Nature, 398, 400
Castro-Tirado, A. J. et al. 1999, Science, 283, 2069
Dai, Z. G. & Lu, T. 1999, astro-ph/9904025
Frail, D. A. et al. 1997b, Nature, 389, 261
Frail, D. A., Waxman, E. & Kulkarni, S. R. 1999, in prep
Fruchter, A. S. et al. 1999, ApJ, 519, L13
Galama, T. et al. 1999, Nature, 398, 394
Heise, J. et al. 1999, Nature, submitted
Hjorth, J. et al. Science, 283, 2073
Holland, W.S., Robson, E.I., Gear, W. K., Cunningham, C.R., Lightfoot, J. F., Tim Jenness, T., Ivison, R. J., Stevens, J. A., Ade, P. A. R., & Griffin, M. J. 1998, MNRAS, 303, 659
Kulkarni, S. R. et al. 1999, Nature, 398, 389
Mészáros, P. & Rees, M. R. 1999, astro-ph 9902367.
Rhoads, J. E. 1999, preprint
Sari, R., Piran T. 1999, ApJ, 517, L109
Sari, R., Piran T. & Narayan, R. 1998, ApJ, 497, L17
Sari, R., Piran T. & Halpern, J. 1999, ApJ, 519, L17
Shepherd, D. S., Frail, D. A., Kulkarni, S. R. & Metzger, M. R. 1998, ApJ, 497, 859
Shi, X. & Gyuk, G. 1999, astro-ph/9903023
Taylor, G. B., Frail, D. A., Kulkarni, S. R., Shepherd, D. S., Feroci, M. & Frontera, F. 1998, ApJ, 502, L11
Wang, X. Y., Dai, Z. G. & Lu, T. 1999, astro-ph/9906062
Radio Observations of GRB 990123 \pt@calcnlines\set@mkcaption
[t]=\pt@tabularlrrrc1999 Jan 23.63 & VLA 15 36 6232
1999 Jan 24.65 VLA 15 36 26032
1999 Jan. 24.68 JCMT 47 1.35
1999 Jan 26.58 VLA 10 36 5339
1999 Jan 27.62 VLA 26 36 1825
1999 Jan. 27.82 JCMT 37 1.35
1999 Jan. 27.88 JCMT 75 0.85
1999 Jan 28.32 VLA 37 36 2225
1999 Jan. 29.88 JCMT 60 0.85
1999 Jan 31.27 VLA 76 36 4919
1999 Feb 02.52 VLA 25 36 426
1999 Feb 04.43 VLA 78 36 1416
1999 Feb. 04.81 JCMT 40 0.85
1999 Feb. 05.83 JCMT 90 0.85
1999 Feb. 06.84 JCMT 45 0.85
1999 Feb 07.36 VLA 48 36 1023
1999 Feb. 07.83 JCMT 15 0.85
1999 Feb. 07.85 JCMT 30 1.35
1999 Feb 11.37 VLA 109 36 1616
1999 Feb 14.44 VLA 44 36 1718
1999 Feb 18.43 VLA 31 36 2717
1999 Feb 21.34 VLA 136 36 2412
1999 Feb 22.29 VLA 145 36 11
1999 Feb 25.37 VLA 46 36 18
1999 Feb 27.37 VLA 86 36 1414
1999 Mar 04.27 VLA 132 36 813
1999 May 06.29 VLA 110 36 610
1999 May 07.41 VLA 170 36 910
\pt@box\pt@box\pt@box\spew@ptblnotes