Infrared spectroscopic variability of Cygnus X-3 in outburst and quiescence
Abstract
We present four epochs of high-resolution infrared spectroscopy of the peculiar X-ray binary Cygnus X-3. The observations cover quiescent, small flaring and outburst states of the system as defined by radio and X-ray monitoring. The underlying infrared spectrum of the source, as observed during radio and X-ray quiescence and small flaring states, is one of broad, weak He ii and N v emission. Spectral variability in this state is dominated by modulation at the 4.8 hr orbital period of the system. H-band spectra confirm the significant hydrogen depletion of the mass donor. The closest spectral match to the quiescent infrared spectrum of Cyg X-3 is an early-type WN Wolf-Rayet star.
In outburst, the infrared spectrum is dramatically different, with the appearance of very strong twin-peaked He i emission displaying both day-to-day variability and V(iolet)/R(ed) variations with orbital phase. We argue that the twin-peaked emission cannot arise in relativistic jets or, unless the distance to Cyg X-3 is severely overestimated, an accretion disc. The most likely explanation appears to be an enhanced stellar wind from the companion. Thus X-ray and radio outbursts in this system are likely to originate in mass-transfer, and not disc, instabilities, and the lengthening of the orbital period will not be smooth but will be accelerated during these outbursts. Furthermore, the appearance of these lines is suggestive of an asymmetric emitting region. We propose that the wind in Cyg X-3 is significantly flattened in the plane of the binary orbit. This may explain the observed twin-peaked He i features as well as reconciling a massive Wolf-Rayet secondary with the relatively small optical depth to X-rays, if the disc wind is inclined at some angle to the line of sight. A small set of observations following outburst, when the system was returning to a more quiescent X-ray and radio state, reveal strong He i 2.058 m absorption with a clear P-Cygni profile, at the same time as the more common weak He ii and N v features. In a disc-wind geometry this can be interpreted as absorption in the densest, accelerating regions of the wind which can be viewed directly if the disc is inclined at some angle to the line of sight.
keywords:
binaries: close – stars : individual : Cygnus X-3 – circumstellar matter – infrared : stars1 Introduction
Cygnus X-3 is a heavily obscured luminous X-ray binary in the Galactic plane which displays a unique and poorly-understood combination of observational properties. These include strong radio emission, with a flat spectrum extending to (at least) mm wavelengths in quiescence (e.g. Waltman et al. 1994; Fender et al. 1995) and giant flares which are associated with a relativistic jet (e.g. Geldzahler et al. 1983; Fender et al. 1997; Mioduszewski et al. 1998). In the infrared the system is bright with occasional rapid flare events and thermal continuum consistent with a strong stellar wind (e.g. van Kerkwijk et al. 1996; Fender et al. 1996). There is no optical counterpart at wavelengths shorter than m due to heavy interstellar extinction. The system is persistently bright in soft and hard X-rays (e.g. van der Klis 1993; Berger & van der Klis 1994; Matz et al. 1996), with strong and variable metal emission lines (e.g. Liedahl & Paerels 1996; Kawashima & Kitamoto 1996). Several detections at -ray energies have been claimed but rarely confirmed (see e.g. Protheroe 1994). A clear and persistent (observed for yr) asymmetric modulation in the X-ray and infrared continuum emission with a period of 4.8 hr (e.g. Mason, Cordova & White 1986) is interpreted as the orbital period of the system. This period is rapidly lengthening with a characteristic timescale of less than a million years (e.g. Kitamoto et al. 1995)
Infrared spectroscopy of the system in 1991 (van Kerkwijk et al. 1992) first revealed the presence of broad emission lines and an absence of hydrogen which was reminiscent of Wolf-Rayet stars. These observations have subsequently been confirmed and expanded upon (van Kerkwijk 1993; van Kerkwijk et al. 1996) and the binary interpreted as comprising a compact object (neutron star or black hole) and the helium core of a massive star, embedded within a dense stellar wind. Such an evolutionary end-point was predicted for Cyg X-3 as far back as 1973 by van den Heuvel & de Loore (1973). Unfortunately most models of Wolf-Rayet stars do not envisage objects which can be contained within a 4.8 hr orbit, causing some dispute over this interpretation (e.g. Schmutz 1993). Doppler-shifting of the broad emission lines with the orbital period of the system, with maximum blue shift at X-ray minimum, is interpreted by van Kerkwijk (1993) and van Kerkwijk et al. (1996) as being due to the lines arising in the region of the stellar wind shadowed from the X-rays of the compact object by the companion star. In this way the semi-amplitude of the Doppler-shifts reflects only the wind velocity and gives no information on mass function of the system. Schmutz, Geballe & Schild (1996) interpret the Doppler-shifting of the emission lines with the orbital period more conventionally as tracking directly the motion of the companion star and derive a mass function which implies the presence of a black hole of mass in the system. However their intepretation does not explain the phasing of the emission lines relative to the X-rays, nor is this discrepancy addressed in their work.
Mitra (1996, 1998) has argued that Cyg X-3 cannot contain a massive W-R star as the optical depth to X-rays for a compact object in a tight 4.8-hr orbit would be . The alternative explanation put forward is that Cyg X-3 instead contains a neutron star and an extremely low-mass dwarf, cf. PSR 1957+20.
Van Kerkwijk (1993) discussed the dramatic variability in line strengths and line ratios in the infrared spectra of Cyg X-3 and suggested that when the source is bright in X-rays the emission lines should be weak and orbitally modulated, but when the source is weak in X-rays the lines should be strong and show little orbital modulation. However, as noted in van Kerkwijk et al. (1996), Kitamoto et al. (1994) show that the strength of infrared line and X-ray emission are in fact probably broadly correlated from epoch to epoch, with the strong lined spectrum of 1991 being obtained during an outburst of the system. The explanation put forward for this was enhanced mass loss from the companion during outbursts, which both increases X-ray brightness (more accretion) and emission line strengths. This model was combined with detailed radio, (sub)mm and infrared (photometric) observations obtained during an outburst, and expanded upon in Fender et al. (1997). Waltman et al. (1997) clearly indicate the epochs of the published infrared spectra against the Green Bank 2 GHz radio monitoring of the system.
In this paper we present four epochs of high-resolution infrared spectroscopy of Cyg X-3 with the Multiple Mirror Telescope over a two year period. These observations cover periods of quiescence, small flaring and major outburst as revealed in radio and X-ray monitoring, and we discuss the clear changes in the spectrum of the source as a function of state. In a future paper will analyze and discuss the results of our spectra that fully sample the entire orbit of Cyg X-3 during quiescence and during outburst.


2 Observations
2.1 Infrared
All observations were made using the Steward Observatory’s infrared spectrometer, FSpec (Williams et al. 1993), on the Multiple Mirror Telescope (MMT). The spectra were taken using the medium resolution, 300 g/mm grating, yielding a 2 pixel resolution element of 0.0018 m, or R 1200 at 2.12 m, and R 900 at 1.62 m. The same observing procedure was used on all nights. A full log of these observations is provided in Appendix A.
The spectrometer has a slit size of on the MMT, allowing Cyg X-3 to be observed in four unique positions along the slit. In the reductions, after dark current had been subtracted and a flat field divided from the raw two-dimensional images, sky emission and additional thermal background was removed by subtracting one slit position from the next. The integration times for Cyg X-3 were very long, either 2 or 4 minutes at each slit position (see tables in Appendix A). This is long enough that the strong atmospheric OH emission lines did not always subtract away cleanly due to temporal variations in atmospheric conditions between slit positions. In many cases, a few percent scaling was required to get the OH features to disappear entirely. Background normalization of a few percent was performed to remove fluctuations in thermal background between integrations.
Interspersed between our Cyg X-3 observations we obtained spectra of other stars which were used to correct for telluric absorption features. The same telluric standard star, HR 7826, an A1 V, was used through out all observations. The intrinsic spectrum of the standard star, HR 7826, was determined using two secondary telluric standard stars, HR 7503 (16 Cyg A), a G1.5 V and the O3 If*, Cyg OB2 #7. A first estimate of the intrinsic spectrum of HR 7503 was obtained using a solar spectrum. The 2 m spectrum of Cyg OB2 #7 is nearly featureless, with the exception of N iii at 2.115 m (Hanson, Conti & Rieke 1996). The A1 V telluric standard contains only the Br feature. By ratioing these three spectroscopically unique telluric standard stars against each other, we were able to obtain a good determination of the intrinsic spectrum of each star. The intrinsic spectrum of HR 7826 was determined during our first observing run in June 1996. This solution for the intrinsic spectrum was used through out that run and with all future observing runs. If our determination of the intrinsic spectrum of HR 7826 is not exactly correct, which is certainly the case at some level, any spurious features we have introduced will at least be consistently introduced into all of our Cyg X-3 spectra. This is important since it is our hope to study flux and velocity variations of very weak broad features in Cyg X-3 in an upcoming paper.
Mean spectra for the four epochs of observation, and their relation to the changing X-ray and radio state of Cyg X-3, are shown in Fig 1. Note that these spectra are not normalised, whereas those throughout the rest of the paper are. This is in order to show the approximate constancy of the continuum slope in different states. The correlation between radio flaring and bright X-ray states, originally proposed by Watanabe et al. (1994) is also obvious from Fig 1.
We began our first Cyg X-3 observing campaign in late May, 1996, which is symbolized in Figure 1 as epoch A. For ten of the eleven consecutive nights, Cyg X-3 was observed at approximately the same UT. Because a 24 hour daily cycle is almost exactly five binary orbits, we were observing Cyg X-3 at close to the same orbital phase for these ten nights (see Table 1 in Appendix A). Furthermore, on 2 June 1996, Cyg X-3 was observed over an entire orbital period, from = 0.185 to 1.181 (quadratic ephemeris of Kitamoto et al. 1995, where corresponds to minimum X-ray flux in the 4.8 hr modulation, probably the point of superior conjunction of the compact object). During this first campaign, -band spectra centred at 1.62 m were also obtained on the 7th and 8th of June 1996 (see Fig 2).
The second campaign of observations, represented by epoch B in Figure 1, began 22 September 1996, where we obtained spectra covering the entire orbital period, from = 0.382 to 1.429. One fifth of an orbit was observed the following night (Table 2 in the Appendix). The third observing campaign covered five consecutive nights beginning 16 July 1997 (Table 3 in the Appendix) and are represented in Figure 1 as epoch C. The fourth night of the observations taken during epoch C covered one orbit, sampling from = 0.205 to 1.109. Our final observing campaign, represented by epoch D in Figure 1, covered just one quarter of an orbital period on 15 October 1997.
2.2 Radio
The Ryle Telescope observations, at 15 GHz with a bandwith of 350 MHz, follow the pattern described in Fender et al (1997). Data points shown in Figs 1 and 3 are 5-min integrations. The typical uncertainty in the flux-density scale from day to day is 3%, and the rms noise on a single integration is less than 2 mJy.
2.3 XTE
Cyg X-3 is monitored up to several times daily in the 2-12 keV band by the Rossi XTE All-Sky Monitor (ASM). See e.g. Levine et al. (1996) for more details. The total source intensity in the 2-12 keV band for individual scans is plotted in the top panels of Figs 1 and 3.
3 Line Identifications
Line identifications in Cyg X-3 are shown in Figure 2 and listed in Table 1. We display two different -band spectra in Figure 2, the upper taken during a time of high x-ray and radio activity, the lower taken during quiescence. The strongest features include the 2.0587 m He i singlet during outburst and the 2.1891 He ii (7-4) during quiescence. The -band spectrum centered at 1.62 m, displays only a few identifiable features, He II (13-7) and (12-7) at 1.5719 and 1.6931m, respectively, and N v (10-9) at 1.554 m. These H-band features were also evident in earlier UKIRT spectra from 1992 May 30, one day after K-band spectra revealed Cyg X-3 to be in a weak-lined state equivalent to quiescence as defined in this paper (M.H. van Kerkwijk private communication). There is no evidence for any Brackett series hydrogen features. The -band spectrum shown in Figure 2 was taken in June 1996, when Cyg X-3 was in a quiescent phase.
| Ion | Transition | Vacuum | Equiv. Width (Å) | FWHM (Å/ km s-1) | ||
|---|---|---|---|---|---|---|
| (m) | Quiescence1 | Outburst1 | Quiescence1 | Outburst1 | ||
| N v | (10-9) | 1.554 | -15 | – | 130/1500 | – |
| He ii | (13-7) | 1.5719 | -12 | – | 90/1700 | – |
| He ii | (12-7) | 1.6931 | -9 | – | 80/1400 | – |
| He ii | (15-8) | 2.0379 | -10 | 1 | 150/2200 | 70/1000 ? |
| He i | 6 | 2.04302 | blended | -1? | blended | ? |
| He i | 2.0587 | 2 | -25 | ? | 150/2200 | |
| N v | (11-10) | 2.1000 | -7 | -3 | 120/1700 | 150/2200 |
| -2 | -12 | blended | blended | |||
| UAF | 2.129 | +1 | 1 | 17/250 | 18/250 | |
| -7 | -25 | blended | blended | |||
| He ii | (10-7) | 2.1891 | -15 | -12 | 140/1900 | 200/2700 |
| 1Low state observed June 1996, Outburst observed June 1997. | ||||||
| 2Blended; line centre not well enough constrained to determine precise electronic transitions | ||||||
There is one absorption feature, centered at approximately 2.129 m, that we have been unable to positively identify. It is unlikely that it is a feature due to intervening interstellar material, as numerous stars with line of sight extinction greater than ten magnitudes in the visible have been observed without ever showing such a feature (Tamblyn et al. 1995; Hanson, Howarth & Conti 1997; Watson & Hanson 1997). We suspect then, it must be related to the Cyg X-3 system. Curiously, it shows no shifting with the orbit, unlike the other lines in the K-band (with the possible exception of He i at 2.058 m). This unidentified absorption feature (UAF), has since disappeared from the spectrum, starting in June 1997. We have seriously considered that the feature may be spurious, introduced by poor telluric corrections, or perhaps a bad pixel on the array. However, we see it present through out the entire 11 day run in 1996 June, despite small changes in grating position, against three different telluric standard stars, and new calibration images taken each day. Furthermore, inspection of earlier 2 m spectra of Cyg X-3, while of lower resolution, seems to substantiate the presence of a weak absorption feature at 2.129 m (van Kerkwijk et al. 1996). However without an identification, we are unable to comment further on its nature or its possible relation to the Cyg X-3 system.
4 Spectral variability
In this section we discuss the observational properties at each of the four epochs for when near-infrared spectra were obtained. It is our aim to establish the spectral characteristics and nature of any variations seen in Cyg X-3 in different radio and X-ray states. This may help us to identify the origin of the spectral features, be they from the secondary star or the compact object. Spectra characteristic of each epoch are plotted in Fig 1.
4.1 1996 May / June : quiescence
Represented by epoch A in Figure 1, this is the longest continuous set of near-infrared observations ever taken of Cyg X-3. The source is in a state of radio and X-ray quiescence, with radio flux densities at 15 GHz in the range 40 – 140 mJy and XTE ASM fluxes in the range 4 – 9 count/sec. The spectrum is dominated by broad weak He ii and N v emission, and weak, more narrow and intermittent He i (2.058 m) absorption. Nearly all spectral variability is related to the 4.8 hr orbital modulation, namely Doppler-shifting of the broad emission features. The full amplitude of the Doppler-shifting is of the same order as that reported by van Kerkwijk (1993) and Schmutz et al. (1996), i.e. – km s-1. Orbitally phase-resolved spectra and dynamical interpretations will be presented elsewhere. The unidentified absorption feature (UAF) at 2.129 m is also detected, but cannot be clearly identified with any known transition. The UAF shows no Doppler-shifting.
4.2 1996 September : small flaring
The second set of observation, epoch B in Figure 1, caught Cyg X-3 in a more active phase. Radio observations at 15 GHz showed many small flares with flux densities ranging from 50 – 450 mJy, corresponding to the ‘small flaring’ state classified by Waltman et al. (1995). The XTE ASM recorded 8 – 17 count/sec, significantly higher and more variable than in 1996 May / June. However, the K-band spectrum is very similar to that obtained at epoch A, showing little variability that is not orbitally-related, and being dominated by the broad weak He ii and N v emission. The unidentified absorption feature at 2.129 m appears to have weakened considerably in the three months since 1996 May / June.

4.3 1997 June : outburst
Epoch C represents observations during a major outburst of Cyg X-3. XTE ASM count rates varied rapidly between 14 – 32 ct/sec, having peaked at ct/sec around 100 days earlier. The radio emission was undergoing a second sequence of major flaring within 200 days. During the period of these observations flux densities of up to 3 Jy at 15 GHz were recorded. During the first period of radio flaring (MJD 50400 – 50500) Mioduszewski et al. (1998) clearly resolved an asymmetric, probably relativistic, jet from the source.
The K-band spectrum at this epoch is wildly different from that at any other epoch, being dominated by what appear to be very strong double-peaked He i emission features, most obviously at 2.058 m. Significant day-to-day spectral changes which are not related to orbital phase are evident at this epoch, unlike in quiescence (where spectral variability is almost entirely due to orbital modulation – see above).
Figure 3 illustrates the dramatic variability in the strength of the double-peaked He i emission over the five nights of observations : strongest emission is present on the fourth night, 1997 June 19. Fig 4 shows in detail the rapid V/R variability, probably cyclic at the 4.8 hr orbital period, observed on this date. Figure 3 also hints at a possible anti-correlation between 2-12 keV X-ray flux and He i emission line strength on day timescales; while there is a large degree of X-ray variability in individual scans, the daily-averaged flux drops during the first four days to a minimum just after June 19. This is in contrast to the longer-term correlation between X-ray state and He i line strength, and probably results from a drop in ionisation state of the wind following a temporary decrease in X-ray flux.

The dramatic day-to-day variability illustrated in Figure 3 suggests that the lines seen are transient features which are not tied to a steady-state wind of the secondary. The wind is most likely changing in ionisation state and/or density/velocity on day timescales. The strongest peak seen in He i on day 4, showing up blue-shifted at = 0.0 and red-shifted at = 0.5, is clearly evolving on a timescale of days, more than tripling in strength between days 3 – 4, and declining again within 24 hr. The appearance of the 1.0830 m He i feature on 14 June 1993 (van Kerkwijk et al. 1996) likely represented another one of these events, though 2 m spectra are not available to confirm. van Kerkwijk et al. (1996) do, however, show there was a marked increase in K-band flux on 14 June 1993. Such near-infrared flux increases on day timescales have been seen during radio outbursts (Fender et al. 1997), and appear to be distinct from the more rapid (second to minutes timescales) infrared flaring which is often observed (e.g. Fender et al. 1996).
4.4 1997 October : post-outburst / small flaring
A single short (64 min total) observation on 1997 October 15 ( = 0.58 - 0.81), during an apparent decline to quiescence following outburst, epoch D again reveals previously unobserved features. Alongside the quiescent weak broad He ii and N v emission is strong He i 2.0587 m absorption, displaying a P-Cygni profile. This absorption is stronger than observed at any time during epoch A. The absorption is present in all individual spectra, and there is no evidence for significant variability on short (minutes) time scales. The absorption minimum occurs within uncertainties at the rest wavelength of the transition, 2.058 m, and the blue wing extends to 2.054 m, implying a minimum outflow velocity of 500 km s-1. The He I absorption feature does not display any Doppler-shifting, though our phase coverage is not ideal. There are no other significant absorption features in the spectrum. The UAF feature is entirely absent.
A comparison of the spectrum around the He I 2.0587 m with that in outburst (Fig 5) shows that the deep absorption may well be present in outburst also, but is completely dominated by much enhanced emission at this stage. This is compatible with the model for a disc-like wind which we explore in section 6 below.
5 Discussion
5.1 The Near-Infrared Spectral Type of the Secondary
Van Kerkwijk et al. (1992) published the first near-infrared spectra of Cyg X-3, covering 0.72-1.05 m (I-band) and 2.0-2.4 m (K-band). These spectra, taken in late June 1991, displayed strong emission lines of He i and He ii. The I-band spectrum in particular, showed a conspicuous absence of hydrogen lines. The lack (or much reduced fraction) of hydrogen, the strong He i emission at 2.058 m, and the broad He ii emission lines were interpreted as coming from the wind of the binary companion to the compact object in Cyg X-3. Based on the 1991 spectrum, and using comparison spectra obtained of several Wolf-Rayet stars which were observed at the same time, a spectral type of WN7 was estimated for the companion. There are some problems, however, with the June 1991 spectra. The spectrum showed strong narrow He i at 2.0578 m with strong, broad He ii, which is not generally seen in hydrogen-free WN Wolf-Rayet stars (Figer, McLean & Najarro 1997; c.f. WR 123 in Crowther & Smith 1996). This subtle mis-match of spectral characteristics suggested that the lines seen in the original June 1991 spectrum did not originate solely from a WR-like wind. Indeed, subsequent spectra taken by van Kerkwijk et al. (1993) showed that the originally strong He i features had since disappeared. These later spectra were now dominated by the broad He ii features, as well as N v and N iii. Such features are indicative of an earlier WR wind, perhaps WN4/5. However, as noted by van Kerkwijk et al. (1996), the line ratios between the nitrogen and He ii lines are not consistent with such an early spectral class. In fact, the near-infrared He ii lines in Cyg X-3 are extremely weak compared to other early WN stars (Crowther & Smith 1996; Figer et al. 1997).
We are now able to show that the original 1991 June spectrum of van Kerkwijk et al. (1992) was anomalous and almost certainly associated with an outburst in the system. Our 1997 June spectra are dominated by double peaked emission, which does not seem to be traced in the original 1991 spectrum. However, by choosing a phase that was dominated by one peak and smoothing our spectra to the lower resolution of the van Kerkwijk et al. (1992) spectrum, our 1997 June spectra became a very close match in both lines detected and relative strength to the 1991 spectrum (Fig 6). As already suspected by van Kerkwijk et al. (1996), the original K-band spectrum of van Kerkwijk et al. (1992) therefore appears to have been anomalous due to an outburst of Cyg X-3.
The quiescent spectrum, dominated by weak, broad He ii features, likely originates in the more steady-state wind of the stellar companion of Cyg X-3 and is our best diagnostic of the nature of this component. However, even this phase is not consistent with a normal WR wind. As first suggested by van Kerkwijk (1993), the presence of the high energy compact object, circling the companion star at very close radii (estimated to be on the order of 5 R⊙), has likely altered the wind structure of its companion (the “Hatchett McCray effect,” Hatchett & McCray 1977). Stellar winds in early-type stars are driven through high opacity resonance lines of such species as C iv and N v. The predominance of very high energy photons from the compact object completely alters the ionization structure and thus the driving force of the wind, and may entirely eliminate significant line formation (McCray & Hatchett 1975). In the presence of the compact object, an X-ray-excited, thermally driven wind is instead created, which may have little or no line formation (Stevens 1991; Blondin 1994). Where the compact object is entirely blocked by the central disk of the companion, the expanding wind from the helium star may be capable of creating a normal line-driven wind, giving rise, at least weakly, to the broad high ionization wind lines detected in Cyg X-3.
With such an interpretation for the line emission seen at near-infrared wavelengths, it would be difficult to infer many characteristics of the companion star. The most important characteristics of the companion star are that it is a helium rich atmosphere, and it may be driving a fairly extensive, fast wind, both being reminiscent of late-stages in massive star evolution. An early WN Wolf-Rayet star is likely the best candidate for the spectral type of the companion star. However, the mass of the companion star, and thus information on the mass of the compact object, can not be uniquely or confidently determined from the spectrum.
5.2 Twin-peaked He I emission in outburst
Here we discuss possible origins for the strong twin-peaked He i emission observed during outburst.


5.2.1 Jets ?
Simple arguments show that the twin-peaked emission lines cannot arise directly from material in the relativistic outflows which are inferred from high-resolution radio mapping of Cyg X-3 (e.g. Geldzahler et al. 1983; Mioduszewski et al. 1998). Firstly, the persistently stronger red wing as shown in Figure 5 is the opposite of what would be predicted from Doppler boosting, where the approaching (blue shifted) emission would be boosted, and the receding component diminished. Secondly, the relatively low velocity ( km s-1) implied by the peak separation could only arise from a relativistic jet almost in the plane of the sky (i.e. with a very small radial component). In that case, the transverse Doppler shift due to time dilation would dominate, red shifting both components. For a velocity of around 0.3 c this would result in a red shift of both components by m, which is not observed (note this effect is observed in SS 433 - see e.g. Margon 1984). The lack of a discernible transverse red shift (assuming the lines do correspond to the indicated He I transitions) effectively rules out a relativistic outflow.
A lower-velocity non-relativistic jet is possible, although it still suffers from the problem of explaining the persistently stronger red peak, but we consider this unlikely as rapidly variable radio emission is occurring throughout this period (Fig 3). This is almost certainly associated with the production of a relativistic jet; given the existence of this jet and the strong wind the presence of a third outflowing component (which matches the terminal velocity of the wind as inferred from quiescent observations) seems unlikely.
5.2.2 Accretion disc ?
As already noted by van Kerkwijk et al. (1992), a significant contribution to the infrared emission of Cyg X-3 from an accretion disc is unlikely. This is because in order to generate the observed infrared luminosity the disc would need to be very hot ( K), as its size is tightly constrained by the 4.8 hr orbit. Such a high temperature is hard to reconcile with the observed low-excitation He i features. However, the line profiles and velocity separation are reminiscent of features seen in optical spectra of accretion-disc dominated systems, and it is worth checking in more detail.
We can calculate the temperature that a black body (the most efficient emitter) would require in order to reproduce the observed line flux, given that its size is constrained by the dimensions of the orbit. We assume a distance of 8.5 kpc, a binary separation of , a K-band extinction mag, and a flux in emission lines which is about 10% of that in the continuum. For an observed flux density in the K-band of mJy (e.g. Fender et al. 1996) we find that we require a black-body temperature in excess of K in order to produce the flux in the emission lines within the binary separation. As the emission of the plasma producing the lines is much less efficient than that of a black body, there seems to be no way in which the relatively low excitation He i lines can be produced within the scale of the binary separation, as these lines need temperatures K (for reasonable densities). Using this temperature we can find a minimum dimension for the emitting region. As we require an emitting region which is a factor of three larger, i.e. cm. Such a large separation for a 4.8 hr orbit would imply a total mass in the system of 1000 ! So, we can rule out an emitting zone which is contained within the orbit of the system.
Furthermore, the luminosity of the emission lines, both in outburst and quiescence, is orders of magnitude greater than that observed in K-band emission lines from the X-ray binary Sco X-1 (Bandyopadhyay et al. 1997). Given that Sco X-1, with a longer orbital period, probably possesses a larger (and hence brighter in the infrared) accretion disc than Cyg X-3, an origin for the infrared lines of Cyg X-3 in an accretion disc can be ruled out (unless the distance is overestimated by a factor of 10 or more - which seems highly unlikely given the broad agreement between high optical/infrared extinction, high in X-ray spectral fits, and the distance inferred from 21 cm radio observations).
So, in agreement with van Kerkwijk et al. we must conclude that the He i emission lines arise from a region significantly larger than the binary separation of the system. This conclusion also rules out an origin for the emission lines in the X-ray irradiated face of a relatively cool secondary.
5.2.3 An enhanced, possibly disc-like wind ?
Here we discuss a third possible origin for the twin-peaked variable emission lines : a significant enhancement in the wind in Cyg X-3. This has already been suggested as the origin for outbursts from the system (Kitamoto et al. 1994; van Kerkwijk et al. 1996; Fender et al. 1997). Given that we have established that the twin-peaked emission lines almost certainly originate in an extended region which is not the jets, and the existing evidence for a strong wind in the Cyg X-3 system, a natural explanation is that the increased line strength in outburst represents an increase in the density of the WR-like wind in the system. Such an increase in density will be coupled to a decrease in the mean ionisation level of the wind, hence the much increased He i : He ii ratio. While an enhanced wind density of the companion star is a natural explanation for bright X-ray / radio states which reflect increased rates of accretion and jet formation, such enhancements have never been observed in other WN stars. Cyg X-3, however, is an exceptional system. It experiences both extreme tidal forces and irradiation, which likely induce erratic behavior and non-periodic variations in the extended atmosphere of the companion Helium star.
The appearance of the twin-peaked lines, and their variability (probably) in phase with the 4.8 hr orbit suggests an origin in an asymmetric emitting region. We believe that this wind may be flattened and disc-like, probably in the plane of the binary (see e.g. Stee & de Araújo 1994 for predicted line profiles from a disc-wind). A flattened wind may have formed in the Cyg X-3 system as a result of a rapidly (synchronously) rotating mass donor and/or focussing of non-accreted material into the binary plane by the compact object. In this case most of the infrared emission arises from material in the plane of the binary but outside the orbit, and the optical depth along the line of sight from the X-ray source to the observer remains small as long as the system is not viewed edge-on (see Fig 7). In this way, the problem of reconciling the Wolf-Rayet spectral typing of the companion with the detection of X-ray emission from near the centre of the system, highlighted by Mitra (1996, 1998), can be side-stepped whilst also explaining the large infrared luminosity of the system. It is worth recalling however that Berger & van der Klis (1994) show from timing studies that the X-ray emission from Cyg X-3 must still be undergoing significant scattering.
Further support for a disc-wind model may come from the infrared polarimetric observations of Jones et al (1994) who found a significant degree of intrinsic polarisation from Cyg X-3 in the infrared K-band. They suggested that this may indicate a preferential plane of scattering in the binary. Several WR stars also show intrinsic polarisation, interpreted as arising from scattering in a flattened wind (e.g. Schulte-Ladbeck, Meade & Hillier 1992; Schulte-Ladbeck 1995; Harries, Hillier & Howarth 1998). Such intrinsic polarisation seems to be more common from WN type Wolf-Rayets (Schulte-Ladbeck et al. 1992; Harries et al. 1998); and the only direct observation (radio interferometry) of a flattened Wolf-Rayet wind was also from a WN subtype (Williams et al. 1997). Additionally, the position angle of the radio jet in Cyg X-3 (e.g. Mioduszewski et al. 1998) is approximately perpendicular to the long axis of the flattened wind as inferred from the position angle (0 – 40 degrees) of the derived intrinsic infrared polarisation. Assuming the jet propagates along the axis of the accretion disc, which itself lies in the binary plane, this supports a model in which binary and wind planes are aligned.
We discuss the interpretation of the outburst state in the context of a flattened disc-like wind in more detail below.
6 Orbital modulations with a disc-wind
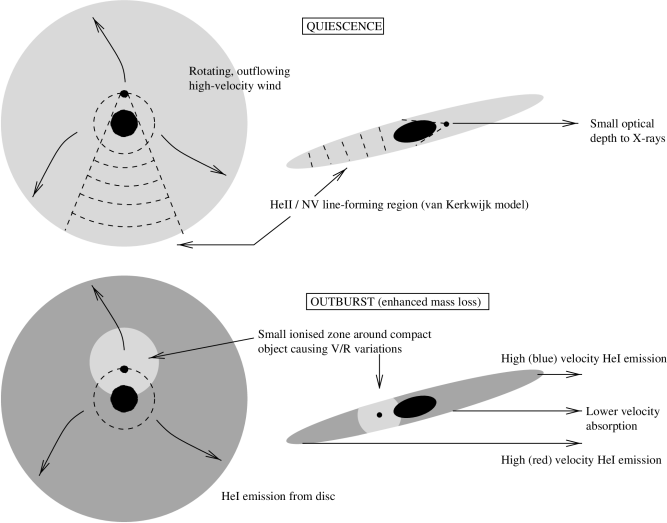
6.1 Quiescence
Our disc-wind model for Cyg X-3 is sketched in Fig 7. In such a model, Doppler-shifting of He ii and N v lines in quiescence would occur essentially as outlined in the model of van Kerkwijk (1993) and van Kerkwijk et al. (1996) (hereafter the ‘van Kerkwijk’ model). We expect most of this emission to arise from outside the binary, with the compact object orbiting within the wind-accelerating zone of the WR-like companion. As discussed in the Introduction and in van Kerwijk et al. (1996) and Mitra (1998) the van Kerkwijk model naturally explains the phasing of the X-ray and infrared continuum modulation with the Doppler shifts, in contrast to the model of Schmutz et al. (1996).
6.2 Outburst
During outburst, we presume that the much-enhanced mass loss and consequent higher wind density prevents the X-ray source from ionising anything but a small fraction of the wind (unlike in the van Kerkwijk model for quiescence in which the majority of the wind is ionised). A quantitative level of enhancement above the quiescent state is difficult to estimate. A realistic model to describe the increased He i emission would require knowledge of the geometry and structure (the clumpiness) of this wind, as well as the fractional increase in mass loss rate. An increase in the soft X-ray flux by a factor of three during outburst indicates a corresponding increase in the mass accretion rate during such periods, although density enhancements close to the compact object may not exactly reflect those in the wind as a whole. It might be possible, given arguments based on the time scale of the line structures seen, to estimate a fractional density of the wind during outburst. Such an in depth analysis is beyond the scope of this study. Possibly the most accurate measure of the degree of wind enhancement may come from measurements of ‘glitches’ in the orbital period derivative as angular momentum is lost from the system at a higher rate during the outbursts.
The rapid, probably cyclic V/R variability observed during outburst could occur as a combination of three components
-
1.
Broad He i emission from the entire disc-wind, from approximately -1500 to +1500 km s-1.
-
2.
An ionised region (Stromgren zone) local to the X-ray source which depletes the He i emission in that region of the orbit.
-
3.
Lower-velocity ( km s-1) blue-shifted (P-Cygni) absorption from the accelerating region of the wind observed against the companion star.
This simple scheme (illustrated in the lower panel of Fig 7) can qualitatively explain the observed phasing of the V/R variability and the greater persistence of the red-shifted peak :
-
•
Phase 0.0 : X-ray source is on far side of wind from the observer. Red-shifted peak is depleted at relatively low velocities due to ionised zone around X-ray source. Similarly blue-shifted peak is depleted at lower-velocities due to persistent P-Cyg absorption.
-
•
Phase 0.5 : X-ray source is on near side of wind. Blue-shifted emission is depleted both by P-Cyg absorption and ionisation from X-ray source; red-shifted peak is unaffected by either and is much stronger.
In the context of this model, the spectrum obtained in 1997 Oct (epoch D, Fig 5) still shows deep P-Cyg absorption but much-reduced emission. This may represent an intermediate state in the return to quiescence in which the the low-velocity absorption is still occuring in the densest parts of the wind, but beyond the binary orbit most of the material is ionised and He ii / N v dominate over He i as in quiescence.
7 Conclusions
We have presented the most comprehensive and highest-resolution set of infrared spectra of Cyg X-3 to date. In combination with X-ray and radio monitoring we can characterize the infrared spectral behaviour of the source in outburst and quiescence.
The underlying infrared spectrum of Cyg X-3, observed during both radio and X-ray outburst and quiescence, displays weak, broad, He ii and N v (but no He i) emission. Some He i 2.058 m absorption may be present, preferentially around orbital phase zero. H-band spectra extend our spectral coverage and confirm the significant He-enrichment of the mass donor, with no evidence of any hydrogen features. While not perfect, the closest match to the spectrum is that of a hydrogen depleted early WN-type Wolf-Rayet star.
In outburst, the K-band spectrum becomes dominated by twin-peaked He i emission, which is shown to be unlikely to arise in relativistic jets or an accretion disc. This emission seems to arise in an enhanced wind density, presumably also responsible for the X-ray and radio outburst via enhanced accretion and related jet formation. This explains the observed long-term (outburst timescale) correlation between emission line strength and X-ray and radio state, as noted in Kitamoto et al. (1994). The emitting region almost certainly extends beyond the binary orbit, and displays significant day-to-day intensity variations, as well as V / R variability with orbital phase. The short term (day-to-day) variability in He i line strength may be anticorrelated with X-ray flux due to a varying degree of ionisation of the wind. It seems that, for Cyg X-3 at least, the major X-ray and radio outbursts are due to mass-transfer, and not disc, instabilities. If this interpretation is correct then the period evolution of Cyg X-3, determined by extreme mass-loss from the system (van Kerkwijk et al. 1992; Kitamoto et al. 1995) will not be smooth, instead displaying periods of accelerated lengthening during outbursts. The detection and measurement of such ‘glitches’ would be important both for understanding the evolution of the Cyg X-3 system and estimating the amount of additional circumstellar material present during outbursts.
The appearance and variability of the emission features in outburst is suggestive of an asymmetric emitting region, and we propose that the wind in Cyg X-3 is significantly flattened, probably in the plane of the binary orbit. This may explain the intrinsic polarisation of the infrared emission from Cyg X-3, which indicates a scattering plane perpendicular to the radio jet axis. The interpretation of a flattened wind is supported by polarimetric and direct radio interferometric observations revealing evidence for flattened winds in other Wolf-Rayet stars. A simple model for the V/R variability in outburst, in the context of a flattened disc-wind, comprising a small ionised zone around the compact object and continuous P-Cygni absorption which erodes the blue-shifted wing, qualitatively explains the observations. Furthermore, a disc-like wind in the Cyg X-3 system also naturally explains why we can have both a large infrared luminosity and yet still observe the X-ray source, a problem highlighted by Mitra (1996, 1998) as being very serious for a spherically symmetric wind. While there is still significant scattering of the X-rays along the line of sight (see Berger & van der Klis 1994) it will be considerably less than in the case of a spherically symmetric wind. Additionally we note that the apparent one-sidedness of the radio jet from Cyg X-3 in the latest VLBA observations (Mioduszewski et al. 1998) may arise not from a jet aligned near to the line of sight (implying a nearly face-on orbit which is seemingly incompatible with the strong orbital modulations observed) but instead from the obscuration of the receding (northerly) jet by the far side of the disc-wind. This would naturally explain why the jet is so apparently one-sided on small scales and yet symmetrical on larger scales.
To conclude, the combination of a WR-like spectrum, high luminosity () and evidence for a disc-like wind supports the interpretation of Cyg X-3 as a high-mass X-ray binary in a very transient phase of its evolution.
Acknowledgements
We wish to thank George and Marcia Rieke for the use of their near-infrared spectrometer and help during the observations. RPF would like to thank Rudy Wijnands for help with the XTE ASM light curves, and Marten van Kerkwijk, Elizabeth Waltman, Michiel van der Klis, Simon Clark, Jan van Paradijs, Lex Kaper and Rens Waters for many useful discussions. The MMT is jointly operated by the Smithsonian Astrophysics Observatory and the University of Arizona. We thank the staff at MRAO for maintenance and operation of the Ryle Telescope, which is supported by the PPARC. RPF was supported during the period of this research initially by ASTRON grant 781-76-017, and subsequently by EC Marie Curie Fellowship ERBFMBICT 972436. MMH has been supported by NASA through Hubble Fellowship grant #HF-1072.01-94A awarded by the Space Telescope Science Institute, which is operated by the Association of Universities for Research in Astronomy, Inc., for NASA under contract NAS 5-26555.
References
- [] Bandyopadhyay R., Shahbaz T., Charles P.A., van Kerkwijk M.H., Naylor T., 1997, MNRAS, 285, 718
- [] Berger M., van der Klis M., 1994, A&A, 292, 175
- [] Blondin J.M. 1994, ApJ, 435, 756
- [] Crowther P., Smith L. 1996, A&A, 305, 541
- [] Fender R.P., Bell Burnell S.J., Garrington S.T., Spencer R.E., Pooley G.G., 1995, MNRAS, 274, 633
- [] Fender R.P., Bell Burnell S.J., Williams P.M., Webster A.S., 1996, MNRAS, 283, 798
- [] Fender R.P., Bell Burnell S.J., Waltman E.B., Pooley G.G., Ghigo F.D., Foster R.S., 1997, MNRAS, 288, 849
- [] Figer D,.F., McClean I.S., Najarro F. 1997 ApJ, 486, 420
- [] Geldzahler B.J. et al., 1983, ApJ, 273, L65
- [] Hanson, M.M., Conti, P.S., Rieke, M.J. 1996, ApJS, 107, 281
- [] Hanson, M.M., Howarth, I.D., Conti, P.S. 1997, ApJ, 489, 698
- [] Harries T.J., Hiller D.J., Howarth I.D., 1998, MNRAS, 296, 1072
- [] Hatchett S., McCray R. 1977, ApJ, 211, 552
- [] Ignace R., Cassinelli J.P., Bjorkman J.E., 1996, ApJ, 459, 671
- [] Jones T.J.,Gehrz R.D., Kobulnicky H.A., Molnar L.A., Howard E.M., 1994, AJ, 108, 605
- [] Kawashima K., Kitamoto S., 1996, PASJ, 48, L113
- [] Kitamoto S., Miyamoto S., Waltman E.B., Fiedler R.L., Johnston K., Ghigo F.D., 1994, A&A, 281, L85
- [] Kitamoto S. et al., 1995, PASJ, 47, 233
- [] Levine A.M., Bradt H., Cui W., Jernigan J.G., Morgan E.H., Remillard R.A., Shirey R., Smith D., 1996, ApJ, 469, L33
- [] Liedahl D.A., Paerels F., 1996, ApJ, 468, L33
- [] Margon B. 1984, ARA&A, 22, 507
- [] Mason K.O., Cordova F.A., White N.E., 1986, ApJ, 309, 700
- [] Matz S.M., Fender R.P., Bell Burnell S.J., Grove J.E., Strickman M.S., 1996, A&AS, 120C, 235
- [] McCray R., Hatchett S. 1975, ApJ, 199, 196
- [] Mioduszewski A.J., Hjellming R.M., Rupen M., Waltman E.B., Pooley G.G., Ghigo F.D., Fender R.P., 1998, In ‘Radio emission from Galactic and Extragalactic Compact Sources’, ASP conf. ser. 144, Eds. Zensus J.A., Taylor G.B., Wrobel J.M., p.351
- [] Mitra A., 1998, ApJ, 499, 385
- [] Mitra A., 1996, MNRAS, 280, 953
- [] Morris P.W., Eenens P.R.J., Hanson M.M., Conti P.S., Blum R.D., 1996, ApJ, 470, 597
- [] Najarro F., Hillier D.J., Kudritzki R.-P., Krabbe A., Genzel R., Lutz D., Drapatz S., Geballe T.R. 199, A&A, 285, 573
- [] Protheroe R.J., 1994, ApJS, 90, 883
- [] Schmutz W., 1993, in Regev O., Shaviv G., eds, Ann. Israel Phys. Soc. 10, Cataclysmic variables and Related Physics. IOP Publishing, Bristol, p.259
- [] Schmutz W., Geballe T.R., Schild H., 1996, A&A, 311, L25
- [] Schulte-Ladbeck R., 1995, In van der Hucht K.A., Williams P.M., eds, Wolf-Rayet stars : binaries, colliding winds, evolution, IAU Symp. 163, Kluwer, p. 176
- [] Schulte-Ladbeck R., Meade M.R., Hiller D.J., In Drissen L., Leitherer C., Nota A., eds, Nonisotropic and variable outflows from stars, ASP conf. ser. vol. 22, p. 118
- [] Stee Ph., de Araújo F.X., 1994, A&A, 292, 221
- [] Stevens, I.R. 1991, ApJ, 379, 310
- [] Tamblyn P., Rieke G., Hanson M.M., Close L.M., McCarthy D.W., Rieke M.J. 1996, ApJ,456, 206
- [] van den Heuvel E.P.J., de Loore C., 1973, A&A, 25, 387
- [] van der Klis M., 1993, Space Sci. Rev., 62, 173
- [] van Kerkwijk M.H., 1993, A&A, 276, L9
- [] van Kerkwijk M.H. et al., 1992, Nature, 355, 703
- [] van Kerkwijk M.H., Geballe T.R., King D.L., van der Klis M., van Paradijs J., A&A, 314, 521, 1996
- [] Waltman E.B., Fiedler R.L., Johnston K.J., Ghigo F.D., 1994, AJ, 108, 179
- [] Waltman E.B., Ghigo F.D., Johnston K.J., Foster R.S., Fiedler R.L., Spencer J.H., 1995, AJ, 110, 290
- [] Waltman E.B., Foster R.S., Pooley G.G., Ghigo F.D., 1997, Vistas Astron., 41, 43
- [] Watanabe H., Kitamoto S., Miyamoto S., Fiedler R.L., Waltman E.B., Johnston K.J., Ghigo F., 1994, ApJ, 433, 350
- [] Watson, A. Hanson, M.M. 1997, ApJL, 490, 165
- [] Williams D., Thompson C.L., Rieke G.H., Montgomery E. 1993, Proc. SPIE 1308, 482
- [] Williams P.M., Dougherty S.M., Davis R.J., van der Hucht K.A., Bode M.F., Setia Gunawan D.Y.A., MNRAS, 1987, 289, 10
Appendix A Observing logs
Tables A1-4 below list the epochs and exposure times of every K- and H-band spectum taken during all four observing runs. The reduced spectra are downloadable from
ftp://cdsarc.u-strasbg.fr/pub/cats/J/MNRAS/vol/page
HJD, as used below, is heliocentric-corrected Julian Date, with 2450000.0 subtracted. The ‘Exposures’ column shows three numbers, indicating the number of spectra averaged, the number of exposures and the length of each exposure (in seconds). Orbital phase at the start of each observation is indicated by .
We request that any use of these spectra in future publications makes reference to this work.
| UT | HJD | Exposures | |
|---|---|---|---|
| 29/05/1996 10:58:22 | 232.9577 | 4x30x4s | 0.020 |
| 29/05/1996 11:08:32 | 232.9648 | 4x30x4s | 0.056 |
| 29/05/1996 11:18:05 | 232.9714 | 4x30x4s | 0.089 |
| 29/05/1996 11:37:20 | 232.9848 | 4x30x4s | 0.156 |
| 30/05/1996 11:13:02 | 233.9680 | 4x30x4s | 0.079 |
| 30/05/1996 11:22:24 | 233.9745 | 4x30x4s | 0.112 |
| 30/05/1996 11:32:06 | 233.9812 | 4x30x4s | 0.146 |
| 31/05/1996 11:11:55 | 234.9673 | 4x30x4s | 0.083 |
| 31/05/1996 11:22:01 | 234.9743 | 4x30x4s | 0.119 |
| 31/05/1996 11:31:48 | 234.9811 | 4x30x4s | 0.153 |
| 01/06/1996 11:13:12 | 235.9682 | 4x30x4s | 0.096 |
| 01/06/1996 11:24:06 | 235.9758 | 4x30x4s | 0.134 |
| 01/06/1996 11:34:17 | 235.9828 | 4x30x4s | 0.169 |
| 02/06/1996 06:49:07 | 236.7849 | 4x30x4s | 0.185 |
| 02/06/1996 06:59:10 | 236.7918 | 4x30x4s | 0.220 |
| 02/06/1996 07:11:39 | 236.8005 | 4x30x4s | 0.264 |
| 02/06/1996 07:21:32 | 236.8074 | 4x30x4s | 0.298 |
| 02/06/1996 07:36:23 | 236.8177 | 4x30x4s | 0.350 |
| 02/06/1996 07:46:54 | 236.8250 | 4x30x4s | 0.386 |
| 02/06/1996 07:57:09 | 236.8321 | 4x30x4s | 0.422 |
| 02/06/1996 08:12:41 | 236.8429 | 4x30x4s | 0.476 |
| 02/06/1996 08:25:56 | 236.8521 | 4x30x4s | 0.522 |
| 02/06/1996 08:36:32 | 236.8595 | 4x30x4s | 0.559 |
| 02/06/1996 08:49:25 | 236.8684 | 4x30x4s | 0.604 |
| 02/06/1996 09:00:13 | 236.8759 | 4x30x4s | 0.641 |
| 02/06/1996 09:10:51 | 236.8833 | 4x30x4s | 0.678 |
| 02/06/1996 09:24:01 | 236.8924 | 4x30x4s | 0.724 |
| 02/06/1996 09:34:00 | 236.8994 | 4x30x4s | 0.759 |
| 02/06/1996 09:43:42 | 236.9061 | 4x30x4s | 0.793 |
| 02/06/1996 09:58:03 | 236.9161 | 4x30x4s | 0.843 |
| 02/06/1996 10:07:52 | 236.9229 | 4x30x4s | 0.877 |
| 02/06/1996 10:17:43 | 236.9297 | 4x30x4s | 0.911 |
| 02/06/1996 10:30:13 | 236.9384 | 4x30x4s | 0.954 |
| 02/06/1996 10:42:52 | 236.9472 | 4x30x4s | 0.998 |
| 02/06/1996 10:52:45 | 236.9541 | 4x30x4s | 0.033 |
| 02/06/1996 11:02:52 | 236.9611 | 4x30x4s | 0.068 |
| 02/06/1996 11:12:45 | 236.9679 | 4x30x4s | 0.102 |
| 02/06/1996 11:25:19 | 236.9767 | 4x30x4s | 0.146 |
| 02/06/1996 11:35:18 | 236.9836 | 4x30x4s | 0.181 |
| 03/06/1996 11:14:23 | 237.9691 | 4x30x4s | 0.116 |
| 03/06/1996 11:24:11 | 237.9759 | 4x30x4s | 0.150 |
| 04/06/1996 11:12:23 | 238.9678 | 4x30x4s | 0.117 |
| 04/06/1996 11:22:10 | 238.9746 | 4x30x4s | 0.151 |
| 04/06/1996 11:30:53 | 238.9806 | 4x30x4s | 0.181 |
| 05/06/1996 11:04:59 | 239.9627 | 4x30x4s | 0.099 |
| 05/06/1996 11:15:36 | 239.9701 | 4x30x4s | 0.136 |
| 05/06/1996 11:25:31 | 239.9770 | 4x30x4s | 0.171 |
| 06/06/1996 11:08:58 | 240.9656 | 4x30x4s | 0.121 |
| 06/06/1996 11:19:14 | 240.9727 | 4x30x4s | 0.157 |
| 06/06/1996 11:29:13 | 240.9796 | 4x30x4s | 0.192 |
| 07/06/1996 11:15:21 | 241.9700 | 4x30x4s | 0.151 |
| 07/06/1996 11:25:29 | 241.9770 | 4x30x4s | 0.187 |
| 07/06/1996 11:35:14 | 241.9838 | 4x30x4s | 0.220 |
| 08/06/1996 07:41:51 | 242.8218 | 4x30x4s | 0.417 |
| 08/06/1996 08:05:59 | 242.8385 | 4x30x4s | 0.501 |
| 08/06/1996 08:17:41 | 242.8467 | 4x30x4s | 0.542 |
| UT | HJD | Exposures | |
|---|---|---|---|
| 22/09/1996 03:33:03 | 348.6507 | 4x30x4s | 0.382 |
| 22/09/1996 03:56:45 | 348.6671 | 4x30x4s | 0.465 |
| 22/09/1996 04:08:34 | 348.6753 | 4x30x4s | 0.506 |
| 22/09/1996 04:21:14 | 348.6841 | 4x30x4s | 0.550 |
| 22/09/1996 04:31:15 | 348.6911 | 4x30x4s | 0.584 |
| 22/09/1996 04:57:08 | 348.7091 | 4x30x4s | 0.675 |
| 22/09/1996 05:09:41 | 348.7178 | 4x30x4s | 0.718 |
| 22/09/1996 05:19:37 | 348.7247 | 4x30x4s | 0.753 |
| 22/09/1996 05:34:25 | 348.7349 | 4x30x4s | 0.804 |
| 22/09/1996 05:49:31 | 348.7454 | 4x30x4s | 0.857 |
| 22/09/1996 06:01:29 | 348.7537 | 4x30x4s | 0.898 |
| 22/09/1996 06:14:07 | 348.7625 | 4x30x4s | 0.942 |
| 22/09/1996 06:25:43 | 348.7706 | 4x30x4s | 0.983 |
| 22/09/1996 06:51:08 | 348.7882 | 4x30x4s | 0.071 |
| 22/09/1996 07:02:23 | 348.7960 | 4x30x4s | 0.110 |
| 22/09/1996 07:13:23 | 348.8037 | 4x30x4s | 0.148 |
| 22/09/1996 07:25:37 | 348.8122 | 4x30x4s | 0.191 |
| 22/09/1996 07:42:42 | 348.8240 | 4x30x4s | 0.250 |
| 22/09/1996 07:54:30 | 348.8322 | 4x30x4s | 0.291 |
| 22/09/1996 08:06:39 | 348.8407 | 4x30x4s | 0.334 |
| 22/09/1996 08:17:46 | 348.8484 | 4x30x4s | 0.372 |
| 22/09/1996 08:34:04 | 348.8597 | 4x30x4s | 0.429 |
| 23/09/1996 03:56:40 | 349.6670 | 4x60x4s | 0.472 |
| 23/09/1996 04:16:31 | 349.6808 | 4x60x4s | 0.541 |
| 23/09/1996 04:35:22 | 349.6939 | 4x60x4s | 0.606 |
| 23/09/1996 04:53:58 | 349.7068 | 4x60x4s | 0.671 |
| UT | HJD | Exposures | |
|---|---|---|---|
| 16/06/1997 10:32:35 | 615.9407 | 4x60x4s | 0.905 |
| 16/06/1997 10:52:02 | 615.9542 | 4x60x4s | 0.972 |
| 17/06/1997 10:28:45 | 616.9381 | 4x60x4s | 0.899 |
| 17/06/1997 10:47:10 | 616.9509 | 4x60x4s | 0.963 |
| 17/06/1997 11:10:13 | 616.9669 | 4x60x4s | 0.043 |
| 18/06/1997 10:55:50 | 617.9570 | 4x60x4s | 0.001 |
| 18/06/1997 11:16:54 | 617.9716 | 4x60x4s | 0.075 |
| 18/06/1997 11:39:43 | 617.9875 | 4x60x4s | 0.154 |
| 19/06/1997 07:04:32 | 618.7964 | 4x60x4s | 0.205 |
| 19/06/1997 07:24:39 | 618.8104 | 4x60x4s | 0.275 |
| 19/06/1997 07:45:14 | 618.8247 | 4x60x4s | 0.347 |
| 19/06/1997 08:06:20 | 618.8393 | 4x60x4s | 0.420 |
| 19/06/1997 08:27:34 | 618.8541 | 4x60x4s | 0.494 |
| 19/06/1997 08:48:52 | 618.8688 | 4x60x4s | 0.568 |
| 19/06/1997 09:14:21 | 618.8865 | 4x60x4s | 0.656 |
| 19/06/1997 09:34:34 | 618.9006 | 4x60x4s | 0.727 |
| 19/06/1997 09:57:16 | 618.9163 | 4x60x4s | 0.806 |
| 19/06/1997 10:21:01 | 618.9328 | 4x60x4s | 0.888 |
| 19/06/1997 10:40:03 | 618.9461 | 4x60x4s | 0.955 |
| 19/06/1997 11:04:47 | 618.9632 | 4x60x4s | 0.041 |
| 19/06/1997 11:24:35 | 618.9770 | 4x60x4s | 0.109 |
| 20/06/1997 08:27:27 | 619.8540 | 4x60x4s | 0.501 |
| 20/06/1997 08:45:51 | 619.8668 | 4x60x4s | 0.565 |
| 20/06/1997 10:53:09 | 619.9552 | 4x60x4s | 0.008 |
| 20/06/1997 11:12:39 | 619.9687 | 4x60x4s | 0.076 |
| UT | HJD | Exposures | |
|---|---|---|---|
| 15/10/1997 04:25:20 | 736.6861 | 4x60x4s | 0.567 |
| 15/10/1997 04:54:05 | 736.7061 | 4x60x4s | 0.667 |
| 15/10/1997 05:14:48 | 736.7205 | 4x60x4s | 0.739 |
| 15/10/1997 05:36:05 | 736.7353 | 4x60x4s | 0.813 |