Maximal halos in high-luminosity spiral galaxies
Abstract
We test the halo dominated mass model, recently proposed for high-luminosity galaxies by Courteau and Rix (1998), against rotation velocity data for a large sample of spirals. We find that this model does not reproduce the general kinematic properties required. The alternative disc dominated model, on the contrary, easily fits the data.
Key Words.:
Galaxies: kinematics and dynamics – Galaxies: spiral – Galaxies: structure1 Introduction
In a recent paper, Courteau & Rix (1998; hereafter CR98) have used the residuals of the well known relationships of spiral galaxies, luminosity vs. velocity and luminosity vs. radius, to estimate the disc-to-halo mass ratio at 111The radius where the rotation curve of a thin exponential disc of lenghtscale peaks (Freeman 1970).. Hereafter, and . The argument of CR98 relies on the idea that, for a given mass, more compact self-gravitating stellar discs have higher rotation speeds than less compact ones (according to a scaling). This effect should be observed in the rotation curves, if the disc component is dynamically important, and should disappear if the halo is dominant. More specifically, the effect can be measured by correlating the deviation that an object has with respect to the mean velocity–luminosity relation, with the deviation that the object has with respect to the mean radius–luminosity relation. For disc dominated systems, one should expect , while for halo dominated ones it is likely that . In large samples of spirals, CR98 find an ensemble value of , which is interpreted as evidence that, on average, the disc contribution to is far from maximal (see below). The actual value of is estimated by computing the final halo mass distribution by adiabatically contracting (Blumenthal et al. 1986) a proto-disc inside an initial standard CDM halo (e.g., Navarro et al. 1996) into a final configuration with kpc. So, CR98 find for galaxies with 222log; see Rhee (1996) for the -magnitudes of the CR98 sample. We adopt H km s-1 Mpc-1. No result of this paper depends on this value. (virtually independent of the initial DM distribution or the exact disc scale length or the presence of a [realistic] stellar bulge).
Before discussing this result, let us comment on the procedure adopted by CR98. Three crucial assumptions have been made: 1) the residuals of both relationships are essentially due to differences in the mass structure between each individual galaxy and the ”average” galaxy; 2) the residuals are not affected by discrepancies between redshift distancies and true distances, observational errors and selection bias; 3) the two relationships are intrinsically log-linear and/or do not have hidden parameters. The validity of these assumptions is far from certain. Moreover, the method, devised to determine the average value of in a sample of galaxies, is poorly suited to detect systematic and/or random variations of within the sample itself. While these issues do not affect the main thrust of the CR98 idea, it is likely that they strongly modify the interpretation.
Independently of the above issues (to be considered in a separate paper), the CR98 claim of in high- spirals is quite surprising. (Much less so if referred to low- spirals, e.g. Persic & Salucci 1990.) Direct modelling of rotation curves (RCs) of high- galaxies, based on the maximum disc hypothesis (van Albada & Sancisi 1986; Sancisi & van Albada 1987), is able to successfully fit the RCs out to with (see: Kalnajs 1983; van Albada et al. 1985; Kent 1986; Begeman 1987; Broeils 1992; Broeils & Courteau 1997). Best-fitting multicomponent mass modelling, applied to extended high resolution RCs, has also found disc-dominated solutions for high- galaxies (e.g.: Broeils 1992; see references in section 4.) The RC profile methods, that are powerful diagnostics in quantifying the disc-to-total mass discrepancy, consistently find that galaxies as disc dominated, i.e. (Persic & Salucci 1988, 1990; Salucci & Frenk 1989; Casertano & van Gorkom 1991; Salucci & Persic 1997). Finally, the swing amplifier constraints, coupled with stellar population arguments, seem to favour (near-)maximum discs (see Athanassoula et al. 1987 and Bosma 1998).
Despite this, CR98 are not alone in their claim of halo-dominated (HD) high- spirals. Mass models, built from the properties of the stellar velocity dispersion, find low values of (Bottema 1997); the swing amplifier constraints may also imply subdominant discs (Fuchs et al. 1998). Moreover, the local Galactic disc column density of pc-2, estimated by studying the z-motions of local stars as a function of their height above the Galactic plane, is interpreted as evidence of a dominant halo (e.g., Kuijken & Gilmore 1991 and Kuijken 1995; but see Sackett 1997 and Dehnen & Binney 1997).
On the cosmological side, the universal CDM density profile (Navarro et al. 1996, 1997) features only a small central region where the halo rotation curve increases with radius, while it has for that, combined with observed in galaxies, implies a dominant halo.
The case of HD mass models for high- spirals is in (indirect) disagreement with our previous work (Persic & Salucci 1990; Persic, Salucci & Stel, 1996 [PSS]). However, in view of the strong CR98 claim, it is worthwhile to investigate the issue further by means of specific tests.
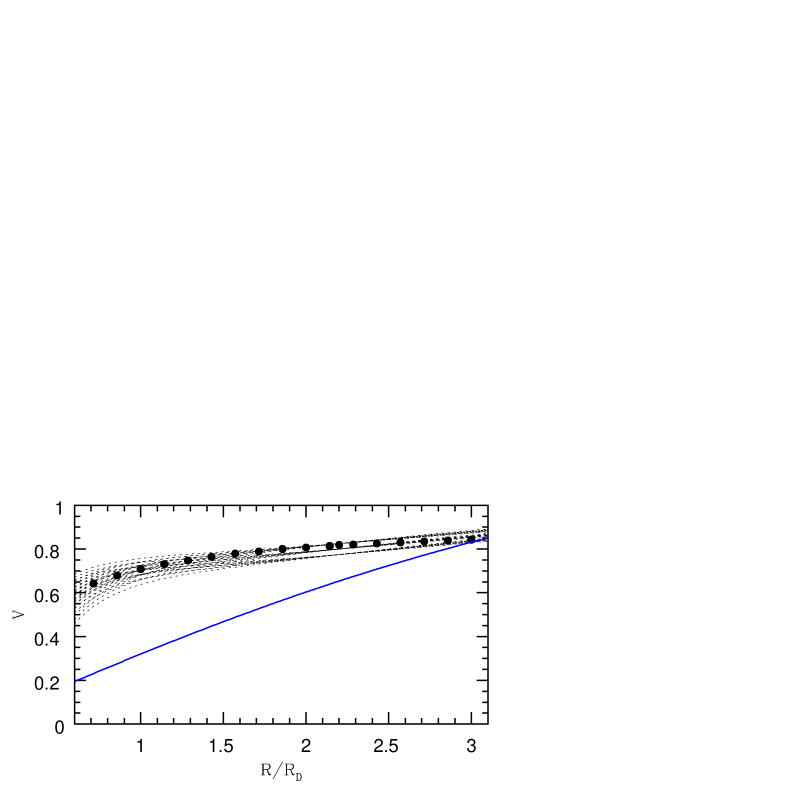
Notice that, for high- galaxies, whose RCs are well described by , with , , , , the CR98 mass model represents the whole class of HD models. In fact, a property of the above rotation curve is that any HD model (i.e., with ) will have a halo velocity profile, , very similar to the one adopted by CR98, independent of and independent also of the precise values of (see Fig. 1) in high- objects. Then, a test performed on the CR98 model applies also to any HD mass model of high-luminosity spirals.
In detail, in this paper we will devise two tests that, in the spirit of Salucci & Frenk (1989), single out two clear kinematical properties of RCs, and we will then check whether these are compatible with the CR98 model; failing that, we will iterate the tests on a disc dominated (DD) model.
The plan is the following: in section 2 we determine the synthetic RC of high- spirals; in sections 3 and 4 we perform two tests concerning the inner and outer rotation curves; in section 5 we discuss the results obtained and their implications.
2 Rotation Curves of High-L Spirals
In this section we coadd individual spiral RCs into a synthetic curve. This procedure, pioneered by Rubin et al. (1985) separately for Sa, Sb and Sc galaxies, was extensively used by PSS. In particular, for a sample of 1000 optical RCs of mostly late spirals, PSS have shown that: (1) within each given luminosity interval, the scatter of RCs around their mean is comparable with the scatter of data points around a given individual curve (i.e., the cosmic scatter is comparable with the error); and (2) the sequence of galaxy luminosities determines a sequence of RC shapes. [A Principal Component analysis of the same sample (Rhee 1996; see also Roscoe 1998) confirms the above results.] Moreover, at a given luminosity, there is practically no difference between the individual profiles of (high quality) RCs and the corresponding coadded profile (PSS). This evidence indicates that, as far as the gross features of their mass structure are concerned, spirals within a suitably small interval of luminosity can be considered as essentially alike: the coaddition procedure, therefore, eliminates most of the observational errors, extracting the relevant information stored in individual curves.
CR98 use two samples of galaxies. One comprises over a hundred Sb/Sc galaxies from Courteau (1992); the other comprises several hundred late spirals from the Mathewson et al. (1992; hereafter MFB) sample with . We then select from Persic & Salucci (1995; hereafter PS95) the RCs of MFB objects in the same luminosity range as CR98. From this subsample we will generate a synthetic curve by coadding the individual curves. The procedure used is the following: we select galaxies with and (the RC of objects of higher inclination are excluded because, due to obscuration effects, the H position–velocity curves may not correspond to true rotation velocities: see Bosma et al. 1992 and Bosma 1995). We then find 554 objects, with: , kpc. 333 The average surface luminosity profile of the objects in the sample is well represented by a thin exponential disc (PSS).
Following PSS we coadd the (normalized) velocity data and obtain a raw synthetic RC with about 12000 measurements, ).444 In the following: . We then form the smoothed synthetic RC of galaxies, , by averaging the velocity data over 24 radial bins of size out to (see Fig.2). is the average RC of (essentially) the same sample whose residuals have been studied by CR98.
3 Test I. Mass Modelling of Inner Rotation Curves

In this section we check whether the innermost (i.e., for ) RCs of spiral galaxies are halo dominated. The test is straigthforward because for the velocity profile of a Freeman (1970) disc is completely different from that of a post-infall CDM halo.
We first fit with the HD mass model which has allowed CR98 to model the residuals and (see Fig.7 of CR98) for the same sample that we have used to construct . In detail, the model includes: (i) an exponential disc with kpc; (ii) a stellar bulge with velocity profile peaking at ; (iii) a post-infall CDM dark halo (see Navarro 1998). For this mass distribution has an initial profile and then a rapid convergence to a very shallow slope: setting , then: and for .
The CR98 model is plotted in Fig.2a alongside its individual components. It has one distinctive feature: about of the maximum velocity is reached at . By comparison, the exponential thin disc reaches the same fraction of the maximum velocity at a much larger radius, . Notice that the step-like shape of the halo dominated RC is not due the bulge, which reaches its maximum velocity at the much smaller radius , but just reflects the shape of that, for , is steeper than . As a result, we realize that the model is inconsistent with the data, by predicting, for , a curvature in very different from the observed one.
This failure does not occur only when testing the coadded RC, but also when we check individual RCs of high luminosity spirals that result severely inconsistent with the curve generated by the gravitational field of a dominant -halo [see the cases of NGC 2179 and NGC 2775 (Corsini et al. 1998), of NGC 5055 (Thornley & Mundy 1997) and of NGC 5033 (Thean et al. 1997), and a few more cases in Begeman (1987) and Rhee (1996)].
Next, we fit with a DD model. This should not be considered as a further test, but rather as the necessary check that the coadded RC can be reproduced by a ’natural’ mass distribution, i.e. the one which follows the distribution of light. Applying DD models to samples with large luminosity ranges (as in the case of CR98) requires, however, the luminosity bins to be smaller. Then, in this case we analyse the RCs of MFB objects (see PS95) having . (The reader is referred to PSS for the analogous results concerning lower- galaxies.) The present subsample comprises 267 objects with global properties: , , km s-1 and kpc.
The DD mass model we use includes: (i) a thin exponential disc with kpc; (ii) a bulge, with a Hernquist velocity profile (practically indistinguishable from that used by CR98):
| (1) |
where kpc is the radius where the bulge velocity peaks; (iii) a dark halo with velocity profile:
| (2) |
where km s-1, is the ”velocity core radius” (in units of ), and is essentially the stellar mass fraction at (the bulge contributes only 6% of the mass at this radius). Our adopted DD model, therefore, is not a best-fit model, but is chosen such as to only differ from the previously used HD model by (mainly) the disc dominance: the bulge is kept virtually frozen (in normalized units), and the halo velocity profile is a simple fit to the velocity residuals. The DD model easily reproduces the data for within their rms errors (see Fig.2b): at very small radii the detailed modelling of the bulge is crucial but is beyond our scope here.
Then we can conclude that, inside , the synthetic RC of high- objects does not trace the dark halo mass distribution: in fact, it does precisely trace the mass distribution of the stellar disc.
4 Test II. The Inner vs. Outer RC Slope
A second test to check the ability of mass models to fit the RCs relies on the analysis of the outer RC profiles. The shapes of RCs can be essentially described by two quantities: the inner slope and the outer slope (see PSS). Used in combination, and can help discriminating among apparently similar mass models.
Let us consider, for example, two radically different models that lead to curves approximately flat at : the ”light disc + halo” model, and the ”dominant disc + constant-density halo” model. 555The ”light disc + constant-density halo” and ”dominant disc + halo” models lead to curves that are respectively increasing and decreasing at . In the former case, and are both small in absolute value () but are opposite in sign, thus
implies also ; moreover, since the disc contribution for is negligible, then (specifically, the CR98 model has: , ). In the second case, and are both a factor 3-4 larger than in the previous case: they approximately compensate each other in the range , but further out the disc term takes over because increases with radius while decreases: then the dominant disc model has and , with .
We now check these predictions versus the observations. From the literature we select, following PSS, 19 individual RCs of high- galaxies with a reliable profile out to . These 19 curves are representative of the sample of 554 used for test I. (See Figs.2 and 3 of PSS: the shape parameters for the sample of individual RCs out of which these 19 are extracted, are consistent with the shape parameters of the coadded RCs built from essentially the same sample used in test I.) Using these curves, in Fig.3 we see that very few objects have a pair consistent with HD models (shaded area) and none lies in the region predicted by the CR98 mass model; moreover, of objects lay well inside the disc dominated region of the - plane.
Finally, the constraint , predicted by the disc dominated model, is fully satisfied: the observed values are and . Again, these values are inconsistent with the prediction of HD models: , with .

5 Discussion and conclusion
Could high- spirals be completely halo dominated? This can be effectively checked out by looking at their RCs: in fact, if the disc contribution to the RC is very small at all radii, the RC profile will essentially reflect that of the dark halo; otherwise, the stellar disc component will leave a recognizable imprint on the shape of the RC.
By analysing the data for 554 inner RCs and 19 outer RCs of spirals, we have uncovered two clear dynamical imprints of a dominant disc. The first consists in a shallow extended rise in the RC between and , that results coincident with that predicted by the Freeman (1970) disc; the second consists in a net decrease, km s-1 (i.e. ), of the circular velocity between one and two optical radii, again as predicted by a dominant disc. These features, predicted well before statistically relevant data were available (Salucci & Frenk 1989), are inconsistent with the predictions of HD models (including the CR98 one). It is then obvious that mass models, featuring light discs and essentially constant velocity halos, give a poor fit to the data, while models featuring massive discs and DM halos with solid-body-like profiles out to match the data.
On the basis of the results of two tests, one performed on the synthetic RC of high- galaxies (seconded by literature results on several individual RCs) and the other performed on about twenty individual RCs, we then reject the CR98 claim for halo dominated high- galaxies. 666One further, non-dynamical argument. The CR98 model has [with the mass in stars (disc plus bulge)]: this, however, seems rather low for objects having (e.g.: Tinsley 1981; Jablonka & Arimoto 1992) like high- spirals.
We conclude by emphasizing the existence of a characteristic length-scale such that, for radii the baryonic matter (with total mass ) accounts for most (e.g., ) of the gravitating mass inside , and for the dark component (whose contribution is minor at inner radii) rapidly becomes a major mass component. From PSS we can estimate: , with . For high- spirals, such ”inner baryon dominance” extends to most of the disc region.