STELLAR POPULATIONS AT LARGE REDSHIFTS111To be published in the 1999 revised edition of Stellar Populations (IAU Symposium No. 164), eds. P. van der Kruit and G. Gilmore (Dordrecht: Kluwer).
Abstract
Rapid progress is now being made in the study of stellar populations of galaxies at large lookback times, both in dense clusters and the field. Dramatic transformations in star formation histories (even morphologies) appear to prevail among all types of galaxies and in all environments, and these can be traced to relatively recent times (). This article updates to December 1998 a review made in 1994 to cover the recent watershed of observational results emerging from the Hubble Deep Field and deep surveys made with large ground-based telscopes.
1 Introduction
With one exception, evidence for evolution in nature is indirect and circumstantial in that it is not based on contemporaneous observations. The exception, remarkably enough, is evidence for evolution of the universe itself. Courtesy of the vast scale of the universe compared to the finite speed of light, astronomers are able to see directly what was happening billions of years ago. However, the distant universe is faint enough that we have only recently been able to exploit this opportunity. In fact, at the time of the Vatican Conference in 1957, as Adriaan Blaauw noted in his historical review, “Nothing was said about galaxy evolution because nothing sensible could be said.” Today, one can sensibly conclude that galaxy evolution has been detected, which is a result of enormous importance, but the number of other sensible remarks which can be made is perhaps limited.
“Galaxy evolution” is not a very well defined term. Workers generally do not use it to mean the evolution of individual galaxies, which has been recognized an inevitable since the beginning of galaxy research (Hubble 1936). Instead, they mean a systematic change with cosmic time in the statistical distribution of galaxies over their global characteristics. In principle, evolution can be demonstrated by a change in any one property of the galaxy sample. However, much more information is required to interpret the character of that evolution, particularly if it involves stellar populations.
This statistical definition requires that we compare local (, say) samples of galaxies to distant samples, both chosen to reflect representative conditions. If we are not careful in matching the two samples, we can readily misinterpret the evidence for evolution. Further, the physical nature of evolution can only be understood by comparing the two epochs in detail. Thus, a comprehensive assessment of our local environment is a key ingredient in evaluating the evolution of distant galaxies. This assessment is currently rather limited, and I will comment briefly on that below.
Rapidly improved technology has allowed the study of galaxies at large lookback times to blossom. Nonetheless, the distance moduli involved ( at ) challenge even the best instrumentation. Consequently the dimensionality of stellar population analysis of distant objects has been limited mainly to the star formation history (SFH), with a few recent studies adding morphological information. Knowledge of abundances (other than interstellar gas), kinematics, or IMF’s is rudimentary.
The seminal result in the field was the discovery by Butcher & Oemler (1978) that galaxy clusters at modest redshifts of contained more blue objects than local clusters. Doubts about field contamination and interpretation of the colors were resolved by spectroscopy (e.g. Dressler & Gunn 1982) and larger samples, and the “Butcher-Oemler Effect” is now regarded as unambiguous evidence for the evolution of galaxies in rich cluster environments over the past Gyr. Simultaneously, studies of field galaxies (e.g. Tyson & Jarvis 1979) revealed a rapid increase in number to and a shift to bluer colors, which most workers regard as good evidence for evolution in the field.
In this review, I will concentrate on observations of rich clusters, which provide the best fiducial environment available. There are many interesting aspects of high redshift populations to which I cannot do justice, including very distant radio galaxies, gravitational lensing, and the magnitude-redshift relation.
2 Evolution of Disk Galaxies
2.1 Populations In Local Disk Samples
Disk galaxies (i.e. Hubble types later than S0) constitute 60–70% of field and group samples; only in clusters does their proportion drop below 50% (Oemler 1992). However, despite their abundance (and the fact that we live in one), we have a relatively poor understanding of their evolution, at least on the global scale relevant for comparison with distant galaxies. There are both fundamental and technical reasons for this. First, these are multicomponent systems, and their integrated properties are influenced by two very different populations: the disk and the bulge. Even within disks, there can be strong gradients in SFH and metallicities.
On the technical side, we have probably been misled by the ease with which we can deduce the current massive star formation rate (e.g. from emission lines). This applies only to ionizing populations, which have ages Myr, or 0.05% of a galaxy’s lifetime. The other 99.95% is a tougher proposition, and the most readily available input data—broad-band colors—are inadequate to the task. Broad-band colors can constrain the gross SFH (e.g. Gallagher et al. 1984), but it is now obvious that they contain far too little information to be useful in resolving the details of interest (e.g. smooth star formation vs. bursts vs. quenching) in the context of the early universe. Although the colors of most disks are consistent with smooth, exponentially declining SFH’s in very old systems (e.g. Larson & Tinsley 1978), they are also consistent with a variety of radically different histories (Tinsley 1980, Schweizer & Seitzer 1992, Fritze-v. Alvensleben & Gerhard 1993).
Since broad-band measures seriously under-constrain stellar populations, analyses using them must provide for automatic exploration of the full alternative solution space. One method was described by Wu et al. (1980), but such algorithms have been little used. A good example of the controversies which can arise in their absence is the debate over the age of distant radio galaxies such as 090232 (Lilly 1988, Chambers & Charlot 1990).
There are few published studies on the general ability of integrated light measures to infer the SFH of multi-component populations. One useful benchmark is the work of Pickles & van der Kruit (1990), who found that S/N in 13.5 Å bins between 3600 and 10000 Å was needed to distinguish three population components, each specified by their age and metallicity. That is, a problem involving 6 unknowns required over 70 times as many data points. When strong redundancies are eliminated, the data requirements can probably be significantly reduced. However, the fact that stellar energy distributions are not mathematically independent (cf. Silva 1991), which is the root cause of the problem here, implies that high precision, multi-band spectrometry is essential for analysis of composite populations. Only recently has such data become available with large apertures on a large sample of disk galaxies (Kennicutt 1992), and their implications for the SFH have yet to be systematically explored.
2.2 Distant Field & Cluster Disk Systems
The smooth, exponential SFH’s which were favored for spirals ten years ago predict little change in spectral properties with redshift until one reaches almost the formation epoch (e.g. Tinsley 1980). Field counts seem consistent with this sort of “mild” evolution (Bruzual & Kron 1980, Tyson 1988), with no evidence for a unique formation epoch at . But spectra for (e.g. Lilly et al. 1991, Broadhurst et al. 1992) yield a surprisingly small and few high redshift () objects. This implies a major change in field properties by (a 2–5 increase in the number of blue objects with LL∗); the spectra also suggest an enhancement of starburst activity. The best explanation is non-conservation of galaxy numbers, probably indicating widespread merging since of smaller objects into larger ones with accompanying starbursts. This is controversial, however, and the “conservative” school argues that the observations can be explained without evolution of any kind, within the uncertainties of local samples and population modeling (Koo & Kron 1992, Koo et al. 1993). My impression is that the no-evolution models do not fit the field data well despite rather extreme input assumptions. However, this is the subject of other reviews in this volume (Ellis and Gardner), so I will not discuss it further.
In the clusters, the changes found at modest redshifts by Butcher & Oemler (1978), namely an increase in the fraction of galaxies which are mags bluer in (B–V) than typical E/S0 objects, were also unanticipated in the “mild” evolutionary models. In nearby clusters, the blue fraction is only %, whereas at it is %. The distant clusters are actually similar to the nearby field, and we now recognize that it is an environmentally-driven loss of this blue population in nearby dense clusters which defines the Butcher-Oemler Effect (Oemler 1992, Dressler et al. 1994).
The broad-band color range of the blue systems is comparable to that of local, normal spirals. It was therefore initially presumed that they are normal disk galaxies. Only recently has high resolution imaging () with CFHT and HST confirmed that they are indeed predominantly disks (Lavery et al. 1992, Couch et al. 1994, Dressler et al. 1994). However, spectroscopy (reviewed by Dressler & Gunn 1990) reveals that some 80% are not normal disk galaxies. Many appear to have abnormally high star formation rates (starbursts) or to be in a quenched phase 1–3 Gyr following a burst, so that the main sequence includes A stars but does not extend to more massive types.
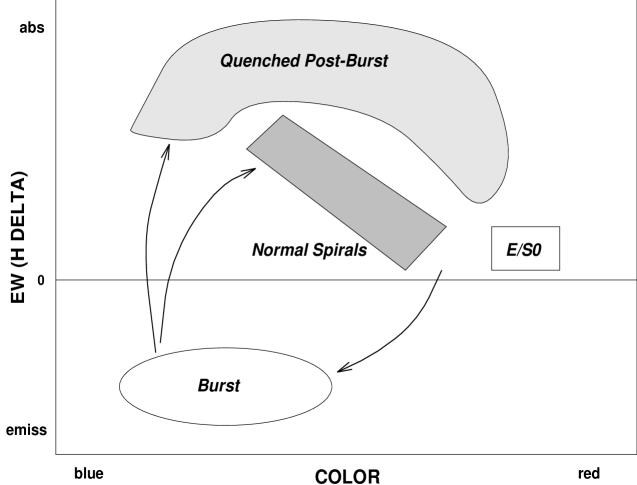
Couch & Sharples (1987) illustrated a particularly useful diagnostic of the blue Butcher-Oemler systems. They plot the net equivalent width of H, measured with Å resolution, against color (see Fig. 1). In this diagram, the burst and quenched systems are well separated from normal spirals and quiescent E/S0’s. Although H is used here, a number of spectral features in the 3500–4500Å region would yield similar results. Broad-band colors, however, would not suffice.
The unusual histories implied by the spectroscopy combined with the recent imaging, which shows that many blue galaxies appear disturbed or are in interacting pairs, strongly implicate interactions or mergers in the Butcher-Oemler Effect. Not all peculiar objects have close companions (Dressler et al. 1994), but this does not necessarily exclude interactions, as shown by the local example of M81/M82. The spiral galaxy M81 has almost certainly induced the starburst now observed in M82’s core; yet neither appears seriously disturbed at low resolution in the optical (except at H), and they are separated by 39 kpc (or at ). The outer parts of M82 have a quenched spectrum. This is a good example of a lingering starburst, as discussed by Schweizer in this volume.
Whether interactions or mechanisms such as IGM ram-pressure (Oemler 1992, Dressler & Gunn 1990) drive the Butcher-Oemler Effect, the destruction of cold gas disks was well advanced by (lookback time Gyr) in rich cluster environments. The final products will be gas-poor, quiescent spirals and S0’s (abundant in nearby clusters) and, if mergers are common, ellipticals. The radial distributions discussed by Couch & Sharples (1987) suggest that E/S0’s are the most common descendents.
3 Evolution of E/S0 Systems
3.1 Local Ellipticals
Any attempt to understand the histories of elliptical galaxies is bedeviled by a dichotomy of properties. On one hand, there is impressive evidence for homogeneity among ellipticals, for instance the good correlations between luminosity and color (Bower et al. 1992) and between velocity dispersion and the Mg2 line index (Bender et al. 1993). The traditional emphasis has been on such regularities, which appear to argue for a single history for all E’s, as described by Renzini and Franx at this conference. On the other hand, there is equally strong evidence, beginning with indications that low-luminosity ellipticals in the Local Group contained intermediate age populations (Aaronson & Mould 1980, O’Connell 1980), for heterogeneity and consequently for diverse histories. Insofar as integrated light is concerned, interpretations are once again strongly influenced by whether one uses broad-band colors or higher resolution spectra (e.g. Rose 1994). I will not give details here, since they have been covered in recent reviews (Freedman 1994, O’Connell 1994) and were the subject of papers at this conference by Bender, Faber, Freedman, and Schweizer.
The local evidence for diversity demonstrates that star formation in E/S0 galaxies can be, though is not always, prolonged (to Gyr ago) and episodic and is often driven by environmental effects. Indeed, that would be entirely consistent with the high redshift data, as described above. The dichotomy of properties arises at least partly from an environmental effect: in denser regions, E/S0 galaxies appear to have evolved faster (Lucey, this conference). This does not entirely explain the regularities, as Renzini and Franx have properly emphasized. Nonetheless, the evidence is strong that E/S0 galaxies are not uniformly old systems which evolve in isolation.
3.2 Evolution of The Red Envelope
The “red envelope” is one of the phenomena suggesting the homogeneity of E/S0 galaxies. It is an empirical upper bound on the colors of galaxies (Sandage & Visvanathan 1978, O’Connell 1988). At low redshift the envelope lies at (B–V), it is well defined in rich clusters, and it is occupied preferentially by luminous E/S0 galaxies. This immediately suggests a test of evolution and galaxy ages: how does the envelope change with redshift?
Properly speaking, this does not test the evolution of elliptical galaxies since morphologies are mostly unknown at . The red envelope is occupied by the least active subset of galaxies irrespective of morphology. In the absence of abnormalities (e.g. AGN’s, dust, line emission, unusual IMF’s, etc.), red envelope systems have experienced the smallest amount of star formation during the preceding Gyr. It is incorrect to assume, as is not uncommon, that all red envelope systems are E/S0 galaxies or that all E/S0 galaxies fall near the envelope. It is also misleading to use “E/S0” to designate spectral or color classifications of distant galaxies whose morphologies are not known.
The red envelope test on quiescent systems is important because it is very difficult to place limits on the early SFH of galaxies with recent star forming activity, such as those discussed in §2. A schematic version of the test is shown in Fig. 2. One uses a color or gross spectral feature such as the 4000 Å Break, preferentially measured in the rest frame of the distant galaxies to avoid “k-corrections”. The test is empirical and differential, so broad-band measures are suitable. Current evolutionary synthesis models (e.g. Bruzual & Charlot 1993, Worthey 1994, Bressan et al. 1994) agree on the rate of change of such colors even if they don’t agree on absolute values (Worthey 1994). For the case shown, the models predict mag/dex. Despite its simplicity, there are many obstacles to applying the test (cf. Aragón-Salamanca et al. 1993). One complication with likely astrophysical content is the occurrence of “red interlopers”—objects with colors too red for a population younger than the age of the universe and therefore probably reflecting an abnormality such as dust or an AGN.
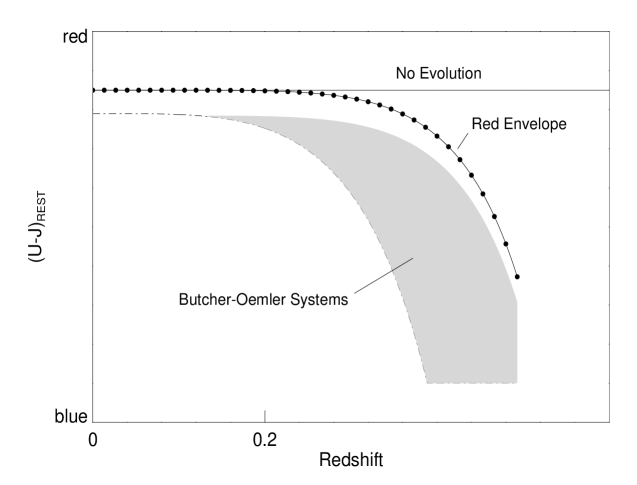
Several groups have now applied the red envelope test to distant clusters and red field galaxies with . Bruzual & Charlot (1993) have summarized 4000 Å Break data from Hamilton (1985) and Spinrad (1986). There is a significant decrease with redshift in the mean and maximum strength of the Break (implying younger populations), a result confirmed by the independent data set of Dressler & Gunn (1990). Departure of the envelope from the no-evolution prediction occurs at . Using the evolutionary models to age-date the Break values, one finds that 3/4 have formation redshifts above 1, which implies a present age of Gyr for H and q. The envelope itself corresponds to present ages of 13–16 Gyr.
A systematic approach has been taken by Aragón-Salamanca et al. (1993), who measured broad-band V,I,K colors in 10 distant rich clusters up to . They find a clear and systematic trend of envelope color with redshift, again departing from the no evolution expectation at . By , the envelope is almost undefined; galaxies scatter in color, and the characteristic red peak with a blueward Butcher-Oemler tail has almost vanished. The envelope trend corresponds to a formation redshift , or a present age of Gyr. The FWHM in the peak at , after removing measurement error, corresponds to a factor of 3 in rest frame age, or a minimum present age of Gyr.
Many detections of red, high objects are now being reported in various deep fields. The red interlopers in nearer clusters suggest that these systems may not always be dominated by unextincted starlight. Recent spectroscopy of high redshift radio galaxies (Hammer et al. 1993) reveals AGN-like continua in some cases and demonstrates that caution is needed in trying to age-date distant field systems from their colors.
4 Conclusion
Strong evolutionary processes have transformed stellar populations in galaxies in the relatively recent past (5 Gyr). The evidence is unambiguous in the case of distant rich clusters, where disk galaxies are undergoing starbursts, probably induced by encounters or mergers. It is strong for field disks as well. That this was largely unanticipated from early studies of nearby galaxies demonstrates the inadequacy of our older tools for population analysis, particularly those based on broad-band colors.
No evidence for a unique galaxy formation epoch has yet emerged. Definite trends in spectral properties with redshift indicate that the least active luminous systems formed 10–13 Gyr ago (for H and q). Ages from such “red envelope” tests do not necessarily apply to all elliptical galaxies or to the progenitors of E/S0’s in the local, low density environment. Judged from both the local and distant samples, galaxy evolution appears to be faster in denser environments.
This research has been supported in part by NASA Long Term Space Astrophysics grant NAGW-2596.
References
- (1)
- (2) Aaronson, M., & Mould, J. 1980, ApJ, 240, 804
- (3) Aragón-Salamanca, A., Ellis, R.S., Couch, W.J., & Carter, D. 1993, MNRAS, 262, 764
- (4) Bender, R., Burstein, D., & Faber, S.M. 1993, ApJ, 411, 153
- (5) Bower, R.G., Lucey, J.R., & Ellis, R.S. 1992, MNRAS, 254, 601
- (6) Bressan, A., Chiosi, C., & Fagatto, F. 1994, ApJ, in press
- (7) Broadhurst, T.J., Ellis, R.S., & Glazebrook, K. 1992, Nature, 355, 55
- (8) Bruzual, G., & Charlot, S. 1993, ApJ, 405, 538
- (9) Bruzual, G. & Kron, R.G. 1980, ApJ, 241, 25
- (10) Butcher, H. & Oemler, A. 1978, ApJ, 219, 18
- (11) Chambers, K.C., & Charlot, S. 1990, ApJ, 384, L1
- (12) Couch, W.J. & Sharples, R.M. 1987, MNRAS, 229, 423
- (13) Couch, W.J., Ellis, R.S., Sharples, R.M., & Smail, I. 1994, ApJ, 430, 121
- (14) Dressler, A. & Gunn, J.E. 1982, ApJ, 263, 533
- (15) Dressler, A., & Gunn, J.E. 1990, in Evolution of the Universe of Galaxies, ed. R.G. Kron, (San Francisco: ASP), p. 200
- (16) Dressler, A., Oemler, A., Butcher, H.R., & Gunn, J.E. 1994, ApJ, 430, 107
- (17) Freedman, W.L. 1994, in The Local Group, (CTIO/ESO), in press
- (18) Fritze-v. Alvensleben, U., & Gerhard, O.E. 1994, A&A, in press
- (19) Gallagher, J.S., Hunter, D.A., & Tutukov, A.V. 1984, ApJ, 284, 544
- (20) Hamilton, D. 1985, ApJ, 297, 371
- (21) Hammer, F., Le Fèvre, O., & Angonin, M.C. 1993, Nature, 362, 324
- (22) Hubble, E. 1936, The Realm of the Nebulae (New Haven: Yale Univ. Press)
- (23) Kennicutt, R.C. 1992, ApJ, 388, 310
- (24) Koo, D.C., Gronwall, C., & Bruzual, G. 1993, ApJ, 415, L21
- (25) Koo, D.C., & Kron, R.G. 1992, ARA&A, 30, 613
- (26) Larson, R.B., & Tinsley, B.M. 1978, ApJ, 219, 46
- (27) Lavery, R.J., Pierce, M.J., & McClure, R.D. 1992, AJ, 104, 2067
- (28) Lilly, S.J. 1988, ApJ, 333, 161
- (29) Lilly, S.J., Cowie, L.L., & Gardner, J.P. 1991, ApJ, 369, 79
- (30) O’Connell, R.W. 1980, ApJ, 236, 430
- (31) O’Connell, R.W. 1988, in Towards Understanding Galaxies at High Redshift, eds. A. Renzini & R.G. Kron (Dordrecht: Kluwer), p. 177
- (32) O’Connell, R.W. 1994, in Nuclei of Normal Galaxies: Lessons from the Galactic Center, ed. R. Genzel (Dordrecht: Kluwer), in press
- (33) Oemler, A. 1992, in Clusters & Superclusters of Galaxies, ed. A.C. Fabian (Dordrecht: Kluwer), p. 29
- (34) Pickles, A.J., & van der Kruit, P.C., A&AS, 84, 421
- (35) Rose, J.A. 1994, AJ, 107, 206
- (36) Sandage, A. & Visvanathan, N. 1978, ApJ, 223, 707
- (37) Schweizer, F., & Seitzer, P. 1992, AJ, 104, 1039
- (38) Silva, D.R. 1991, PhD Thesis, Univ. of Michigan
- (39) Spinrad, H. 1986, PASP, 98, 269
- (40) Tinsley, B.M. 1980, ApJ, 241, 41
- (41) Tyson, J.A. 1988, AJ, 96, 1
- (42) Tyson, J.A., & Jarvis, J.F. 1979, ApJ, 230, L153
- (43) Worthey, G. 1994, ApJS, in press
- (44) Wu, C.-C., Faber, S.M., Gallagher, J.S., Peck, M., & Tinsley, B.M. 1980, ApJ, 237, 290
5 Stellar Populations at Large Redshifts: Update (January 1999)
There has been tremendous progress in the study of stellar populations at large redshifts in the five years since IAU Symposium 164. Two key instruments, the Hubble Space Telescope and the Keck twin 10-m telescopes, have come into their own, and invaluable faint galaxy observations have been added by other telescopes, notably the CFHT and the AAT. The landmark contribution was the deep, multicolor imaging obtained by HST of the Hubble Deep Field (Williams et al. 1996), which catalyzed a broad attack on the early evolution of galaxies. First results of HDF research have been reviewed in two major meetings (Tanvir et al. 1996 and Livio et al. 1997).
The evidence does not support the existence of a unique, well-defined epoch of galaxy formation, at least insofar as the stellar content of galaxies is concerned. To the contrary, the traditional picture (e.g. Tinsley 1980) of star formation in galaxies beginning intensely and synchronously at high redshift and then declining in smooth exponentials, depending only on galaxy type, is almost certainly wrong. Instead, dramatic transformations in star formation histories (even morphologies) appear to prevail among all types of galaxies and in all environments, and these can be traced to relatively recent times (). The oldest systems yet age-dated from spectra are very red radio galaxies at with stellar ages Gyr and therefore formation redshifts (e.g. Peacock et al. 1998). However, the cosmic star formation rate does not exhibit a pronounced maximum anywhere in the sampled redshift range. It rises sharply from low redshifts (Lilly et al. 1996) but then either remains roughly constant for (Steidel et al. 1999) or exhibits a broad peak at an unexpectedly low redshift of (e.g. Pei & Fall 1995, Madau et al. 1996), corresponding to a lookback of 12 Gyr (for H and q).
The situation in the field has been thoroughly reviewed by Ellis (1997). From HST morphological classifications, the systems responsible for the excess in the blue counts of faint galaxies are found to be moderate luminosity, moderate redshift, irregular/peculiar objects which rapidly disappear at lower redshifts (Driver et al. 1995, Abraham et al. 1996, Brinchmann et al. 1998). Their fate, either as faded dwarfs or in mergers, has not been conclusively determined, but the conservative mild- or no-evolution models (§2.2) for the luminosity function seem to be excluded. Luminous spirals and ellipticals show less conspicuous evolution to . Truly quiescent systems with would be distinguished by very red observed colors at . However, the number of such ultrared objects is small, and their statistics (Kaufmann et al. 1996, Zepf 1997, Barger et al. 1999) suggest that the majority of field E/S0 galaxies formed more recently than (a lookback of 10 Gyr). A significant fraction of morphologically-confirmed field E/S0’s and spiral bulges at have experienced major star formation episodes in the preceding 2 Gyr (Abraham et al. 1999, Menanteau et al. 1999). These results contrast with those for denser cluster environments (see below) but seem consistent with expectations for hierarchical formation of many ellipticals from disk mergers.
A remarkably large sample of star-forming systems with has recently been identified, mainly by means of the short-wavelength “dropouts” produced when the Lyman discontinuity at 912 Å in the restframe is redshifted into optical-band filters (Steidel et al. 1996, Lowenthal et al. 1997, Giavalisco 1997). The restframe far-UV spectra resemble local starforming galaxies, with indications of interstellar gas outflows but only inconclusive evidence of lower metal abundances. Estimated star formation rates are generally , much smaller than expected in the traditional rapid collapse models for spheroid formation. Because strong discontinuities in restframe far-UV spectra also occur for populations with ages up to Gyr following the cessation of star formation, the dropout technique should select such quenched systems as well. Their apparent rarity in the spectral samples implies that continuous star formation persists for long periods, Gyr, in the dropout systems.
The dropout systems are intrinsically small, with half-light radii Kpc. Some could be the cores of present-day spheroids, but they will likely evolve, probably often by hierarchical accretion, into a diverse range of descendents.
Recent studies of distant, rich clusters have confirmed and elaborated the interpretation discussed in §2–3 above. Galaxy evolution is definitely accelerated, relative to the field, in the denser cluster environment. Good HST morphological classifications for cluster members now enable the identification of a bona fide E/S0 sample for studies of the “red envelope,” which is found to remain well defined up to (Stanford et al. 1998). Mean trends in E/S0 restframe colors with redshift are consistent with passive evolution and a formation redshift , unlike the behavior in the field. Luminous E/S0’s show an impressively small scatter in the photometric-dynamical correlations of the fundamental plane (e.g. van Dokkum & Franx 1996) and also in restframe color ( mag in U–V); and the color scatter seems independent of redshift, cluster richness, or X-ray properties (Ellis et al. 1997, Stanford et al. 1998). The color scatter places a limit on , where t is the age at the observed epoch. For the quoted 1 value . This means that the ratio of maximum to minimum age for the 68% of the red envelope galaxies within 1 of the mean is 1.9, assuming that age is entirely responsible for the spread. The observations therefore permit a fairly extended period of E/S0 formation in clusters. Unless one can determine the absolute value of by independent means, the color scatter does not constrain the age or formation redshift of the red envelope, though the colors themselves do. Better constraints on could be placed by pressing the observations farther into the restframe ultraviolet.
The high resolution HST data demonstrate that the cluster density-morphology relation has changed significantly from its current-epoch character by a redshift of only (e.g. Dressler et al. 1997, Couch et al. 1998). There are many more spirals (Sa-Sdm/Irr) and many fewer S0’s (factors of 2-4) than in nearby rich clusters. A dominant evolutionary effect in clusters during the past 5 Gyr has therefore been the transformation of spirals into S0’s. The Butcher-Oemler population of blue galaxies does consist mainly of disk systems, but most of these do not have normal spiral-like spectra (see §2.2). The spectral disturbances illustrated in Figure 1 do not last long, and Barger et al. (1996) and Couch et al. (1998) have shown that the statistics of the burst and post-burst spectral types imply that a large proportion, roughly 30%, of the cluster members have suffered major changes in their star formation rates (bursts or quenching) within the preceding 2 Gyr. Most of the objects with intense star formation are definitely undergoing mergers. Although some of the post-burst objects are ellipticals, and therefore possibly merger products, many have normal S0-Sb spiral morphologies. The data suggest that several processes besides major mergers, perhaps small accretion events and ram-pressure stripping, are important in shaping cluster populations.
References
-
(1)
(Updates for 1995-98)
- (2)
- (3) Abraham, R.G., Ellis, R.S., Fabian, A.C., Tanvir, N.R., and Glazebrook, K. 1999, MNRAS, in press
- (4) Abraham, R.G., Tanvir, N.R., Santiago, B., Ellis, R.S., Glazebrook, K., and van den Bergh, S. 1996, MNRAS, 279, L47
- (5) Barger, A.J., Aragón-Salamanca, A., Ellis, R.S., Couch, W.J., Smail, I., and Sharples, R.M. 1996, MNRAS, 279, 1
- (6) Barger, A.J., Cowie, L.L., Trentham, M., Fulton, E., Hu, E.M., Songaila, A., and Hall, D. 1999, AJ, in press
- (7) Brinchmann, J., Abraham, R., Schade, D, Tresse, L, Ellis, R.S., et al. 1998, ApJ, 499, 112
- (8) Couch, W.J., Barger, A.J., Smail, I., Ellis, R.S., and Sharples, R.M. 1998, ApJ, 497, 188
- (9) Dressler, A., Oemler, A., Couch, W.J., Smail, I., Ellis, R.S., et al. 1997, ApJ, 490, 577
- (10) Driver, S.P. , Windhorst, R.A., Ostrander, E.J., Keel, W.C., Griffiths, R.E., and Ratnatunga, K.U. 1995, ApJ, 449, L23
- (11) Ellis, R.S. 1997, Ann. Rev. Astr. Ap., 35, 389
- (12) Ellis, R.S., Smail, I., Dressler, A., Couch, W.J., Oemler, A., et al. 1997, ApJ, 483, 582
- (13) Giavalisco, M. 1997, in The Hubble Deep Field, eds. M. Livio, S.M. Fall, and P. Madau, (Cambridge: Cambridge University Press), p. 121
- (14) Kauffmann, G., Charlot, S., and White, S.D.M. 1996, MNRAS, 283, L117
- (15) Lilly, S.J., Le Fèvre, Hammer, F., and Crampton, D. 1996, ApJ, 460, L1
- (16) Livio, M., Fall, S. M., and Madau, P. (eds) 1997, The Hubble Deep Field (Cambridge: Cambridge University Press)
- (17) Lowenthal, J.D., Koo, D.C., Guzman, R., Gallego, J., Phillips, A.C., et al. 1997, ApJ, 481, 673
- (18) Madau, P., Ferguson, H.C., Dickinson, M.E., Giavalisco, M., Steidel, C.C., and Fruchter, A. 1996, MNRAS, 283, 1388
- (19) Menanteau, F., Ellis, R.S., Abraham, R.G., Barger, A.J., and Cowie, L.L. 1999 MNRAS, in press
- (20) Peacock, J.A., Jimenez, R., Dunlop, J.S., Waddington, I., Spinrad, H., et al. 1998, MNRAS, 296, 1089
- (21) Pei, Y.C., and Fall, S.M. 1995, ApJ, 454, 69
- (22) Stanford, S.A., Eisenhardt, P.R., and Dickinson, M. 1998, ApJ, 492, 461
- (23) Steidel, C.C., Adelberger, K.L., Giavalisco, M., Dickinson, M., and Pettini, M. 1999, ApJ, in press
- (24) Steidel, C.C., Giavalisco, M., Pettini, M., Dickinson, M., and Adelberger, K.L. 1996, ApJ, 462, L17
- (25) Tanvir, N.R., Aragón-Salamanca, A. and Wall, J.V., (eds) 1997, HST and the High Redshift Universe, (Singapore: World Scientific Press)
- (26) van Dokkum, P.G., and Franx, M. 1996, MNRAS, 281, 985
- (27) Williams, R.E., Blacker, B., Dickinson, M., Van Dyke Dixon, W., Ferguson, H. C., et al. 1996, AJ, 112, 1335
- (28) Zepf, S.E. 1997, Nature, 390, 377