The Rapidly Fading Optical Afterglow of GRB 980519
Abstract
GRB 980519 had the most rapidly fading of the well-documented GRB afterglows, consistent with in as well as in X-rays during the two days in which observations were made. We report observations from the MDM 1.3m and WIYN 3.5m telescopes, and we synthesize an optical spectrum from all of the available photometry. The optical spectrum alone is well fitted by a power law of the form , with some of the uncertainty due to the significant Galactic reddening in this direction. The optical and X-ray spectra together are adequately fitted by a single power law . This combination of steep temporal decay and flat broad-band spectrum places a severe strain on the simplest afterglow models involving spherical blast waves in a homogeneous medium. Instead, the rapid observed temporal decay is more consistent with models of expansion into a medium of density , or with predictions of the evolution of a jet after it slows down and spreads laterally. The jet model would relax the energy requirements on some of the more extreme GRBs, of which GRB 980519 is likely to be an example because of its large -ray fluence and faint host galaxy.
1 Introduction
The localization of gamma-ray bursts (GRBs) by the Wide Field Camera (WFC) on the BeppoSAX satellite (Boella et al. 1997) has enabled rapid and detailed follow-up studies to be made at other wavelengths, including x-ray (Costa et al. 1997), optical (van Paradijs et al. 1997), and radio (Frail et al. 1997). Perhaps the most important result of this breakthrough has been the measurement of cosmological redshifts for five bursts (Metzger et al. 1997; Kulkarni et al. 1998, 1999; Djorgovski et al. 1998a, 1999), and the detection of faint host galaxies for these five plus four others, leading to the conclusion that the majority of, if not all GRBs, are the most energetic events in the Universe.
GRB 980519 was one of the brightest in the BeppoSAX WFC (Muller et al. 1998; in ’t Zand et al. 1999), second only to GRB 990123 (Feroci et al. 1998). The onset of 2–27 keV emission from GRB 980159 in the WFC preceded the BATSE trigger on May 19.514035 UT by about 70 s (in ’t Zand et al. 1999), a phenomenon which characterizes only a few percent of bursts. The BATSE measured fluence above 25 keV was ergs cm-2, among the top 12% of BATSE bursts (Connaughton 1998). An X-ray observation with the BeppoSAX Narrow Field Instruments (NFI) began 9.7 hr after the burst (Nicastro et al. 1998), and detected an afterglow with a 2–10 keV flux of ergs cm-2 s-1 in the first 4 hours, which faded by about a factor of 4 in the 1.2 days following.
The optical afterglow of GRB 980519 was discovered by Jaunsen et al. (1998) 8.8 hr after the burst using the 2.5m Nordic Optical Telescope (NOT). Initially estimated at magnitude , this was the first optical afterglow to appear brighter than the limiting magnitude of the Palomar Sky Survey, thus enabling immediate recognition. Djorgovski et al. (1998b) confirmed the optical transient (OT), and noted that its decay was consistent with . Kemp and Halpern (1998) obtained additional photometry and calibrations which showed that the initial NOT detection was actually brighter than first suggested (, see below). VLA observations within the first three days (Frail, Taylor, & Kulkarni 1998) detected a variable 8.3 GHz source at the position of the OT. Sub-millimeter observations at the JCMT eight days after the burst yielded only upper limits (Smith et al. 1999). Two months after the burst, deep optical observations detected a faint coincident object of magnitude (Sokolov et al. 1998) or (Bloom et al. 1998a), which is presumed to be the GRB host galaxy. Its redshift has not been determined.
2 Optical Observations
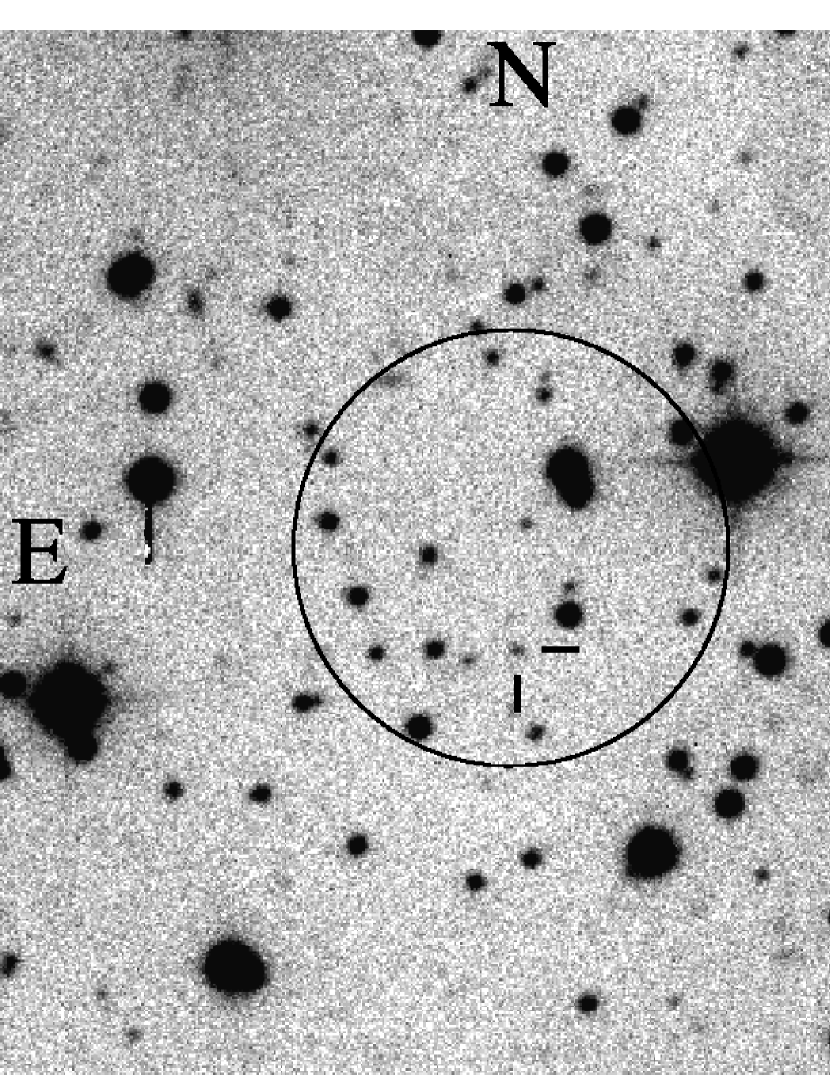
We obtained and photometry of GRB 980519 on the MDM Observatory 1.3m telescope, and a image on the WIYN 3.5m telescope, both on Kitt Peak. Figure 1 shows the -band image and the BeppoSAX NFI error circle. We measure a position for the OT of (J2000) , with an error radius of . This is consistent with the radio position reported by Frail et al. (1998). Exposure times were s in and s in . The sky was reasonably clear during the MDM observations, where we also obtained calibrations using the standard star field of PG 0918+029 (Landolt 1992). Conditions started to deteriorate soon thereafter, when a single uncalibrated 600 s image was obtained at WIYN. The results of these observations are listed in Table 1. Also listed are all available photometry from other observatories. Some of these observations were obtained with independent calibrations, and some were reported with respect to comparison stars calibrated by others. We have done our best to convert all of the reported magnitudes to a common system in Table 1. During this campaign three different calibrations were employed, those of MDM (Kemp & Halpern 1998), Palomar (Bloom et al. 1998b, Gal et al. 1998), and the USNO (Henden et al. 1998). Since the USNO calibration set is the most complete, and was obtained on photometric nights with Landolt standards, we have chosen to adopt this system. We find that in and , the MDM magnitudes of comparison stars are fainter than the USNO by 0.10, while the Palomar magnitudes are fainter by 0.07. In the Palomar magnitudes are brighter than the USNO by 0.2, while in Palomar is brighter by 0.14. Accordingly, these corrections have been applied to the published magnitudes.
In Figure 2 we graph the light curves in four bands using the data from Table 1. For clarity, upper limits are not plotted as they do not contribute any additional constraints. Also not plotted are the unfiltered magnitudes of Maury et al. (1998), although these are roughly consistent with the -band light curve. All of the bands are consistent with the same power-law decay, . The solid lines represent the best fit to a single decay constant, with only the normalization adjusted for each band. We note that the power-law decay index of the X-ray afterglow, as reported by Owens et al. (1998), is consistent with the optical, and that these are cotemporaneous observations.
3 Continuum Shape and Reddening
It is possible to synthesize a spectrum from these data by interpolating the magnitudes to a particular time. We chose a time of May 20.34 UT, 19.8 hr after the burst, because it coincides with the largest number of measurements, and because the resulting spectrum can be compared with the X-ray flux from the simultaneous BeppoSAX follow-up. The interpolated magnitudes were converted to fluxes using the effective wavelengths and normalizations of Fukugita, Shimasaku, & Ichikawa (1995), and graphed as filled circles in Figure 3. Galactic reddening is a significant factor in this field because of its intermediate Galactic latitude, . The selective extinction can be estimated in at least two ways. First is the value of Schlegel, Finkbeiner, & Davis (1998) from the IRAS m maps, mag. This is somewhat different from a second estimate, mag, which can be derived from the Galactic 21 cm column density in this direction, cm-2 (Stark et al. 1992), and the standard conversion cm-2 mag-1 (Savage & Mathis 1979). Figure 3 shows the results of applying each of these corrections, using the relative extinctions from Schlegel et al. (1998). In either case, the spectrum is a good fit to a power law of the form . The smaller extinction requires , while the larger extinction corresponds to . Regarding these two choices as indicative of the range of systematic error, we adopt as a final result and uncertainty.
Although there is no strong evidence of additional reddening intrinsic to the afterglow, one cannot rule out small amounts that are comparable to the systematic uncertainties in the Galactic value. An additional constraint on the total extinction can be obtained in a weakly model-dependent way by comparing the extrapolated optical spectrum to the simultaneous X-ray flux as measured by the BeppoSAX NFI. If the synchrotron afterglow models have any validity, then the optical-to-X-ray spectral index should be less than or equal to the measured in the optical band alone. That is, if there are any breaks in the broad-band spectrum, they should be concave downward. In order to make this comparison, we must estimate the X-ray flux at the fiducial time of the synthesized optical spectrum. The X-ray afterglow spectrum is fitted by energy index (Owens et al. 1998). Using this index, we convert the flux of ergs cm-2 s-1 measured in the 2–10 keV band in the interval between 9.7 and 13.7 hours after the burst (Nicastro et al. 1998) to a flux of Jy at 4.5 keV. The X-ray temporal decay of GRB 980518, , is the fastest of the seven afterglows that were well measured by BeppoSAX (Owens et al. 1998). From this temporal decay, we infer that by h the flux had faded by a factor of 3 to Jy. Figure 4 shows the broad-band optical to X-ray spectrum at h estimated in this manner. We allow for an uncertainty of on the X-ray flux in this crude analysis. The optical spectrum and its uncertainties in extrapolation are consistent with the X-ray flux, and jointly they prefer of about –1.05. We conclude that any intrinsic optical extinction is small, and that a single power law is a marginally consistent description of all the available optical through X-ray data. We therefore adopt as an observed constraint on models.
4 Interpretation and Conclusions
Other bursts with well measured light curves have in the range –1.1 to –1.2 (Bloom et al. 1998c; Diercks et al. 1998; Reichart et al. 1999). The GRB 980519 data described here provide the one case of a steep () afterglow decay that is well documented at several frequencies. Therefore, the continuum spectral shape, together with the temporal decay, can be used to test afterglow models that relate these two quantities. In the simplest form of the external relativistic blast wave model (Mészarós & Rees 1997; Wijers, Rees, and Mészarós 1997), electrons accelerated to a power-law energy distribution proportional to , are responsible for a decaying synchrotron spectrum of the form . The energy index if the cooling time is longer than the age of the shock (the adiabatic case), and it is related to the corresponding temporal decay constant as . Since we observe all across the spectrum from optical to X-ray, we would expect a spectral slope , incompatible with the observed . Although the optical slope alone is consistent with , such a model falls short of matching the X-ray flux by a factor of 10. Equivalently, would predict , incompatible with either the X-ray or the optical decay. If, instead, we assume that the electrons are in the “cooling” regime, for which and (e.g., Sari, Piran, & Narayan 1998), then the discrepancy is even worse, since would require . If there is actually a cooling break between the optical and the X-ray at the epoch illustrated in Figure 4, or additional extinction in the GRB host galaxy, it would exacerbate the discrepancy between and in the optical.
Of course, these are idealized models involving isotropic expansion into a homogeneous medium. One modification to the model that might be more compatible with GRB 980519 is an inhomogeneous medium. Mészarós, Rees, & Wijers (1998) calculated the effects of differing power-law density distributions for the shocked medium and concluded that would result in if . Both of these values are consistent with GRB 980519. An dependence is appropriate for a pre-existing stellar wind.
Alternatively, one can consider anisotropic beaming models. It has long been hypothesized that GRBs are beamed, as a way of ameliorating the energetics problem. Although we have no redshift for GRB 980519 and therefore no handle on its energetics, the fact that its host galaxy at ( corrected for Galactic extinction) is one of the fainter of the nine probable hosts detected so far means that it could be quite distant and energetic. [GRB 981220 has a coincident object of (Bloom et al. 1999). Only GRB 980326 is apparently lacking a host galaxy to a limiting magnitude (Bloom & Kulkarni 1998).] Assuming that GRB 980519 is at , for km s-1 Mpc-1 and its luminosity distance is at least cm and the BATSE measured fluence of ergs cm-2 corresponds to an isotropic energy of ergs. This number would rise to ergs at , greater than that of the highest redshift burst, GRB 971214 at , for which an isotropic energy of ergs was inferred (Kulkarni et al. 1998).
Jet models (Rhoads 1999) predict a transition from radial expansion to lateral spreading, after which the temporal decay steepens to . Values of in the range 2–2.5 are expected. In an accompanying paper (Sari et al. 1999), predictions of jet models for GRB 980519 and other afterglows are explored, under the assumption that a transition from radial to transverse expansion had already occurred before the first optical observation. We consider that the combination of the steep afterglow decay and faint and possibly distant host galaxy of GRB 980519 make it a good candidate for a jet.
| Date (1998 UT) | Telescope | Filter | Magnitude | Reference |
|---|---|---|---|---|
| May 19.88 | NOT 2.5m | I | 1 | |
| May 20.00 | NOT 2.5m | I | 1 | |
| May 20.31 | MDM 1.3m | I | 2 | |
| May 20.43 | Palomar 5m | I | 3 | |
| May 20.98 | NOT 2.5m | I | 1 | |
| May 21.17 | NOT 2.5m | I | 1 | |
| May 21.35 | Yerkes 41 in | I | 4 | |
| May 21.43 | Palomar 5m | I | 5 | |
| May 20.163 | USNO 40 in | R | 6 | |
| May 20.229 | USNO 40 in | R | 6 | |
| May 20.287 | USNO 40 in | R | 6 | |
| May 20.31 | MDM 1.3m | R | 2 | |
| May 20.4 | MRO 0.76m | R | 7 | |
| May 20.44 | APO 3.5m | R | 8 | |
| May 20.445 | USNO 40 in | R | 6 | |
| May 20.48 | Palomar 5m | R | 3 | |
| May 21.469 | Palomar 5m | R | 5 | |
| May 21.6 | Keck II 10m | R | 5 | |
| July 18.5 | Keck II 10m | R | 9 | |
| July 24 | BTA 6m | R | 10 | |
| May 20.34 | WIYN 3.5m | V | 2 | |
| May 20.466 | Palomar 5m | V | 5 | |
| May 21.476 | Palomar 5m | V | 5 | |
| May 20.057 | Wise 1m | B | 11 | |
| May 20.449 | Palomar 5m | B | 5 | |
| May 21.448 | Palomar 5m | B | 5 | |
| May 19.863 | OCA 0.9m | none | 12 | |
| May 20.077 | OCA 0.9m | none | 12 | |
| May 20.964 | OCA 0.9m | none | 12 |
References
- (1) Bloom, J. S., & Kulkarni, S. R. 1998, GCN Circ. 161
- (2) Bloom, J. S., Kulkarni, S. R., Djorgovski, S. G., Gal, R. R., Eichelberger, A., & Frail, D. 1998a, GCN Circ. 149
- (3) Bloom, J. S., Djorgovski, S. G., Gal, R. R., Kulkarni, S. R., & Kelly, A. 1998b, GCN Circ. 87
- (4) Bloom, J. S., et al. 1998c, ApJ, 508, L21
- (5) Bloom, J. S., Djorgovski, S. G., Gal, R. R., Kulkarni, S. R., & Brauher, J., Frail, D. A., Goodrich, R., & Chaffe, F. 1999, GCN Circ. 196
- (6) Boella, G., et al. 1997, A&AS, 122, 299
- (7) Castander, F. J., Evans, R., Reichart, D. E., Lamb, D. Q., & Wild, W. 1998, GCN Circ. 90
- (8) Connaughton, V. 1998, GCN Circ. 86
- (9) Costa, E., et al. 1997, Nature, 387, 783
- (10) Diercks, A. H., et al. 1998, ApJ, 503, L105
- (11) Diercks, A., & Morgan, J. 1998, GCN Circ. 91
- (12) Diercks, A., & Stubbs, C. 1998, GCN Circ. 82
- (13) Djorgovski, S. G., Kulkarni, S. R., Bloom, J. S., Goodrich, R., Frail, D. A., Piro, L., & Palazzi, E. 1998a, ApJ, 508, L17
- (14) Djorgovski, S. G., Gal, R. R., Kulkarni, S. R., Bloom, J. S., & Kelly, A. 1998b, GCN Circ. 79
- (15) Djorgovski, S. G., Kulkarni, S. R., Bloom, J. S., Frail, D., Chaffee, F., & Goodrich, R. 1999, GCN Circ. 189
- (16) Feroci, M., Piro, L., Frontera, F., Torroni, V., Smith, M., Heise, J., & in ’t Zand, J. 1998, IAU Circ. 7095
- (17) Frail, D. A., Kulkarni, S. R., Nicastro, L., Feroci, M., & Taylor, G. B. 1997, Nature, 389, 261
- (18) Frail, D. A., Taylor, G. B., & Kulkarni, S. R., 1998, GCN Circ. 89
- (19) Fukugita, M., Shimasaku, K., & Ichikawa, T. 1995, PASP, 107, 945
- (20) Gal, R. R., Bloom, J. S., Steidel, C., Adelberger, K. L., Djorgovski, S. G., & Kulkarni, S. R. 1998, GCN Circ. 88
- (21) Henden, A., Vrba, F. J., Luginbuhl, C. B., Canzian, B., Levine, S. R., Guetter, H. H., & Munn, J. A. 1998, GCN Circ. 96
- (22) Hjorth, J., Jaunsen, A. O., Kjernsmo, K., & Pederson, H. 1998, GCN Circ. 84
- (23) in ’t Zand, J. J. M., Heise, J., van Paradijs, J., & Fenimore, E. E. 1999, ApJ, in press
- (24) Jaunsen, A. O., Hjorth, J., Andersen, M. I., Kjernsmo, K., Pederson, H., & Palazzi, E. 1998, GCN Circ. 78
- (25) Kemp, J., & Halpern, J. P. 1998, GCN Circ. 80
- (26) Kulkarni, S. R., et al. 1998, Nature, 393, 35
- (27) Kulkarni, S. R., et al. 1999, Nature, in press
- (28) Landolt, A. U. 1992, AJ, 104, 372
- (29) Leibowitz, E., & Ibbetson, P. 1998, GCN Circ. 124
- (30) Maury, A., Albanese, D., & Boer, M. 1998, GCN. Circ. 85
- (31) Mészarós, P., & Rees, M. J. 1997 ApJ, 476, 232
- (32) Mészarós, P., Rees, M. J., & Wijers, R. A. M. J. 1998, 499, 301
- (33) Metzger, M. R., et al. 1997, Nature, 387, 879
- (34) Muller, J. M., Heise, J., Butler, C., Frontera, F., Di Ciolo, L., Gandolfi, G., Coletta, A., & Soffitta, P. 1998, IAU Circ. 6910
- (35) Nicastro, L., Antonelli, L. A., Celidonio, G., Daniele, M. R., De Libero, C., Spoliti, G., Piro, L., & Pian, E. 1998, IAU Circ. 6912
- (36) Owens, A., et al. 1998, A&A, 339, L37
- (37) Reichart, D. E., et al. 1998, astro-ph/9806082
- (38) Rhoads, J. E. 1999, ApJ, submitted
- (39) Sari, R., Piran, T., & Narayan, R. 1998, ApJ, 497, L17
- (40) Sari, R., Piran, T., & Halpern, J. P. 1999, ApJ, submitted
- (41) Savage, B. D., & Mathis, J. S. 1979, ARAA, 17, 73
- (42) Schlegel, D. J., Finkbeiner, D. P., & Davis, M. 1998, ApJ, 500, 525
- (43) Smith, I. A., et al. 1999, A&A, in press
- (44) Sokolov, V., Zharikov, S., Palazzi, L., & Nicastro, L. 1998, GCN Circ. 148
- (45) Stark, A. A., Gammie, C. F., Wilson, R. W., Bally, J., Linke, R. A., Heiles, C., & Hurwitz, M. 1992, ApJS, 79, 77
- (46) van Paradijs, J., et al. 1997, Nature, 386, 686
- (47) Vrba, F. J., et al. 1998, GCN Circ. 83
- (48) Wijers, R. A. M. J., Rees, M. J., & Mészarós, P. 1997, MNRAS, 288, L51