The Interaction of New and Old Magnetic Fluxes at the Beginning of Solar Cycle 23
Abstract
The 11-year cycle of solar activity follows Hale’s law by reversing the magnetic polarity of leading and following sunspots in bipolar regions during the minima of activity. In the 1996-97 solar minimum, most solar activity emerged in narrow longitudinal zones - ‘active longitudes’ but over a range in latitude. Investigating the distribution of solar magnetic flux, we have found that the Hale sunspot polarity reversal first occurred in these active zones. We have estimated the rotation rates of the magnetic flux in the active zones before and after the polarity reversal. Comparing these rotation rates with the internal rotation inferred by helioseismology, we suggest that both ‘old’ and ‘new’ magnetic fluxes were probably generated in a low-latitude zone near the base of the solar convection zone. The reversal of active region polarity observed in certain longitudes at the beginning of a new solar cycle suggests that the phenomenon of active longitudes may give fundamental information about the mechanism of the solar cycle. The non-random distribution of old-cycle and new-cycle fluxes presents a challenge for dynamo theories, most of which assume a uniform longitudinal distribution of solar magnetic fields.
1Pulkovo Astronomical Observatory, St. Petersburg, 196140,
Russia
2W.W.Hansen Experimental Physics Laboratory, Stanford University,
Stanford, CA 94305-4085
Subject headings: Sun: magnetic fields — Sun: activity — Sun: interior—Sun: sunspots—Sun: rotation
1 Introduction
The longitudinal and latitudinal distributions of solar magnetic fields have been investigated by many authors (e.g. Ambroz, 1973; Gaizauskas, et al. 1983; Bumba, 1989; Bai, 1995). Complexes of solar activity are zones of field concentration 20∘–60∘ wide that during subsequent rotations tend to reappear at constant longitude or drift slightly eastward or westward. These active zones may persist for 20–40 consecutive rotations and are called ‘Magnetic Active Longitudes’ (Bumba and Howard, 1969). According to Gaizauskas et al. (1983), complexes of solar activity are maintained by new magnetic flux contributed by active regions emerging within those complexes. Moreover, each complex of solar activity rotates around the Sun at a steady rate. The period is often close to the 27.28-day Carrington rotation period. A weaker background field pattern may rotate as a solid body at a different rate.
According to dynamo theory (e.g. Parker, 1993) the source of the 11-year solar activity cycle is located at the base of the convection zone, and the bipolar sunspot groups are ‘-loops’ of toroidal magnetic field that erupt through the solar surface. The toroidal component is called positive when its direction is westward, thus when the leading spot of a bipolar region is positive, the component is negative. During Cycle 22 the polarity of preceding sunspots was positive in the southern hemisphere; the opposite was true in the northern hemisphere where . Cycle 23 began in September, 1996, as determined from smoothed sunspot numbers. Sunspot polarities in the new cycle are reversed according to Hale’s law (Hale et al., 1919). Therefore, we call the magnetic flux observed in Cycle 23 ‘old’ if in the northern hemisphere or in the southern hemisphere; we call the magnetic flux ‘new’ if the sign of is reversed.
The present study investigates the latitudinal and longitudinal organization of the ‘new’ and ‘old’ solar magnetic fields near solar minimum. We use synoptic maps derived from SOHO/MDI full-disk magnetograms (Scherrer et al., 1995) obtained near the minimum of solar activity and during the beginning of the current solar cycle. We analyzed data for 24 rotations beginning with Carrington Rotation 1911 (CR 1911), from June 1996 to April 1998. We compare the results with data obtained during the previous solar minimum, between May 1986 and February 1988, at the Wilcox Solar Observatory (Hoeksema & Scherrer, 1986).
2 Results of the Analysis of Observations
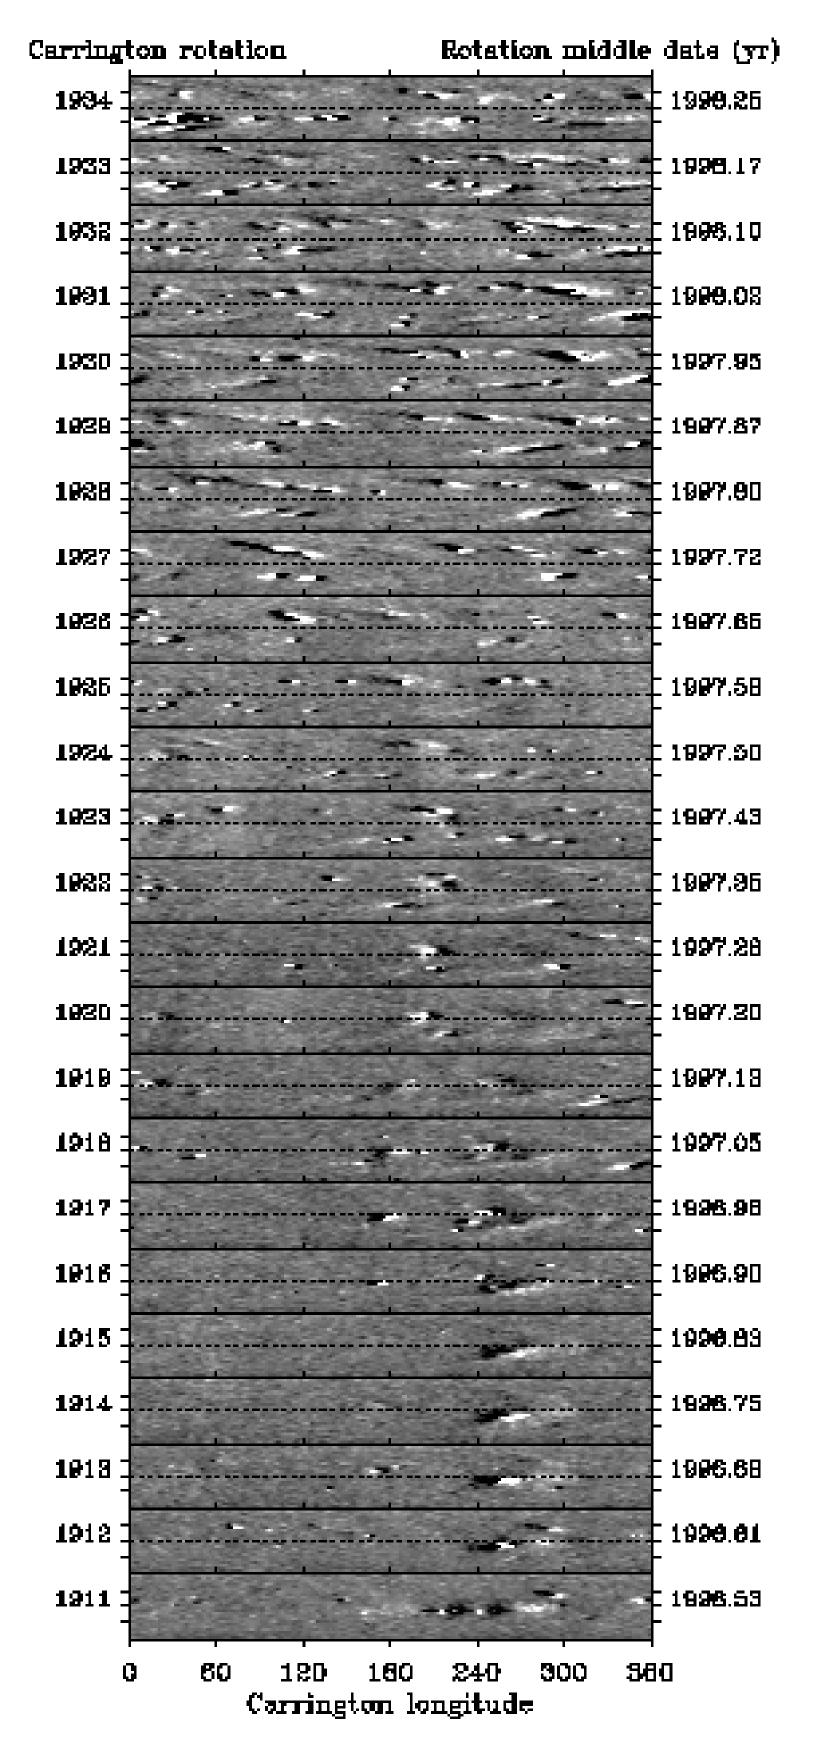
The SOHO/MDI full-disk magnetograms are -pixel images of the line-of-sight component of magnetic field ( measured in Gauss on the solar surface. To obtain synoptic charts the original data were binned down to pixels and then transformed into the Carrington coordinate system. The Carrington system is the conventional longitudinal system on the Sun; it matches the rotation rate of sunspots at a latitude of about and has a mean synodic rotation period of about 27.2753 days. The synoptic maps for CR 1911–1934 are shown in Fig. 1. The size of transformed elements on these maps is 1∘ in both longitude and latitude. The maps cover from 0∘ to 360∘ in longitude and from -65∘ to 65∘ in latitude.
During this interval the active regions are not distributed randomly. They are clustered in complexes of activity, as in earlier cycles (Bumba and Howard, 1969). Magnetic flux emerges at particular fixed longitudes. During this period the ‘old’ magnetic flux of the previous solar cycle disappears at low latitudes as ‘new’ flux of the current cycle starts appearing at higher latitudes ().
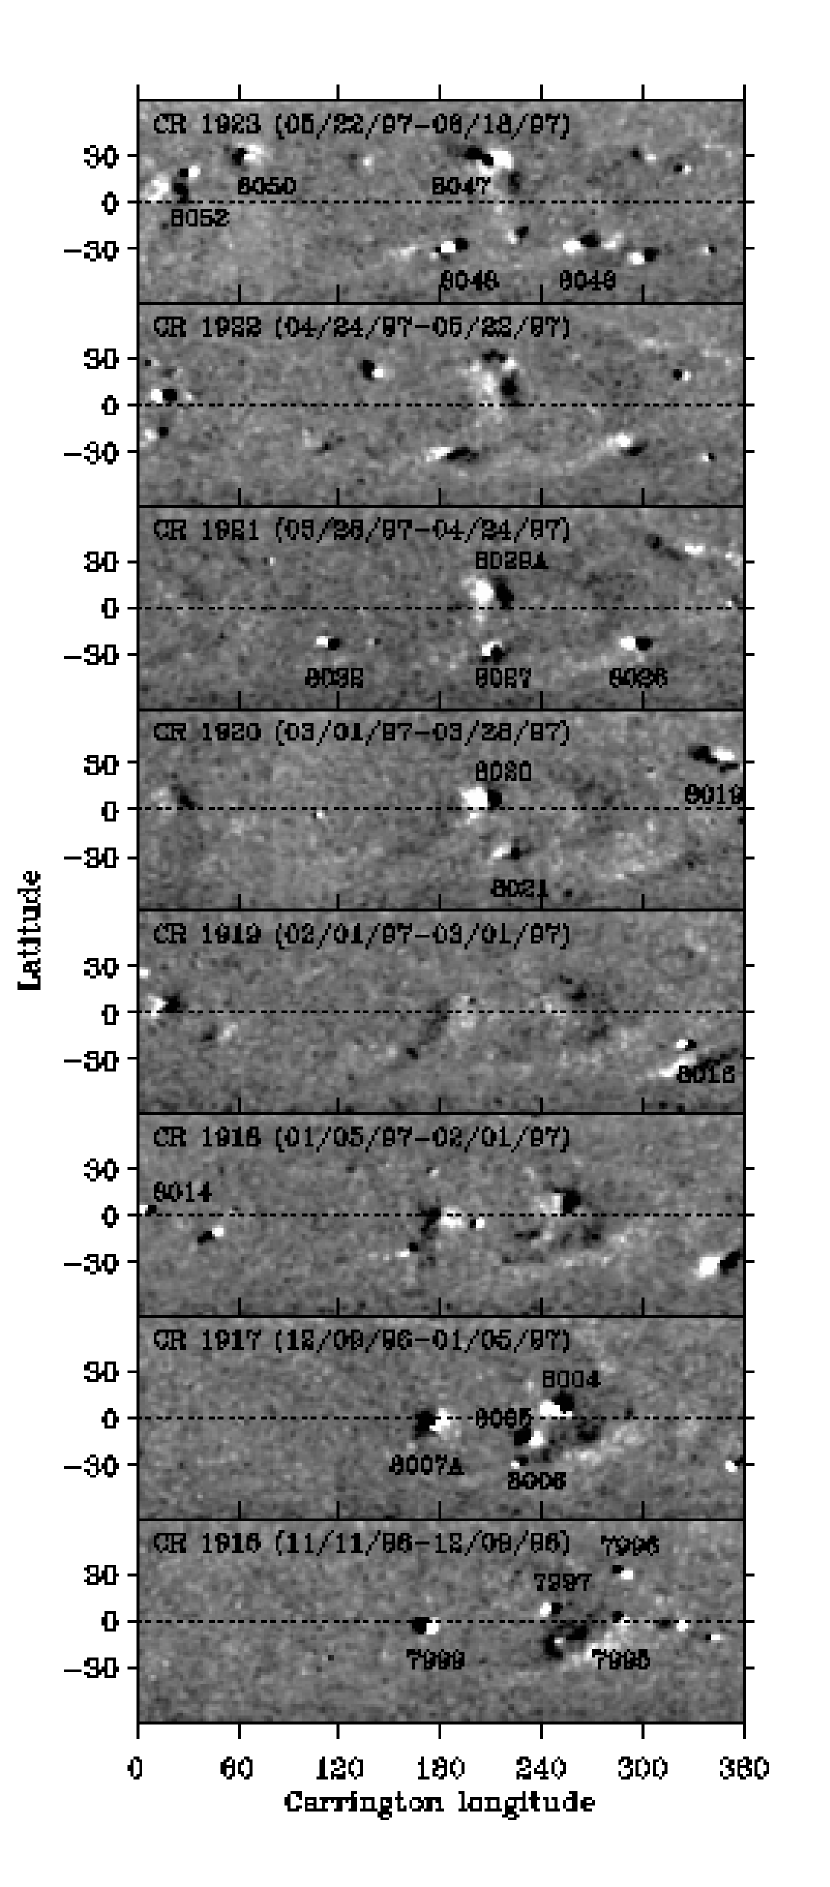
The transition from old to new cycle flux is largely concentrated in the interval CR 1916–1923, which is shown in more detail in Fig. 2. A few short-lived active regions of the new cycle appeared much earlier. For instance, during CR 1911 a bipolar region of the new cycle () in the northern hemisphere is visible at longitudes 280∘–300∘, but this region had decayed by CR 1912. In CR 1912 a short-lived bipolar region is visible in the northern hemisphere (30∘N) at longitude 70∘.
We focus our investigation on zones living longer than 2 rotations. One major zone occurred at longitudes 240∘–280∘ and lived over a year. This longitude was active from CR 1911 to CR 1917 (region NOAA 8006) in the southern hemisphere and from CR 1916 to CR 1918 (NOAA 7997) in the northern hemisphere. This active zone of old flux, which was gradually decaying and migrating westward, reactivated in CR 1923, when a new-cycle complex of solar activity (NOAA 8046) emerged in the southern hemisphere at longitude .
Another interesting strong active zone developed at 160∘–200∘ and drifted slowly westward. This zone of old-cycle flux first appeared in the southern hemisphere in CR 1916 (NOAA 7999) and persisted in CR 1917 (8007A); then in CR 1918 new cycle flux emerged in this zone at latitude 20∘S. During CR 1920 one of the last regions of the old cycle appeared at longitudes 200∘–240∘ in the northern hemisphere (NOAA 8020) and decayed over the next two rotations; then, in CR 1923 a new cycle region appeared in the same hemisphere but at higher latitudes. In CR 1920 and 1921 both ‘new’ (8021 and 8027) and ‘old’ (8020 and 8029A) fluxes existed at the same longitude of , but in different hemispheres. We see a similar coexistence of ‘new’ (8006) and ‘old’ (8005) regions in the southern hemisphere in CR 1917.
In both active longitude zones the old-cycle magnetic flux was replaced by new cycle flux. The activity in northern and southern hemispheres behaved differently, but having the same active longitudes in the two hemispheres is quite common. A weaker active zone at 320∘–360∘ appeared in CR 1919, when activity complex of the new cycle (NOAA 8016) emerged at latitude 30∘S. In CR 1920 the northern hemisphere became active instead of the southern hemisphere at this longitudes (NOAA 8019).
After CR 1923 all significant bipolar regions were of the new cycle and through CR 1934 the number of sunspots substantially increased and covered latitudinal zones 10∘–40∘ wide in both hemispheres.
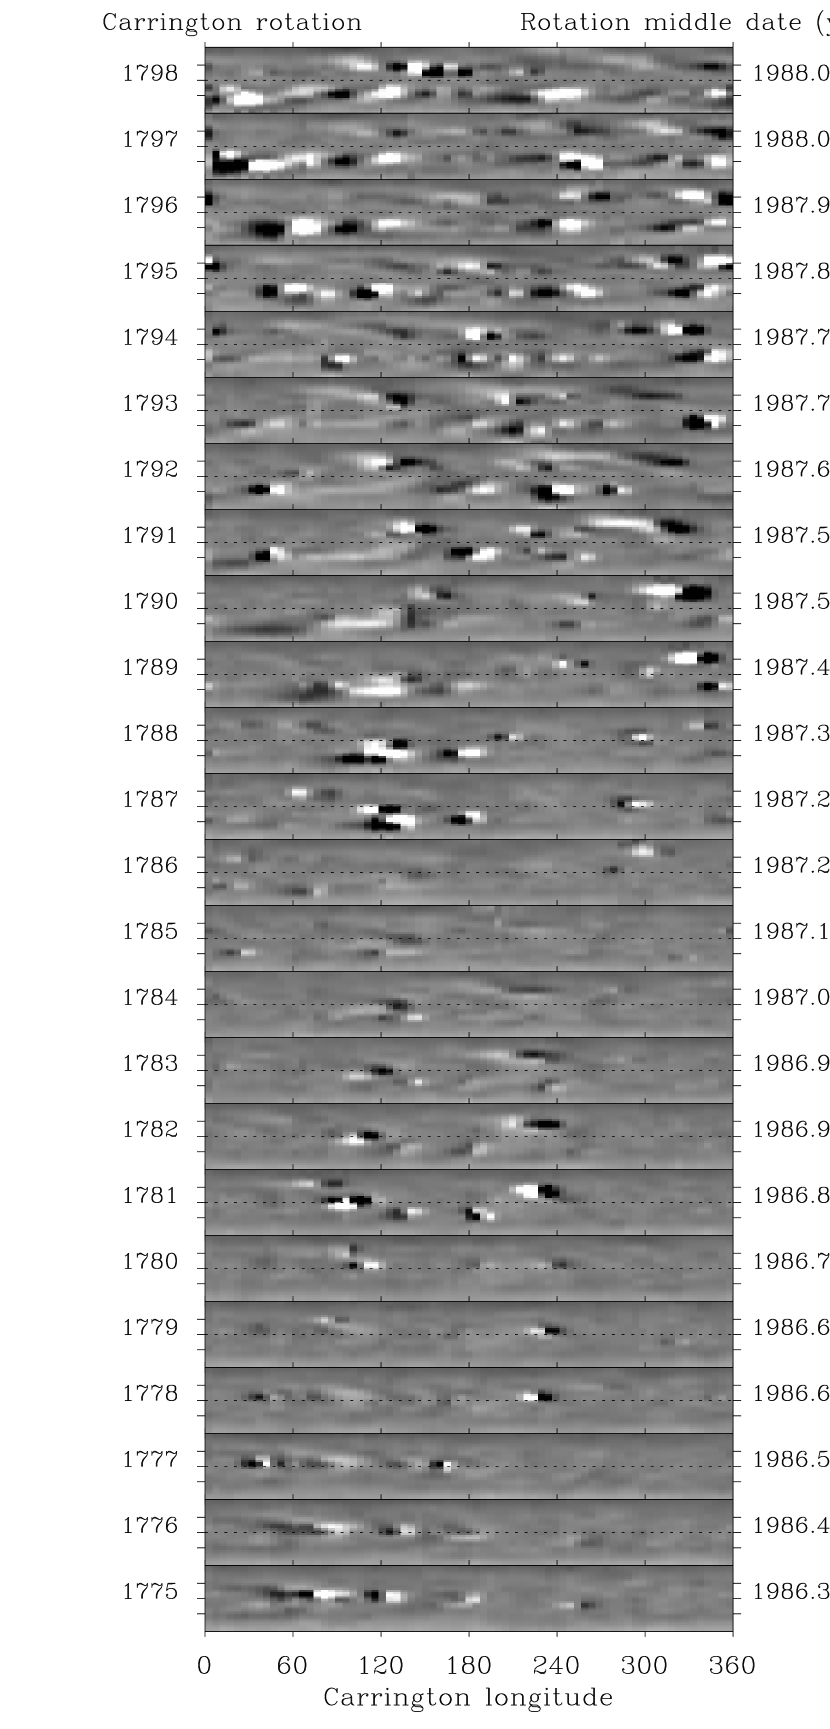
During the previous solar minimum, between Cycles 21 and 22, the interaction between the ‘old’ and ‘new’ magnetic fluxes was very similar: the ‘old’ flux was concentrated in two longitudinal zones, and most of the initial ‘new’ flux emerged in the same zones, at longitudes 230∘ and 120∘(Fig. 3).
3 Rotation of the Active Zones
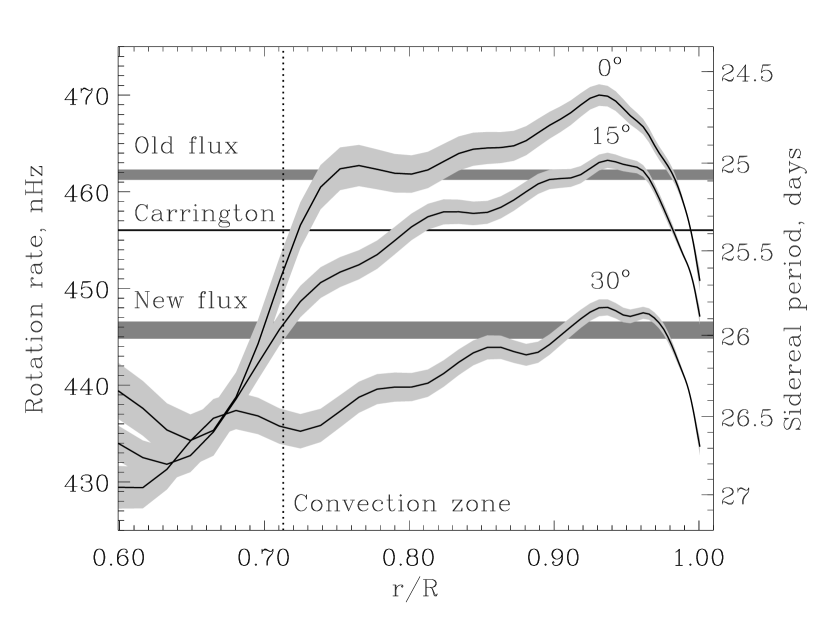
We have determined the sidereal rotation rate of -wide latitudinal zones near the equator (the ‘old’ flux zone) and at (where the ‘new’ flux appeared) using the data for the current cycle. The rotation rate of magnetic flux was determined separately for the northern and southern hemispheres. To measure the rotation rate we cross-correlated the magnetic fields measured for subsequent rotations in the latitudinal zones, then averaged the cross-correlation functions separately for each zone for 10 rotations before CR 1922 and 10 rotations after CR 1923, and, finally, determined the location of the maxima of the averaged cross-correlation functions by fitting a Gaussian. We have also applied this procedure to the individual longitudinal active zones using several different averaging periods and obtained similar results. The rotation rate of the equatorial zones in both hemispheres ranged between 461.2 and 462.3 nHz, with a mean value of 461.8 nHz and -error estimate 0.5 nHz (corresponding sidereal period days). This value is close to the rotation rate of recurrent sunspots in this zone, 462.1 nHz (25.05 days), determined by Newton and Nunn (1951). For the zones, the rotation rates in the northern and southern hemispheres were slightly different: nHz ( days) and nHz ( days) respectively. Both these values are higher than the recurrent sunspot rotation rate of 440.6 nHz (26.27 days) at latitude.
Figure 4 compares these measurements with the internal rotation rate inferred by helioseismology (Schou et al., 1998). It appears that the rotation rate of the old flux is close to the equatorial rotation rate of plasma in the lower convection zone and in the upper part of the convection zone. However, the old flux rotates faster than the averaged rotation rate in the tachocline - the region of the steep radial gradient of solar rotation at the bottom of the convection zone, where the magnetic flux is probably generated (e.g. Golub et al., 1981; Parker, 1993). The rotation rate of the new flux at latitude matches the internal rotation at the same latitude only in a narrow zone of fast rotation in the upper part of the convection zone, approximately at 0.91–0.98 solar radii; it is significantly lower than the rotation rate in the bulk of convection zone including the tachocline.
4 Discussion
Solar activity was predominantly clustered in narrow longitudinal zones during the recent transition from Solar Cycle 22 to 23, near the minimum of solar activity. Similar clustering occurred at the beginning of the previous cycle. New-cycle magnetic flux with reversed polarity first replaced old magnetic flux concentrations at the same longitude. Only later did the new-cycle flux emergence spread to other longitudes in both hemispheres. This observation suggests that the phenomenon of active longitudes may provide fundamental information about the solar dynamo. Current dynamo theories do not explain this phenomenon. Ruzmaikin (1998) recently suggested that longitudinal clustering of emerging magnetic flux may be caused by large-scale non-axisymmetric modes of the dynamo. It will be important to develop quantitative physical models of the flux clustering.
The clustering of new and old cycle regions at particular longitudes suggests that the primary dynamo regions are also localized in longitude. The subsurface rotation profiles (Fig. 4) suggest that this zone may also be localized in latitude, viz. near the equator.
The new flux, which appears near latitude, rotates faster than the mean convection zone rotation rate at that latitude. It matches the subsurface rotation only in a fairly narrow zone from 0.91-0.98 . In principle flux originating at the bottom of the convection zone at latitude could be accelerated to the observed rate in this rapidly rotating sub-surface stream zone. However, this is inconsistent with behavior observed at low latitudes, where the rotation of the old flux at the equator does not approach the rotation rate of the equatorial sub-surface stream at the same depth.
Perhaps the new flux comes from a different latitude and retains the rotation rate of the deeper layer in which it originates. Then one way to understand the faster rotation of the new flux is if the flux generation occurs at a lower latitude, where the rotation rate is higher, and the emerging loops are transported to higher latitudes during their propagation through the convection zone.
Suppose the new flux originates in a convectively stable layer just beneath the convection zone, as indicated by most dynamo theories. Then the 445 nHz rotation rate suggests that the source layer is probably confined to low latitudes, or even lower. The near equatorial band also has the strongest radial rotation rate gradient at the base of the convection zone, something essential for the dynamo. It will be important to study rotation of the new and old fluxes in the active zones in more detail.
One possible mechanism for linking the locations of flux emergence associated with the two cycles is if flux from different cycles resides at approximately the same latitude and longitude but at different depths. An irregularity at a particular location associated with the dynamo of one cycle could perturb the flux of the other cycle. The result might be emergence of flux associated with each cycle in both the northern and southern hemisphere at the same longitude. Another possibility is influence of a non-uniform relict magnetic field in the Sun’s radiative interior (cf. Gough and McIntyre, 1998).
Our results make the difficult solar dynamo problem even more challenging, because one must also explain why the old magnetic flux was replaced with new flux of the opposite polarity in a narrow range of active longitudes during the transition from one solar cycle to another. We have also found that the rotation rate of the new magnetic flux emerging at latitude was higher than the rotation rate of the solar plasma in the bulk of the convection zone. This suggests that the new magnetic flux may be generated in a narrow low-latitude zone, and maybe, even in the same near-equatorial zone as the old flux.
References
- 1 Ambroz, P. 1973, Bull. Astron. Inst. Czechosl., 24, 80
- 2 Bai, T. 1995, in: Magnetodynamic Phenomena in the Solar Atmosphere. Prototypes of Stellar magnetic Activity. Proc. IAU Coll 153, ed. Y. Uchida, p.337.
- 3 Bumba, V. and Howard, R.: 1969, Sol. Phys., 7, 28
- 4 Bumba, V. 1989, Bull. Astron. Inst. Czechosl., 40, 17
- 5 Gaizauskas, V., Harvey, K. L., Harvey, J. W. and Zwaan C. 1983, ApJ, 265, 1056.
- 6 Golub, L., Rosner, R., Vaiana, G.S., and Weiss, N.O. 1981, ApJ, 243, 309.
- 7 Gough, D.O. and McIntyre, M.E., 1998, Nature, 394, 755.
- 8 Hale, G.E., Ellerman, F., Nicholson, S.B., and Joy, A.H., 1919, ApJ, 49, 153.
- 9 Hoeksema, J.T. & Scherrer, P.H., 1986, Sol. Phys., 105, 205.
- 10 Newton, H.W. and Nunn, M.L., 1951, MNRAS, 111, 413.
- 11 Parker, E.N. 1993, ApJ, 408, 707.
- 12 Ruzmaikin, A.A. 1998, Sol. Phys., 181,1.
- 13 Scherrer, P.H. et al., 1995, Sol. Phys., 162, 129.
- 14 Vitinskij Y. I. 1982, Soln. Dannye, 2, 113.