The Question of the Peak Separation in the Vela Pulsar111to be published in Proc. 19th Texas Symposium (Mini-symposium: “Pulsars and Neutron Stars”)
Abstract
We calculate gamma-ray spectra of pulsars for a set of electron acceleration models within the polar-cap scenario. We discuss our results in the light of the recent analysis (Kanbach 1999) of temporal properties of the Vela pulsar in the EGRET energy range.
1 Introduction
In a recent analysis of gamma-ray double-peak pulses of the Crab, the Vela and Geminga, as detected by EGRET , Kanbach (1999) pointed to an intriguing possibility that for the Vela pulsar the phase separation () between the two peaks may actually be energy dependent. The energy-averaged value of the separation is very large in all three objects, between 0.4 and 0.5 (Fierro, Michelson & Nolan 1998), and the effect by itself is of the order of a few percent or less. In the case of the Vela pulsar (the object with the best photon statistics), the plot of against energy (Fig.2 middle panel of Kanbach 1999) shows that is decreasing by about over 20 energy intervals covering the range between and . The scatter of the points seems to us, however, also consistent with the separation staying at a constant level of , provided that we reject the lowest and the highest energy interval.
The problem raised by Kanbach is important by itself from a theoretical point of view, regardless of whether his finding becomes well established or not. With future high-sensitivity missions like GLAST, any firm empirical relation between the peak-separation and the photon energy may serve as a tool to verify some models of pulsar activity.
The presence of two peaks in gamma-ray pulses with large (0.4 - 0.5) phase separation may be understood within a scenario of a single canonical polar cap (e.g. Daugherty & Harding 1996, Miyazaki & Takahara 1997). One need to assume, however, a nearly aligned rotator, i.e. a rotator where three characteristic angles are of the same order: - the angle between spin axis and the magnetic moment , - the opening angle between a direction of the gamma-ray emission and , and - the angle between and the line of sight. For a canonical polar cap and instant electron acceleration, roughly equals radians only (where denotes a spin period). To avoid uncomfortably small characteristic angles, Daugherty & Harding (1996) postulated that primary electrons come from more extended polar caps, and with the acceleration occuring at a height of several neutron-star radii . The latter assumption may be justified by a GR effect found by Muslimov & Tsygan (1992).
The aim of this paper is to present general properties of obtained numerically (and to some degree semi-analytically) for four simplified versions of a polar-cap activity model. In Section 2 we outline the model. Section 3 describes the results and offers some explanation of the presented effects. Conclusions follow in Section 4.
2 The Model
We use a polar cap model with beam particles (primary electrons) distributed evenly along a hollow cone formed by the magnetic field lines from the outer rim of a canonical polar cap, i.e. with an opening angle , where radians at the stellar surface level (). In one case (model C - see below) we assume The essential ingredients of the high-energy processes had been introduced by Daugherty & Harding (1982), with high-energy radiation due to curvature and synchrotron processes (CR and SR, respectively) induced by primary electrons accelerated to ultrarelativistic energies. The pulsar parameters are those of the Vela: the spin period , and the dipolar magnetic field at the polar cap .
Within the hollow-cone geometry we have considered three scenarios for electron acceleration: model A - beam particles are injected at a height with some initial ultrarelativistic energy (the values of are listed in Table 1) and no subsequent acceleration; model B - similar to model A but beam particles are injected at a height ; model C - beam particles are injected at a height with a low energy and then accelerated by a longitudinal electric field present over a characteristic scale height , resulting in total potential drop :
| (1) |
For comparison, we considered a model with a uniform electron distribution over the entire polar cap surface (i.e. ): model D - beam particles are injected at a height with initial ultrarelativistic energy as in the model A, and no subsequent acceleration.
The values of in models A, B and D, and the potential drop in model C were chosen to yield similar number of secondary pairs - about per beam particle. Table 1. summarizes the properties of the models.
Table 1. Model parameters. primary electrons Model A 1.0 3.0 0.0 1.0 TeV, no acceleration Model B 1.0 5.0 1.0 1.0 TeV, no acceleration Model C 3.0 10.0 2.0 2.0 , acceleration (see eq.(1)) with volts Model D 1.0 3.0 0.0 TeV, no acceleration
3 Results
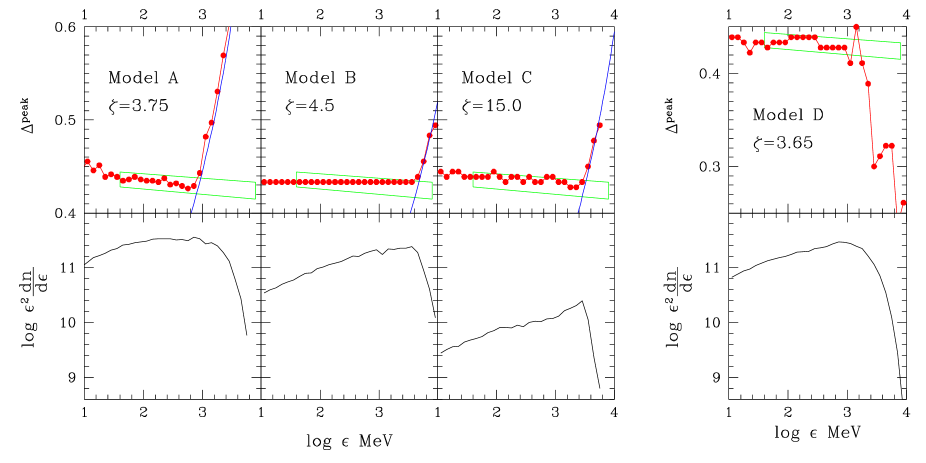
We have calculated numerically the pulse shapes as a function of photon energy for all four models. The main difference between models A and B is due to different values of which result in different locations of origin of secondary particles. Changing these locations is an easy way to modify spectral properties of emergent radiation and enables to change (preferrably - to increase) the angle as constrained by the observed energy-averaged peak separation (Kanbach 1999). For a given model there are two possible values of the angle resulting in a desired peak separation at some energy (which we choose to be ), and we took the larger one in each case: , and degrees for models A, B, C, and D, respectively.
In Fig. 1 we present dependency of peak separation on photon energy for all four models. Within a ‘low-energy‘ range (below a few GeV) the peak separation either remains constant (Model B) or slightly decreases with the increasing photon energy (Models A, C, and D). At a critical energy around a few GeV, the separation undergoes a sudden turn: for it either rapidly increases (models A, B and C) or rapidly decreases (model D). For comparison, the overall trend (taking into account a substantial scatter of points) resulting from the analysis by Kanbach (see Fig.2, middle panel, of Kanbach 1999) is marked schematically.
It would be easy to understand why should stay at a constant level in the range if the gamma-ray photons were due exclusively to CR (especially in models with no acceleration). A preferred direction of this emission would be set up already at the lowest magnetospheric altitudes. This is because a monotonic decrease of the electron’s energy , and initial increase in the dipolar curvature radius make the level of contribution to the one-particle CR-spectrum at all energies to be the highest one just at the initial altitude . However, in the energy range below a few GeV the gamma-ray emission in our models is dominated by the synchrotron radiation (SR) due to secondary pairs in the cascades. The resulting behaviour of - either its slight decrease with increasing (models A and C) or no change at all (model B) - is actually mediated by several factors which influence directional and spectral properties of the SR. These include energy and pitch angle distributions of secondary pairs, as well as the spatial spread of these pairs within the magnetospere (see e.g. Rudak & Dyks 1999). These factors do change from one model to another.
At the energy the separation undergoes a sudden turn and starts changing rapidly as increases. (This occurs above , where most photons are due to CR.) This is the regime where the position of each peak in the pulse is determined by the magnetospheric opacity due to .
For the hollow-cone models (A, B and C) the photons in both peaks of a pulse come from low magnetospheric altitudes with narrow opening angles. When is high enough these photons will be absorbed by the magnetic field with subsequent pair-creation. In other words, inner parts of the ‘original’ peaks in the pulse will be eaten-up and the gap between the peaks (i.e. the peak separation) will increase. Photons which now found themselves in the ‘new’ peaks come from higher altitudes (the magnetosphere is transparent to them) and have wider opening angles. To quantify this line of arguments we present a simple semi-analytical solution for as a function of , which reproduces with astonishing accuracy our Monte Carlo results (see Fig.1). For each point (at a given radial coordinate ) lying on a magnetic field line with a known angular coordinate on the stellar surface, one defines the ”escape energy” (Harding et al. 1997), which is the upper limit for photon energy if the photon is to avoid magnetic absorption when propagating outwards. We have approximated with a power-law formula MeV, and the values of and were found by fits to numerical solutions for each model. We found , for and (models A and B); , for and (model C). Photons of some energy will escape the magnetosphere only when they are emitted at , where is the solution of the equation . Let us now assume for simplicity, that photons which form the ‘new’ peaks originate just at (this is a reasonable assumption, especially for the models with no acceleration). With the coordinate of such an emitting ring determined, we now calculate the corresponding opening angle (for dipolar magnetic field lines) and then . In Fig.1 the blue lines represent the values of found semi-analytically, while the red dots are the Monte Carlo results. This branch of solution intersects the horizontal line set by at , , and GeV for models A, B, and C, respectively.
For model D, with uniform distribution of primary electrons over the polar cap (but otherwise identical to model A) changes of above , occur in the opposite sense. Unlike in previous models, here both peaks of the pulse are formed by photons which were emitted along magnetic field lines attached to the polar cap at some opening angle . These photons are less attenuated than those coming from the outer rim, and in consequence the peak separation drops. Similar behaviour was obtained by Miyazaki & Takahara (1997) in their model of a homogeneous polar-cap.
Regardless the actual shape of the active part (i.e. ‘covered’ with primary electrons) of the polar cap (either an outer rim, or an entire cap, or a ring), one does expect in general strong changes in the peak separation to occur at photon energies close to high-energy spectral cutoff due to magnetic absorption. To illustrate this, the lower panels of Fig. 1 present the energy output per logarithmic energy bandwidth at the first peak as a function of photon energy for models A, B, C and D.
4 Summary
Motivated by the recent suggestion (Kanbach 1999) that the peak separation in gamma-ray pulses in the Vela pulsar may be energy dependent over the range of to , we calculated gamma-ray pulses expected in polar-cap models with magnetospheric activity induced by curvature radiation of beam particles. Two types of geometry of a magnetospheric column above the polar cap were assumed: a hollow-cone column attached to the outer rim of the polar cap and a filled column. Four models were considered with three scenarios for beam acceleration. The emission showing up as double-peak pulses is a superposition of curvature radiation due to beam particles and synchrotron radiation due to secondary pairs in cascades. The changes in the peak separation were investigated with Monte Carlo numerical simulations and then reproduced (to some extent) with semi-analytical methods.
We found that for the energy range the peak separation either slightly decreases with increasing photon energy at the rate consistent with Kanbach (1999), or stays at a constant level. The gamma-ray emission in this range is dominated by synchrotron radiation in all four models considered. The actual behaviour of depends on physical properties of the pairs as well as on their spatial extent in the magnetosphere, which vary from one model to the other.
At the peak separation makes an abrupt turn, and for it changes dramatically. It increases in the hollow-cone models (A, B, C) and decreases in the filled-column model (D), at a rate phase per decade of photon energy. This is due to magnetic absorption effects (). The numerical behaviour of in the hollow-cone models was reproduced with good accuracy with a simple semi-analytical approach to the condition of magnetospheric transparency for a photon of energy , originating at a given point in the dipolar magnetic field and propagating outwards at a given direction.
The value of is model-dependent and for the cases considered here it stays between and . To find such hypothetical turnover of in real observational data would require, however, high-sensitivity detectors, since for the expected flux of gamma-rays drops significantly (Fig. 1, lower panels). If observed, this turnover would be a signature of polar cap activity in gamma-ray pulsars, with high-energy cutoffs in their spectra due to magnetic absorption. A detailed account of the effects presented above will be given elsewhere (Dyks & Rudak 1999, in preparation)
Acknowledgments
This work has been financed by the KBN grants 2P03D-00911 and 2P03D-01016. We are grateful to Gottfried Kanbach for discussions on EGRET data of the Vela pulsar.
References
Daugherty, J.K., Harding, A.K., 1982, ApJ, 252, 337
Daugherty, J.K., Harding, A.K., 1996, ApJ, 458, 278
Fierro, J.M., Michelson, P.F., Nolan, P.L., 1998, ApJ, 494, 734
Harding A.K., Baring, M.G., Gonthier, P.L., 1997, ApJ, 476, 246
Kanbach, G., 1999, Proceedings of the 3rd INTEGRAL Workshop, in press
Miyazaki, J., Takahara, F., 1997, MNRAS, 290, 49
Muslimov,A.G., Tsygan, A.I., 1992, MNRAS, 255, 61
Rudak, B., Dyks, J., 1999, MNRAS, 303, 477