06()
fmantovani@ira.bo.cnr.it
VLBI observations of 3C 273 at 22 GHz and 43 GHz.
I: Search for short time-scale structural variation
Abstract
The results of VLBI observations of the quasar 3C 273, obtained during a multi-frequency campaign in late 1992 in the radio, millimeter and X-ray bands are presented and discussed. The VLBI observations were made at 22 GHz with a Global Array and at 43 GHz with the Very Long Baseline Array. Hybrid maps and modelfits were made in order to look for any short time scale structural variations of the inner part of the radio jet. In 42 days 3C 273 was observed 5 times at roughly 10 day intervals. The jet structure did not show dramatic changes in that period. However, we were able to follow the changes in the positions of the components along the first 2 mas of the jet with respect to the core. The resolution achieved by these observations allows the decomposition of the apparent velocity vector of each component into two orthogonal directions. We find evidence of reverse motion for a component along the jet. The jet starts wiggling well inside the first parsec from the core. The spatial period of the quasi-sinusoidal oscillating jet path about the jet major axis was derived for distances between 2 and 8 mas from the core.
1 Introduction
The quasar 3C 273 (z=0.158; Schmidt 1963) is one of the most studied superluminal radio sources (e.g. Zensus et al. 1990). Due to its brightness and proximity (1 milliarcsecond corresponds to 1.85 parsec; =100 km sMpc-1, =0.5), it has been the target of Very Long Baseline Interferometry (VLBI) observations over a wide range of radio frequencies.
The radio structure of 3C 273 shows a well defined core-jet morphology from the mas scale up to the arcsecond scale. The jet extends out to 20 arcseconds with the ridge line of emission showing a clear ‘wiggle’ (Davis et al. 1985). VLBI imaging at frequencies from 5 to 100 GHz has shown that the ridge line of the jet is curved on a scale from 0.05 to 25 mas, oscillating around the main orientation of the jet (Bååth et al. 1991; Krichbaum et al. 1990; Zensus et al. 1990). Zensus et al. (1990), examining the positions of the components at various epochs, pointed out that major bends apparently occur at about 0.2, 3–4, 10–11 and 15–17 mas from the core. They also suggest that discrepancy in the position angles of some of the components observed at different frequencies may represent a spectral index gradient across the jet which implies a frequency dependence of the jet ridge line in the evolution of parsec-scale jet. Krichbaum et al. (1990) investigated the jet structure and showed that there are clear indications that the jet bends along its entire length down to 1 mas. (There are too few observations interior to this). They also pointed out that the ridge line in the jet has a quasi-sinusoidal shape.
We present here VLBI observations of 3C 273 at 22 GHz and 43 GHz. They were performed as part of a multi-frequency campaign carried out from December 12, 1992 to January 24, 1993. Results from the X-ray observations can be found in Leach et al. (1995) and for the mm-band observations in McHardy et al. (1994). Hybrid maps at the two frequencies for four out of five epochs of observations will be shown. Model-fitting of the final data set obtained as a result of the imaging/self-calibration process had performed also. An analysis of the source structure in the first 8 mas of the jet and measurements for short time-scale structural variations in 3C 273 are presented and the results discussed.
2 Observations and data reduction
The VLBI observations used an array consisting of the VLBA 111Very Long Baseline Array of the National Radio Astronomy Observatory, USA and Effelsberg 222The 100-m telescope of the Max Planck Institut für Radioastronomie, Germany, Medicina and Noto 333The 32-m twin telescopes of the Istituto di Radioastronomia, Italy at 22 GHz, while the stand-alone VLBA was used at 43 GHz. Five sets of observations were made from December 1992 to January 1993 at roughly 10 day intervals. Data were recorded on Mark IIIA compatible terminals, in Mode E (14 MHz bandwidth). Typically, each scan had lasted 13 minutes. The data were correlated at the Array Operations Centre in Socorro, New Mexico. The correlator output was calibrated in amplitude and phase using 444 is the NRAO’s Astronomical Image Processing System and imaged using DIFMAP 555DIFMAP is part of the Caltech VLBI software Package (Shepherd et al. 1995).
The amplitude calibration of VLBI observations at 22 GHz and 43 GHz, is mainly limited by the lack of point source calibrators. System Temperature measurements were made at the end of each scan and the gain curve of each telescope was used to correct the variation of effective antenna gain with antenna elevation for all telescopes. The calibration accuracy differs between observing sessions, owing to different weather conditions. (Millimetric observations are sensitive to the water vapor content of the atmosphere.)
Images were made for each ’calibrator’ source scheduled for a few scans during the observing program, namely 0804499 and 1611343 at 22 GHz, OJ 287 and BL Lac at 43 GHz. From an inspection of the visibility plots, it appears that these sources were barely resolved with the array and are therefore reasonable calibrators. The poor uv-plane coverage (3700 and 5000 visibilities on average at 22 GHz and43 GHz respectively) and the rms noise ( 14 mJy) did not allow these to be mapped properly. Much of the flux from their jet structure (see Kellermann et al. 1998) is clearly lost. We were able to image the central brightest component only and most of the emission from the more extended structure is missed.
The self-calibration procedure, which uses closure amplitudes to determine telescope amplitude corrections, gave calibration factors that are within 10% of unity. Total power measurements, contemporary with the VLBI observations, were not available for the calibrators. These sources are known to be highly variable with time at high frequencies. Light curves at 22 GHz for 1611343 and OJ 287 can be found in Tornikoski et al. (1994). The ratio between our extrapolated ‘zero baseline’ flux density and the total power flux density is 0.75 for both 1611343 and OJ 287. Tornikoski et al. (1994) also report monitoring observations for BL Lac at 37 GHz. Here, the ratio between the two flux densities is 0.5. However, BL Lac has a more extended structure than 1611343 and OJ 287 and we were unable to image this successfully.
The total correlated flux density for 3C 273 at both frequencies is about one half of the total power measurements with single dish. However, correlated flux and total power flux follow a similar trend (see, for example von Montigny et al. 1997). More recent 22 GHz VLBA observations by Leppänen et al. (1995) do show a similar ratio. In conclusion we estimate that the systematic amplitude calibration errors for any of the data sets are .
During session four (14 January 1993), the array was so heavily affected by adverse weather conditions that only crude images could be made. Data from that session will not be used in the following discussions. Table 1 summarizes the observational data and imaging. Column 1: project name; column 2: date of the observation; column 3: observing frequency; column 4: stations; column 5: beam major axis; column 6: beam minor axis; column 7: major axis Position Angle; column 8: dynamic range, i.e. the ratio between the peak flux density and the rms noise in the image, measured far from the source of emission.
Table 1 - VLBI observations of 3C 273
| Project | Date | Freq. | Stationsa | beam | rms noise | dynamic | ||
|---|---|---|---|---|---|---|---|---|
| GHz | mas | mas | deg | mJy/beam | range | |||
| bj5a | 12Dec1992 | 22.2 | EB,MC,VLBA-HN-SC-FD-KP-LA-NL-PT-BR-OV | 1.3 | 0.2 | -8 | 14 | 386 |
| 43 | VLBA-FD-KP-LA-NL-PT-BR-OV | 0.8 | 0.5 | 7 | 12 | 393 | ||
| bj5b | 21Dec1992 | 22.2 | EB,MC,VLBA-HN-SC-FD-KP-LA-NL-BR-OV | 1.0 | 0.2 | -8 | 5 | 1266 |
| 43 | VLBA-HN-FD-KP-LA-NL-PT-BR-OV | 0.7 | 0.4 | -9 | 5 | 1080 | ||
| bj5c | 04Jan1993 | 22.2 | EB,MC,VLBA-HN-SC-FD-KP-LA-NL-BR-OV | 1.0 | 0.2 | -6 | 10 | 427 |
| 43 | VLBA-HN-FD-KP-LA-NL-PT-BR-OV | 0.7 | 0.4 | -5 | 5 | 451 | ||
| bj5e | 23Jan1993 | 22.2 | MC,NT,VLBA-HN-SC-FD-KP-LA-NL-BR | 1.3 | 0.5 | 0 | 4 | 376 |
| 24Jan1993 | 43 | VLBA-HN-FD-KP-LA-NL-PT-BR | 0.6 | 0.4 | 44 | 5 | 566 |
a: The station labels listed are those for which visibilities were available at the end of the analysis of the raw correlated data for each session, and are as follows: EB = Effelsberg (Germany) 100-m, MC = Medicina (Italy) 32-m, NT = Noto (Italy) 32-m, VLBA: HN = Hancock, SC = St. Croix, FD = Fort Davis, KP = Kitt Peak, LA = Los Alamos, NL = North Liberty, PT = Pie Town, BR = Brewster, OV = Owens Valley, (USA) 25-m. Noto did not take part in the first two sessions.
3 The mas structure of 3C 273
The images obtained for each epoch at 22 GHz and 43 GHz are shown in Figs. 1–8. The quality of the images is variable since the data quality from each station, the calibration accuracy, the (u,v) coverage change between sessions.


3.1 The overall structure
With the observations at 22 GHz and 43 GHz we were able to track the jet up to a distance of 8 mas (12 pc) from the core. We identify the core with the easternmost component and we furthermore assume this to be stationary. The jet consists of a bright region of emission, which extends up to 2 mas and a region of much weaker emission which extends from 2 to 8 mas. The resolution achieved was not enough to resolve the jet in a direction transverse to the major axis. The images confirm that the jet is not collinear and has a wiggling structure.
The image from the best available data set at 22 GHz (project bj5b; 21Dec92) has a beam of 1 0.5 mas and shows that the jet can be tracked as far as 15 mas from the core (see Fig. 9). The ridge line of emission clearly oscillates around the main orientation. We will discuss this subject in more detail in section 3.5.

The jet major axis has a Position Angle (PA) of . It is interesting to compare that PA with those available in the literature for interferometric observations made at different resolutions. As shown in Tab. 2, the PA changes from for the arcsecond jet, which is aligned to an accuracy of with the optical jet (Bachall et al. 1995) to for the 1 mas jet.
Table 2 - The Position Angle of the jet major axis in 3C 273
| Freq. | HPBW | Range | P.A. | Reference | ||
|---|---|---|---|---|---|---|
| GHz | mas | mas | deg | mas | deg | |
| 0.4 | 0–25 | Davis et al. 1985 | ||||
| 5.0 | 2 | 1 | 0–50 | Zensus et al. 1988 | ||
| 22.2 | 0.25 | 1.9 | 0–2 | Zensus et al. 1990 | ||
| 22.2 | 0.96 | 0.27 | 0–8 | Leppänen et al. 1995 | ||
| 43.0 | 0.5 | 0.13 | 0–0.2 | Krichbaum et al. 1990 | ||
| 0–0.8 | ||||||
| 43.0 | 0.8 | 0.4 | 0–0.4 | present paper | ||
| 0–0.7 | ||||||
| 0–1 | ||||||
| 0–2 | ||||||
| 0–8 | ||||||
| 100.0 | 0.05 | 0.280 | 0–0.250 | Bååth et al. 1991 | ||
| 0–0.080 |
3.2 The first 2 mas of the jet
To be able to describe the structure of the source and check for any structural variations, we have model-fitted with gaussian components the final self-calibrated visibilities of each data set. The criteria adopted to model the source are that the model should be as simple as possible and fit the visibilities with a good agreement factor. As one can see from the images in Figs. 1–8, the source is dominated by the central 2 mas-jet. The weak components which lie along the jet, at a radial distance from the core larger than 2 mas, only marginally affect the best fit between model and data. In other words, these components are not well constrained by the data. Therefore those components are mainly missing from the Tables. Table 3 lists the models for the 22 GHz data sets, Table 4 lists the models for the 43 GHz data sets and Table 5 lists the models for the 22 GHz data sets for baselines shorter than 450 M. The formal errors associated with the positions of each component as derived from the modelfitting procedure are rather small.
A more realistic estimate of the errors comes from independent attempts to model the source. This gave a distribution of positions for each component from which errors have been estimated. For components which are compact compared to the beam size, the errors associated with their positions are estimated to be 10% of the beam. For more extended components, the associated errors are 10% of the full width, half maximum of the gaussian derived from the modelfitting.
Table 3 - Modelfitting 22 GHz data sets
| bj5a | Flux | Radius | Theta | Major | Axial | Phi |
| 12Dec92 | (Jy) | (mas) | (deg) | (mas) | ratio | (deg) |
| 1.95 | 0.80 | 53.2 | 0.36 | 0.59 | 0.0 | |
| 3.45 | 0.41 | 49.9 | 0.36 | 0.58 | 6.5 | |
| 5.90 | 0.19 | 30.4 | 0.29 | 0.46 | 4.1 | |
| 1.47 | 0.26 | 157.2 | 0.30 | 0.46 | 0.0 | |
| 2.46 | 0.37 | 112.2 | 0.47 | 0.39 | 6.4 | |
| 2.64 | 0.98 | 105.4 | 0.48 | 0.45 | 0.0 | |
| 0.30 | 1.88 | 128.2 | 0.27 | 0.51 | 2.4 | |
| 0.93 | 7.11 | 115.7 | 1.70 | 0.29 | 40.9 | |
| 0.14 | 7.30 | 22.2 | 0.26 | 0.56 | 2.9 | |
| bj5b | Flux | Radius | Theta | Major | Axial | Phi |
| 21Dec92 | (Jy) | (mas) | (deg) | (mas) | ratio | (deg) |
| 2.62 | 0.63 | 71.1 | 0.32 | 0.11 | 53.1 | |
| 9.10 | 0.22 | 68.5 | 0.59 | 0.23 | 50.7 | |
| 3.73 | 0.00 | 37.6 | 0.28 | 0.28 | 24.1 | |
| 4.07 | 0.56 | 125.3 | 0.78 | 0.89 | 61.5 | |
| 2.24 | 1.03 | 105.0 | 0.33 | 0.72 | 39.4 | |
| 0.23 | 1.79 | 127.5 | 0.85 | 0.31 | 179.6 | |
| 0.12 | 2.18 | 110.6 | 0.97 | 0.02 | 170.7 | |
| 1.60 | 6.72 | 123.1 | 3.16 | 0.73 | 66.5 | |
| bj5c | Flux | Radius | Theta | Major | Axial | Phi |
| 04Jan93 | (Jy) | (mas) | (deg) | (mas) | ratio | (deg) |
| 1.11 | 0.66 | 78.6 | 0.22 | 0.68 | 68.2 | |
| 8.26 | 0.14 | 68.9 | 0.92 | 0.20 | 49.4 | |
| 4.00 | 0.07 | 4.8 | 0.27 | 0.18 | 119.8 | |
| 2.24 | 0.40 | 122.9 | 0.40 | 0.57 | 1.1 | |
| 2.66 | 1.07 | 105.8 | 0.37 | 0.65 | 56.8 | |
| 0.36 | 7.42 | 123.5 | 1.04 | 0.59 | 54.5 | |
| bj5e | Flux | Radius | Theta | Major | Axial | Phi |
| 23Jan93 | (Jy) | (mas) | (deg) | (mas) | ratio | (deg) |
| 1.84 | 0.70 | 63.02 | 0.40 | 0.37 | 13.6 | |
| 3.79 | 0.45 | 57.69 | 0.34 | 0.21 | 62.9 | |
| 12.36 | 0.03 | 96.32 | 0.42 | 0.70 | 55.6 | |
| 1.65 | 0.46 | 122.95 | 0.54 | 0.11 | 27.0 | |
| 3.85 | 1.05 | 105.76 | 0.52 | 0.59 | 78.9 | |
| 0.40 | 7.28 | 122.79 | 1.24 | 0.57 | 14.1 |
: components are ordered from East to West
Table 4 - Modelfitting 43 GHz data sets
| bj5a | Flux | Radius | Theta | Major | Axial | Phi |
| 12Dec92 | (Jy) | (mas) | (deg) | (mas) | ratio | (deg) |
| 3.24 | 0.50 | 66.9 | 0.33 | 0.46 | 0.0 | |
| 2.98 | 0.13 | 13.1 | 0.35 | 0.56 | 0.0 | |
| 4.18 | 0.20 | 125.9 | 0.62 | 0.56 | 22.1 | |
| 0.63 | 0.83 | 127.9 | 0.38 | 0.53 | 6.8 | |
| 1.25 | 1.16 | 104.0 | 0.43 | 0.47 | 1.6 | |
| 0.06 | 2.27 | 104.9 | 0.24 | 0.73 | 5.8 | |
| 0.13 | 2.75 | 114.0 | 0.33 | 0.42 | 7.7 | |
| 0.12 | 3.53 | 114.1 | 0.46 | 0.45 | 11.5 | |
| 0.17 | 7.37 | 120.5 | 0.53 | 0.47 | 2.6 | |
| bj5b | Flux | Radius | Theta | Major | Axial | Phi |
| 21Dec92 | (Jy) | (mas) | (deg) | (mas) | ratio | (deg) |
| 2.53 | 0.65 | 66.6 | 0.42 | 0.37 | 8.6 | |
| 2.20 | 0.34 | 50.9 | 0.33 | 0.40 | 65.0 | |
| 4.55 | 0.04 | 149.0 | 0.46 | 0.48 | 19.2 | |
| 1.00 | 0.53 | 132.4 | 0.53 | 0.47 | 9.6 | |
| 1.25 | 1.06 | 106.1 | 0.36 | 0.62 | 2.2 | |
| 0.11 | 4.21 | 119.9 | 0.29 | 0.45 | 0.0 | |
| 0.07 | 7.44 | 120.1 | 0.43 | 0.34 | 8.9 | |
| bj5c | Flux | Radius | Theta | Major | Axial | Phi |
| 04Jan93 | (Jy) | (mas) | (deg) | (mas) | ratio | (deg) |
| 1.59 | 0.64 | 69.5 | 0.42 | 0.31 | 2.3 | |
| 0.97 | 0.36 | 63.1 | 0.34 | 0.40 | 6.8 | |
| 3.42 | 0.10 | 165.7 | 0.48 | 0.61 | 3.1 | |
| 0.40 | 0.72 | 134.2 | 0.36 | 0.39 | 8.2 | |
| 0.70 | 1.11 | 110.3 | 0.36 | 0.48 | 0.0 | |
| 0.09 | 3.52 | 117.6 | 0.34 | 0.39 | 6.4 | |
| bj5e | Flux | Radius | Theta | Major | Axial | Phi |
| 24Jan93 | (Jy) | (mas) | (deg) | (mas) | ratio | (deg) |
| 3.03 | 0.71 | 66.0 | 0.20 | 0.94 | 15.9 | |
| 1.89 | 0.40 | 56.1 | 0.30 | 0.40 | 44.1 | |
| 5.71 | 0.02 | 93.8 | 0.34 | 0.89 | 87.5 | |
| 1.31 | 0.65 | 116.6 | 0.70 | 0.58 | 19.9 | |
| 1.04 | 1.15 | 102.1 | 0.47 | 0.86 | 6.0 | |
| 0.23 | 7.44 | 121.9 | 0.92 | 0.40 | 15.5 |
: components are ordered from East to West
Table 5 - Modelfitting of the 22 GHz data sets using baseline length
| bj5a | Flux | Radius | Theta | Major | Axial | Phi |
| 12Dec92 | (Jy) | (mas) | (deg) | (mas) | ratio | (deg) |
| 2.66 | 0.67 | 53.0 | 0.33 | 0.46 | 65.5 | |
| 3.51 | 0.33 | 54.7 | 0.37 | 0.56 | 24.1 | |
| 6.85 | 0.03 | 2.2 | 0.46 | 0.41 | 19.3 | |
| 2.16 | 0.53 | 133.2 | 0.38 | 0.53 | 77.9 | |
| 3.01 | 1.06 | 106.7 | 0.44 | 0.47 | 23.5 | |
| 0.54 | 2.19 | 131.1 | 0.56 | 0.52 | 54.8 | |
| 0.81 | 6.93 | 116.7 | 1.26 | 0.55 | 41.6 | |
| bj5b | Flux | Radius | Theta | Major | Axial | Phi |
| 21Dec92 | (Jy) | (mas) | (deg) | (mas) | ratio | (deg) |
| 1.68 | 0.67 | 73.6 | 0.32 | 0.53 | 42.3 | |
| 7.02 | 0.34 | 58.5 | 0.53 | 0.37 | 60.7 | |
| 7.37 | 0.03 | 162.3 | 0.44 | 0.50 | 18.2 | |
| 3.30 | 0.58 | 123.5 | 0.55 | 1.00 | 0.0 | |
| 2.99 | 1.05 | 104.4 | 0.47 | 0.67 | 13.5 | |
| 0.59 | 7.12 | 124.8 | 0.72 | 0.50 | 57.3 | |
| bj5c | Flux | Radius | Theta | Major | Axial | Phi |
| 04Jan93 | (Jy) | (mas) | (deg) | (mas) | ratio | (deg) |
| 1.84 | 0.65 | 68.4 | 0.34 | 0.63 | 0.0 | |
| 3.55 | 0.34 | 58.7 | 0.41 | 0.59 | 3.1 | |
| 7.18 | 0.00 | 88.5 | 0.50 | 0.49 | 0.0 | |
| 2.91 | 0.38 | 122.4 | 0.41 | 0.45 | 3.1 | |
| 3.00 | 1.04 | 107.0 | 0.62 | 0.56 | 0.0 | |
| 0.20 | 2.76 | 120.7 | 0.43 | 0.49 | 4.5 | |
| 0.20 | 7.20 | 121.6 | 0.47 | 0.44 | 4.1 | |
| bj5e | Flux | Radius | Theta | Major | Axial | Phi |
| 24Jan93 | (Jy) | (mas) | (deg) | (mas) | ratio | (deg) |
| 1.11 | 0.67 | 73.0 | 0.20 | 0.30 | 8.9 | |
| 3.85 | 0.51 | 53.6 | 0.32 | 0.35 | 69.8 | |
| 12.44 | 0.02 | 151.2 | 0.40 | 0.63 | 86.9 | |
| 2.65 | 0.52 | 129.2 | 0.43 | 0.45 | 23.1 | |
| 3.25 | 1.10 | 106.6 | 0.34 | 0.61 | 62.1 | |
| 0.35 | 7.27 | 122.7 | 0.83 | 0.67 | 2.9 |
: components are ordered from East to West
The inner part of the jet of 3C 273 at 43 GHz can be modelled with five compact components. The modelfitting was performed using DIFMAP. The reduced chi-squared, which measures the goodness of the fit, gives values close to 1 (see Pearson 1994). In order to verify the goodness of the models, the following checks were done: (1) to verify that the source structure was actually changing with epochs, each model was used to fit the visibilities of an other data set; in each case, a poor fit was always obtained; (2) each model was used to make a restored map which was compared by eye with the related hybrid image; (3) the ratio between the total flux density from the hybrid images and the flux density obtained adding up the flux density from the individual components in the related model was always close to 1. This last result also suggests that the error estimate associated with the flux density of each component is 10%.
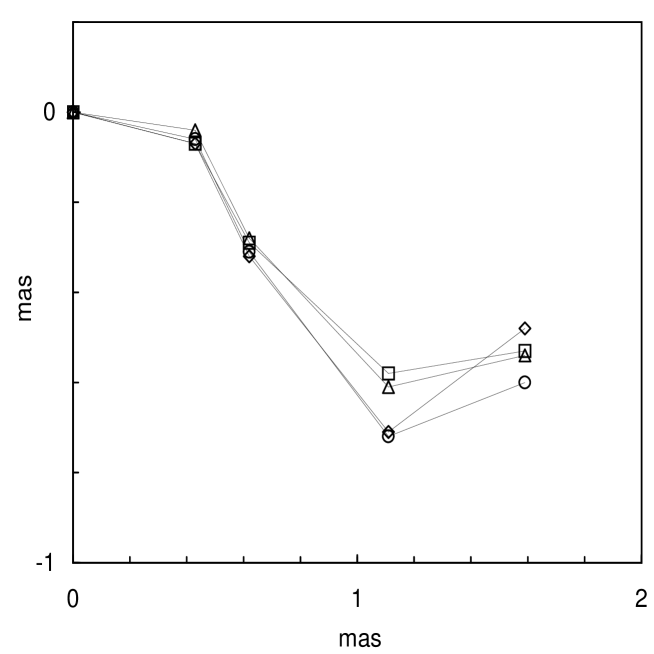
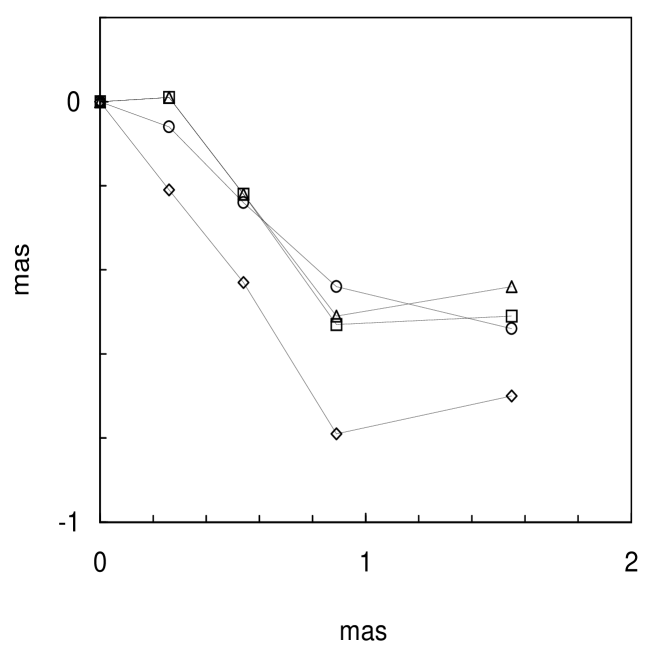
Each components position in polar coordinates has been projected along two orthogonal directions and plotted in Fig. 10. The components have been shifted in such a way that the easternmost components, assumed to be the ’core’, do overlap. It is clear that the components are not collinear and that the PA of the line joining the core with each of the components position changes dramatically, oscillating around a line in PA .
In order to prove if such a structure is real, we have model-fitted the 22 GHz data sets using the visibilities from baselines in the range M to match the resolution to that of the 43 GHz observations in the east-west direction. (At 43 GHz, the resolution was poorer in the east-west direction than at 22 GHz but better in the north-south direction.) As a result, a more sparse coverage of the uv-plane was achieved at 22 GHz. The image is plotted in Fig. 11. The bends along the jet are less evident because of the poorer resolution in north-south of these observations, however, the curved structure is confirmed. The variation in the positions in y-direction between 22 GHz and 43 GHz for each component might be caused by opacity effects. However, we are comparing observations made in the steep part of the spectrum so the displacement could be caused by the relatively sparse coverage of the uv-plane at 22 GHz. The variation of component position as a function of opacity at 22 GHz and 43 GHz in 4C 39.25 was been examined by Alberdi et al. (1997) ; they find no evidence for any displacement.
3.3 Structural variation with time
To look for any short term structural variation of 3C 273, we have plotted the separation from the core with time of the components along the x and y directions (East-West and North-South directions respectively) projecting the polar vectors of the 43 GHz models. The core is labelled component 1, the next component 2, than 3, etc… The results are shown in Fig 12 and Fig 13 respectively. Error bars, 10% of the HPBW are also plotted. In the plot for the x–direction the error bars are of the same size of the symbols used. A line, which represents the best fit, has also been drawn and its correlation coefficient is reported in Table 6. A value of 1 means the maximum for the best fit.
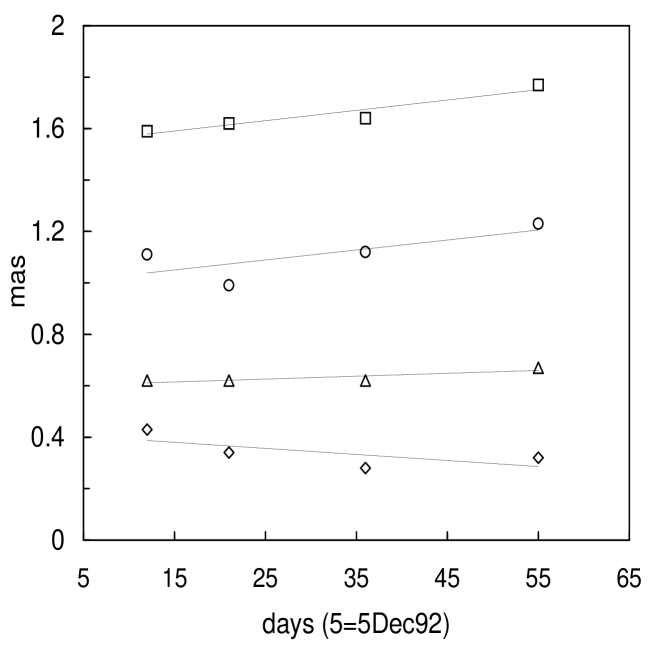
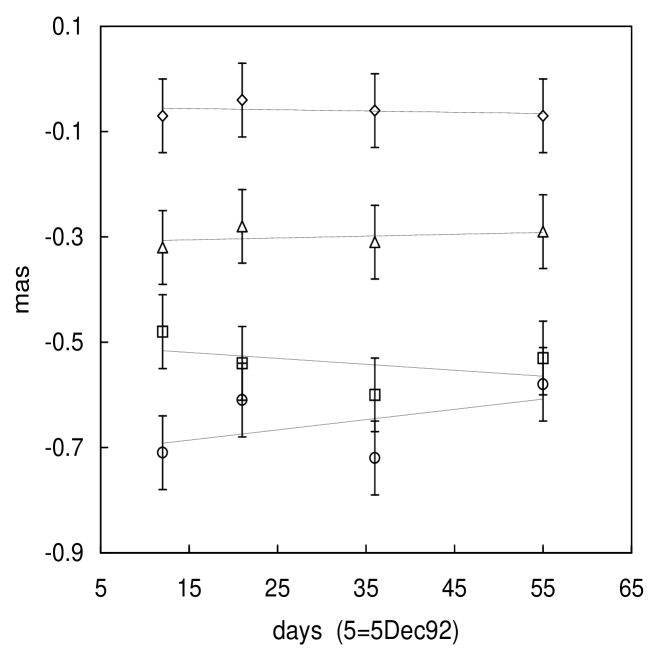
Table 6 - Apparent speed for modelfitting components in 3C 273 at 43 GHz
| Comp. | x-axis | corr. | y-axis | corr. | PA | |
|---|---|---|---|---|---|---|
| mas/yr | coeff. | mas/yr | coeff. | mas/yr | deg | |
| 2 | 0.820.09 | 0.68 | 0.010.08 | 0.32 | 0.820.12 | |
| 3 | 0.420.02 | 0.86 | 0.120.11 | 0.37 | 0.440.11 | 74 |
| 4 | 1.390.12 | 0.75 | 0.740.03 | 0.54 | 1.570.12 | 62 |
| 5 | 1.460.04 | 0.96 | 0.400.02 | 0.41 | 1.510.04 | 105 |
In the x-direction, components 4 and 5 change their separation from the core at the same apparent speed, with values in agreement with previous measurements obtained with observations which had a much larger time sampling. Component 3 has a lower speed, while component 2 shows a separation from the core which decreases with time. The probability given from the reduced chi-square analysis to obtain a similar fit by random is . Such a reverse speed, if real, has not been observed in a superluminal source before.
In the y-direction, where the positional accuracy is lower, we have sufficient resolution to be able to measure the apparent speed of the components. Component 2 seems to be stationary with respect to the core. Components 3 and 4 are moving north with different speeds, while component 5 is moving in a direction opposite to component 4.
In Table 6 the projected velocities, obtained by combining the two velocity components, are given (columns 6 and 7 respectively). The direction of the radial velocity vectors are not parallel to the jet axis, of course, in agreement with the view that the components in 3C 273 are moving along a wiggling path.
3.4 Spectral index of individual components
The observations at 22 GHz and 43 GHz were quasi-simultaneous during the full series of sessions. In order to estimate the spectral indices of the components, we have used the flux densities obtained from model-fitting the source structure. At 22 GHz, the adopted flux densities come from data sets with comparable uv ranges to the 43 GHz observations (i.e.M). The spectral index of each component for each session is shown in Fig. 14.
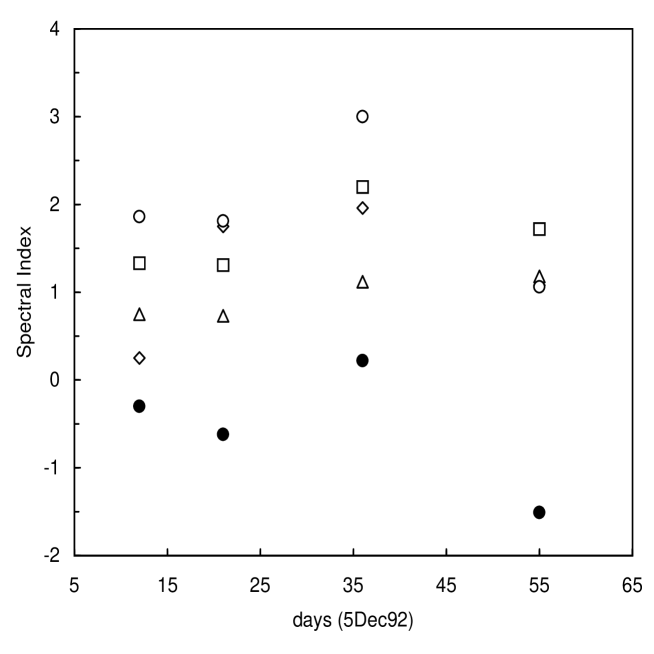
Among the five components, only component 1, believed to be the core of emission, has an inverted spectrum. During the last session, the flux density of the core at 43 GHz is much higher than at 22 GHz and the spectrum more inverted. This might suggest that a new component is emerging from the core itself. All of the components along the jet do show a steep spectrum, which steepens progressivle with distance from the core. The spectral indices (), are in the following ranges: component 1 between 0.2 and 1.5; component 2 between 0.2 and 1.9; component 3 between 0.7 and 1.2; component 4 between 1.1 and 3.0; component 5 between 1.3 and 2.2. These spectral indices are quite steep. This may be because some flux density was lost at 43 GHz because of the better resolution in the north-south direction.
3.5 The jet structure in the region 2 – 8 mas from the core
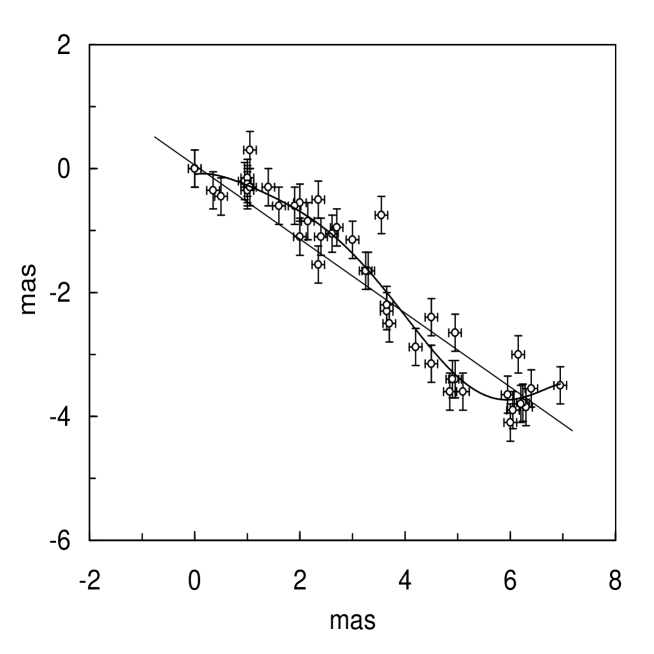
It is difficult to model the weak components in the region from 2 to 8 mas from the core. To visualize the outer part of the jet, the position of the peak of the emission for each blob has been derived from the hybrid maps of Figs. 1–8. As a reference point we have taken the strongest component in the images; this corresponds to component 3 in the model-fitting.
From this we find that, to within the positional accuracy, the components are co-moving with the reference component, i.e. we do not detect any change in separation with time between the reference point and any blob in the outer part of jet during the period of our observations. The position of the peak of emission derived for each component from both the 22 GHz and 43 GHz images is plotted in Fig. 15 together with the estimated errors, weighted by the signal-to-noise ratio of those components. The linear-correlation coefficient obtained by fitting the points with a straight line gives 0.27 which is rather poor. The straight line drawn in Fig. 15 represents the major axis PA of the jet. Obviously, the points lie both above and below that straight line. The second line represents a polynomial, which fits the distribution of the series of data and has a multiple-correlation coefficient very close to 1. The points at 22 GHz and 43 GHz are fully mixed. Independent polynomial fits to the two series of data give almost identical results. We do not see any effects of opacity on the component positions within the accuracy of our measurements. The jet path is not collinear with the major axis and the wiggles, are now clearly tracked. From Fig. 15 we can derive the wavelength of the oscillation, which is 6 mas (or 11 pc).
4 Discussion
The sub-arcsecond scale structure of the radio jet in 3C 273 has been investigated by many authors using radio interferometric observations. In addition to the superluminal motion detected in the core with VLBI at high frequencies, these investigations also show that the ridge-line of the jet shows a ’wiggle’. Davis et al. (1985) were able to track the ridge over the whole 21 arcseconds length of the jet in their 1 arcsecond resolution MERLIN 408 MHz image. They interpret the wiggle in terms of precession in the central object with a period of 15 years, assuming a deceleration in the jet material and an apparent tranverse velocity which equals the superluminal value observed a few mas from the core.
Zensus et al. (1990), combining their 5 GHz VLBI observations with those available in literature, pointed out that the ridge line appears to oscillate around the main orientation of the jet, with major bends apparently being located at about 0.2, 3–4, 10–11 and 15–17 mas from the core. With their investigation Zensus et al. (1990) were also able to track the components loci in one case, suggesting that that component had followed the same path.
Similar results were obtained by Krichbaum et al. (1990) when adding observations at 43 GHz. They were able to track the bending in the inner jet down to 0.5 mas from the core and pointed out that strongly-bent jets in regions close to the core are a common phenomenon — for example, these are seen in 3C 345, 3C 84 and 1803+784.
The image of 3C 273 produced by Bååth et al. (1991) at 100 GHz with a resolution of 50 as shows that the jet has a position angle which is significantly different from those observed at lower frequencies. They claim that the inner structure has a more pronounced wiggling structure than seen on larger scales.
Table 2 summarizes the PAs of the jet major axis in 3C 273 at several angular scales. The differences between PAs suggest that the wiggle can be seen on all angular scales; this suggests that there is a common mechanism responsible for this. From this point of view, the observations presented here add important pieces of information on the inner jet structure of 3C 273. First of all, in the 42 days of monitoring done, we do not detect any dramatic structural variation along the jet. There is a good evidence for jet bending, which starts inside the first parsec from the core. We have also been able to measure the apparent speeds of the inner jet components in orthogonal directions. The values obtained are generally consistent with those available in the literature (i.e. Zensus et al. 1990). Additionally, we find (i) a counter-moving component and (ii) that along the y–axis, there are components which move in opposite direction.
Those behaviours are strong indications for a precessing jet. In fact, the geometry which permits us to see apparent recessional motion in an approaching object requires the object to be moving along a spiral path about an axis close to the observer’s line of sight. Moreover, the tranverse speeds for the outer components are likely to be higher than for the components closest to the core.
Alternatively, it is possible that the ‘core’ of the source is actually component 2. In this case, components 3, 4 and 5 are moving at lower speeds with respect to the core. Component 1 would then be part of the counter-jet. This does not agree with the observation that component 1 is the only one showing an inverted spectral index. Moreover, its apparent speed would be significantly lower than that infreed from these observations
The case for a precessing jet is made stronger by the distribution of the loci of the peaks of emission for the components detected in the region of the jet from 2 to 8 mas. Their quasi-sinusoidal distribution indicates a pattern wavelength of 6 mas. Assuming an apparent tranverse velocity of and using
| (1) |
(Davis et al. 1985), we derive a period T7 years. This value should be considered as an upper limit. It is clear from the model-fitting that the jet starts wiggling even closer to the core. The available resolution is not good enough to derive a firm period for that oscillation.
The derived period is very short compared with that estimated by Davis et al. (1985) and two orders of magnitude shorter than that given by Roos (1988) for active galaxies during their final, most luminous stage. A comparably small value of 22 years was derived for the precessing period of the jet in 3C279 (Abraham et al. 1998).
It is also worth noting that the positions derived from the 22 GHz and 43 GHz images are fully mixed. The fits for the two series of dots are rather similar. Since we are observing in the optically thin part of the spectrum, we would not see any frequency dependence of positions transverse to the jet. This effect would cause the jet to appear more curved at higher frequency due to opacity effects suggested by Zensus et al. (1990). Observations at lower frequencies (in the optically-thick regime) with similar resolution are needed to confirm this definitively.
The source 3C 273 is not the only blazar showing curved trajectories. Sources like 1803784 (Kellermann et al. 1998), 3C 279 (Unwin et al. 1998), 3C 84 (Dawhan et al. 1998), 3C 454.3 (Pauliny-Toth 1998), 0836710 (Otterbein et al. 1998) and 3C 345 (Lobanov & Zensus 1998) do show oscillations in their jet trajectories. The morphology of the last two sources has been explained in terms of Kelvin-Helmholtz instabilities. In 3C 345, the components propagate with constant apparent speed along a helically-twisted trajectory. Hardee (1987) was able to explain this successfully using a model for the helical twisting of a light relativistic jet expanding in response to an external pressure gradient. A similar approch has been used by Otterbein et al. (1998) to explain the displacements in the jet of 0836710. The present observations cannot exclude the possibility that the morphology in 3C 273 can be modelled with Kelvin-Helmholtz instabilities.
An alternative model for the helical path of some relativistic jets, invokes a shock wave propagating along curved trajectories. Such a model has been discussed by Gomez et al. (1993, 1994). In it, the strongest emission is obtained when the shock wave reaches the bent regions towards the observer.
Acknowledgements.
We thank the staffs at the telescopes and at the correlator for their kind collaboration. The National Radio Astronomy Observatory is a facility of the National Science Foundation operated under the cooperative agreement by Associated Universities Inc. The referee is thanked warmly for his many constructive comments.References
- [] Abraham, Z., Carrara, E.A. and Zensus, J.A.: 1998, IAU Colloquium 164: Radio Emission from Galactic and Extragalactic Compact Sources, 1998, APS Conference Series, Vol. 144, pag. 47, Zensus, A., Taylor, G.B. and Wrobel, J.M. eds.
- [] Alberdi, A., Krichbaum, T.P., Graham, D.A. et al. 1997, A&A 327,513
- [] Bååth, L.B., Padin, S., Woody, D. et al. 1991, A&A 241, L1
- [] Bahcall, J.N., Kirhakos, S., Schneider, D.P. et al. 1995, APJ 452, L91
- [] Davis, R.J., Muxlow, T.W.B. & Conway, R.G. 1985, Nature 318, 343
- [] Dhawan, V., Kellermann, K.I. and Romney, J.D.: 1998, IAU Colloquium 164: Radio Emission from Galactic and Extragalactic Compact Sources, 1998, APS Conference Series, Vol. 144, pag. 79, Zensus, A., Taylor, G.B. and Wrobel, J.M. eds.
- [] Gomez, J.L., Alberdi, A and Marcaide, J.M. 1993, A&A 274,55
- [] Gomez, J.L., Alberdi, A and Marcaide, J.M. 1994, A&A 284,51
- [] Hardee, P.E., 1987, APJ 318,78
- [] Kellermann, K.I., Vermeulen, R.C., Zensus, A. and Choen, M.H. 1998 AJ, in press
- [] Krichbaum, T.P., Booth, R.S., Kus, A.J. et al. 1990, A&A 273, 3
- [] Leach, C.M., McHardy, I.M. & Papadakis, I.E. 1995, MNRAS 272, 221
- [] Leppänen, K.J., Zensus, J.A. & Diamond, P.J. 1995, AJ 110, 2479.
- [] Lobanov, A.P. and Zensus, J.A. 1998 APJ, in press
- [] McHardy, I.M., Papadakis, I., Leach, C.M. et al. 1994, in IAU Symposium 159, T.Courvoisier and Blecha eds., pag. 193
- [] Otterbein, K., Krichbaum, T.P., Kraus, A. and Witzel, A.: 1998, IAU Colloquium 164: Radio Emission from Galactic and Extragalactic Compact Sources, 1998, APS Conference Series, Vol. 144, pag. 73, Zensus, A., Taylor, G.B. and Wrobel, J.M. eds.
- [] Pauliny-Toth, I.I.K.: 1998, IAU Colloquium 164: Radio Emission from Galactic and Extragalactic Compact Sources, 1998, APS Conference Series, Vol. 144, pag. 75, Zensus, A., Taylor, G.B. and Wrobel, J.M. eds.
- [] Pearson T.J.: 1994, Very Long Baseline Interferometry and the VLBA, 1994, APS Conference Series, Vol. 82, pag. 267, Zensus, A., Diamond, P.J. and Napier, P.J. eds.
- [] Ross, N.: 1988, Astrophys.Journal 334, 95
- [] Schmidt, M. 1963, Nature 197, 1040
- [] Shepherd, M.C., Pearson, T.J. & Taylor, G.B. 1995, BAAS 26, 987
- [] Tornikoski, M., Valtaoja, E., Teräsranta, H. et al. 1994, A&A 289,673
- [] Unwin, S.C., Wehrle, A.E., Xu, W. et al.: 1998, IAU Colloquium 164: Radio Emission from Galactic and Extragalactic Compact Sources, 1998, APS Conference Series, Vol. 144, pag. 69, Zensus, J.A., Taylor, G.B. and Wrobel, J.M. eds.
- [] von Montigny, C., Aller, H., Aller, M., et al. 1997 483, 161
- [] Zensus, J.A., Unwin, S.C., Cohen, M.H. & Biretta, J.A.: 1990, AJ 100, 1777