XTE J2123–058: A New Neutron Star X-Ray Transient
Abstract
We report on optical and RXTE observations of a new high-latitude bursting X-ray transient, XTE J2123–058. We identified the optical counterpart and discovered a hr periodic optical modulation, which was subsequently shown to be the same as the spectroscopic orbital period. From the absence of orbital X-ray modulation and the presence of partial optical eclipses the binary inclination is between and . From the optical magnitude in quiescence and from the X-ray flux of type I X-ray bursts, the source distance is between 4.5 and 15 kpc, which implies that the source is unusually far from the Galactic plane since . Optical bursts with properties consistent with being reprocessed X-ray bursts occurred.
We detect a pair of high frequency QPOs at Hz and Hz simultaneously. According to the beat frequency model, this QPO separation implies a neutron star spin period of ms. A change in the energy spectrum occurred during the decay of the outburst, which may have been due to the onset of the propeller mechanism. If so, then the neutron star magnetic field strength is between 2 and 8 G for an assumed distance of 10 kpc. However, the changes in the timing and spectral properties observed during the decay are typical of atoll sources, which may indicate that the changes are due solely to the dynamics of the accretion disk.
As the phase averaged V-band magnitude declined from 17.26 at the peak of the outburst to 19.24, and the X-ray flux decreased from erg cm-2 s-1 to erg cm-2 s-1, the peak-to-peak amplitude of the V-band modulation increased from 0.75 to 1.49 magnitudes. This behavior can be explained if the size of the accretion disk decreases during the decay of the outburst.
1 Introduction
The X-ray transient XTE J2123–058 was discovered by the Rossi X-Ray Timing Explorer All-Sky Monitor (RXTE/ASM) on June 27, 1998 (Levine et al. (1998)). X-ray bursts were detected in pointed RXTE observations made on June 27 and June 29 (Takeshima & Strohmayer (1998)), indicating that the system contains a neutron star. Based on the burst profiles and time intervals between bursts, we classify the bursts as type I (Lewin et al. (1995)). If this system is a neutron star low mass X-ray binary (LMXB), as the data suggest, it is unusual because of its high Galactic latitude ().
In this paper, we report on optical and RXTE observations of XTE J2123–058. Our results include the optical identification of XTE J2123–058 (Tomsick et al. 1998a ), the measurement of a 5.9573 hr optical photometric modulation during its outburst (Tomsick et al. 1998b ), which proved to be the binary orbital period (Hynes et al. (1998)), and constraints on the binary inclination. We place a lower limit on the distance from an estimate of the spectral type of the optical companion and quiescent optical observations and an upper limit from the flux of the X-ray bursts. We study the X-ray variability on time scales from 0.008 to 4096 Hz and detect high frequency quasi-periodic oscillations (QPOs), which were also reported by Homan et al. (1998). We derive model dependent estimates of the neutron star spin period and the magnetic field strength of the neutron star. Finally, we study the relationship between the optical and X-ray flux during the decline from outburst to quiescence.
2 Observations
The X-ray flux of XTE J2123–058 during its 50 day outburst is shown in Figure 1. The ASM light curve was produced from data provided by the ASM/RXTE teams at MIT and at the RXTE SOF and GOF at NASA’s GSFC. The peak ASM flux is about 85 mCrab (1.5-12 keV). Five pointed RXTE observations were made during the outburst, and the Proportional Counter Array (PCA) flux measurements for each observation are shown in Figure 1. Table 1 provides information about the pointed observations. We performed spectral and timing analysis of the PCA data.
Figure 1 shows the V-band light curve for the nine nights we observed XTE J2123–058 during the X-ray outburst. Table 2 lists these observations along with an observation made on September 20 after the X-ray outburst. We used the 1.3 and 2.4 meter telescopes at the Michigan-Dartmouth-MIT Observatory (MDM), the 0.9 meter telescope at Kitt Peak National Observatory (KPNO) and the 0.9 meter telescope at Cerro Tololo Interamerican Observatory (CTIO). The exposure times were between 30 and 600 s. The data were reduced using standard IRAF photometry reduction software.
3 Optical Identification and Position
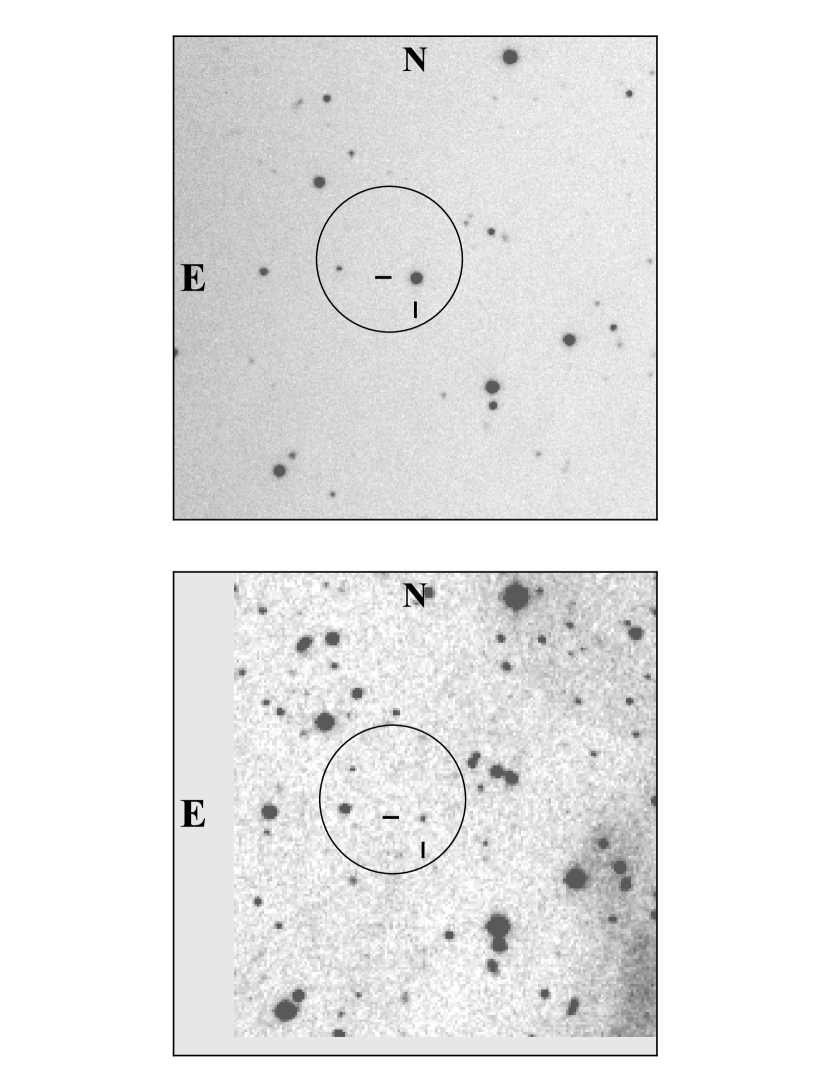
Figure 2 shows two 6′.5-by-6′.5 V-band images of the XTE J2123–058 field. The top image is an average of three 5 minute exposures taken on June 30. We identified the optical counterpart as a star in the 1′ PCA error circle (Takeshima & Strohmayer (1998)) which had brightened to V = 16.9 from its quiescent level near the limiting magnitude, R = 21, of a digitized UK Schmidt Sky Survey plate (Tomsick et al. 1998a ; Zurita et al. (1998)). The bottom image in Figure 2 shows a V-band image of the XTE J2123–058 field taken on September 20 with the source probably in quiescence. We measured the optical position relative to six neighboring stars in the USNO A1.0 astrometric catalog of the Palomar Observatory Sky Survey (Monet et al. (1996)). The position of XTE J2123–058 is R.A. = 21h 23m 14s.54, Decl. = –5∘ 47′ 52.′′9 (equinox 2000.0) with an uncertainty of 1′′ (68% confidence).
4 Optical Light Curve and Determination of the Orbital Ephemeris
During outburst, the XTE J2123–058 optical flux is highly modulated. To determine the period of the modulation, we produced a Lomb periodogram (Press et al. (1992)). A highly significant peak occurs at a period of hr. Figure 3 shows the V-band light curve from July 1 to July 16 folded on this period. From July 1 to July 16, the X-ray and phase averaged optical flux levels were relatively constant, and the mean peak-to-peak amplitude of the modulation was about 0.75 magnitudes. From observations of standard stars made on June 30 (Landolt (1992)), the mean V-band magnitude was 17.27 during this time.
It is likely that the optical modulation occurs because one side of the optical companion is X-ray heated. In this case, high levels of modulation are expected only if the binary inclination is relatively high. Further evidence for high binary inclination comes from the dip in the light curve near an orbital phase () of 0.5, which is probably caused by a partial eclipse of the optical companion by the accretion disk. Zurita et al. (1998) observed partial eclipses at and also at later in the outburst. The photometric period we observe has been confirmed by spectroscopic measurements, which indicates that it is the orbital period of the system (Hynes et al. (1998)).
The light curve for each of six nights was fitted with a sine function and the time of minimum light was found to within d (68% confidence). For each night, the cycle count can be unambiguously determined, and we find that 172 orbits occurred between the first and last minima. The ephemeris was found by fixing the period to the known value and performing a minimization with the time of minimum light as the only free parameter. The orbital ephemeris is HJD () + ()E (90% confidence errors).
5 Binary Inclination
The RXTE data were searched for modulation at the orbital period by folding the light curve for each observation on the orbital period. We do not find evidence for modulation even though the RXTE observations provide complete phase coverage. The absence of modulation puts an upper limit on the binary inclination (). Using the empirical relationship for systems with main sequence optical companions from Patterson (1984), the companion for a 5.9573 hr binary is expected to be a K8 star. In the following, we assume that the spectral type of the optical companion is between M0 and K5. We derive an upper limit on by assuming that the spectral type of the optical companion is M0 or earlier, and the mass of the neutron star is 1.4 M☉. The no-eclipse condition for the neutron star is cos, where is the radius of the optical companion’s Roche lobe, which we derive from the relation given in Eggleton et al. (1983), and is the binary separation. The no-eclipse condition gives . A lower limit on can be derived if we interpret the dip in the optical light curve at as being due to a partial eclipse of the optical companion by the accretion disk. Assuming that a thin accretion disk fills the neturon star’s Roche lobe, the partial eclipse condition is cos, where is the radius of the neutron star’s Roche lobe. If the optical companion’s spectral type is K5 or later, the inclination is greater than 55∘.
6 X-Ray Bursts and Source Distance
The times of the six X-ray bursts observed during the RXTE observations are listed in Table 1, and the light curves for the three brightest bursts are shown in Figure 4. The bursts shown in Figures 4a and 4b were observed during observation 4, and the burst shown in Figure 4c was observed during observation 2. The properties of the observation 4 bursts are considerably different from the four dimmer bursts. Their rise times are 4 s compared to about 15 s for the dimmer bursts, and the observation 4 bursts are double-peaked, which may indicate that they are radius expansion bursts (Lewin et al. (1995)). Since the peak burst luminosity is less than or equal to the Eddington luminosity (), a distance upper limit can be derived. Using equation 4.10b of Lewin et al. (1992) and assuming a neutron star mass of 1.4 M☉ and a neutron star atmosphere with a cosmic abundance of hydrogen gives erg s-1. It should be noted that would be larger for a more massive neutron star or a neturon star atmosphere with a lower hydrogen abundance. We find the peak bolometric flux by producing 1 s energy spectra near the peak of the burst and fitting the spectra with a model consisting of the persistent emission plus a blackbody. For the bursts shown in Figures 4a and 4b, the peak bolometric fluxes are erg cm-2 s-1 and erg cm-2 s-1, respectively, giving a distance upper limit of 15 kpc.
Due to the high Galactic latitude of XTE J2123–058, its distance is of considerable interest. Here, we derive the distance from estimates of the spectral type of the optical companion and the quiescent magnitude of the source. Observations made on August 26/27 gave R= (Zurita & Casares (1998)), and we measured R= on September 20. There was no evidence for X-ray heating of the optical companion during either observation. Since X-ray heating was not observed and the source flux remained constant between August 26/27 and September 20, the source was probably in quiescence. Assuming that the companion is a K8 star (Patterson 1984) and that the quiescent emission is dominated by emission from the optical companion gives V = 22.52 and an absolute V-magnitude of 8.5, from which we derive a distance of 5.5 kpc. In deriving the quiescent V-band magnitude from the quiescent R-band magnitude we use AV = 0.30 and AR = 0.24 to account for extinction (Schlegel et al. (1998)). We note that the derived value for V is consistent with our September 20 V-band measurement. A range of spectral types from M0 to K5 gives a distance range of 4.5 to 9.1 kpc. We consider 4.5 kpc as a distance lower limit since this method underestimates the distance if light comes from the accretion disk in quiescence and conclude that the XTE J2123–058 distance is between 4.5 kpc and 15 kpc. From the distance lower limit and the Galactic latitude, we find that the source must be at least 2.6 kpc from the Galactic plane. This is unusual since the scale height for neutron star LMXB is only 1 kpc (van Paradijs & White (1995)).
Four optical bursts occurred during our observations. On June 30, a burst of at least 0.15 V magnitudes occurred during a 60 s exposure. We observed two bursts during the time from July 1 and July 16, which are shown in Figure 3. One of these bursts produced increases of 0.38 and 0.10 magnitudes for two consecutive 30 s exposures and the other produced a 0.21 magnitude increase during a 60 s exposure. The largest optical burst was observed during the first exposure taken on August 6. As shown in Figure 9, the 120 s burst exposure was 0.47 magnitudes brighter than the following exposures. Although we speculate that these bursts are reprocessed X-ray bursts, there were no simultaneous X-ray observations during any of the optical bursts. To see if the data are consistent with this hypothesis, we compared the energy released during X-ray bursts to that during the optical bursts. For a burst where the V magnitude increases from 16.9 to 16.5 and lasts 30 s, the burst fluence in the V-band is erg cm-2. The X-ray fluence for an average XTE J2123–058 burst is erg cm-2 giving an optical to X-ray burst fluence ratio of . For the persistent emission, we find Lopt/Lx ratios between and . The similarity of the persistent and the burst Lopt/Lx ratios indicates that the optical bursts are likely to be reprocessed X-ray bursts.
7 High Frequency Quasi-Periodic Oscillations
To search for QPOs, we made 0.5-4096 Hz power spectra from the RXTE data. We produced 2 s Leahy normalized power spectra (Leahy et al. (1983)) using the available data in the 2-20 keV energy band. For each RXTE orbit, the 2 s spectra were combined and we looked for QPOs in the combined spectra. For observation 1, it is not possible to carry out this analysis because there are no high time resolution data. We only detect QPOs during observation 3, which confirms the result of Homan et al. (1998). A QPO at Hz is detected during the first orbit of this observation and a QPO at Hz is detected during the second orbit. The errors given in this section are 68% confidence. QPOs are not detected for the other orbits. Fitting the power spectrum with a model consisting of a constant plus a Lorentzian, we find that the 849 Hz QPO has a width (FWHM) of Hz and a fractional rms amplitude of %, and the 1141 Hz QPO has a width of Hz and a fractional rms amplitude of %. F-tests indicate that both QPOs are detected at greater than 99% confidence. QPOs are observed during X-ray bursts from several systems (Strohmayer et al. (1998)). We searched for, but do not detect, QPOs in the brightest two X-ray bursts.
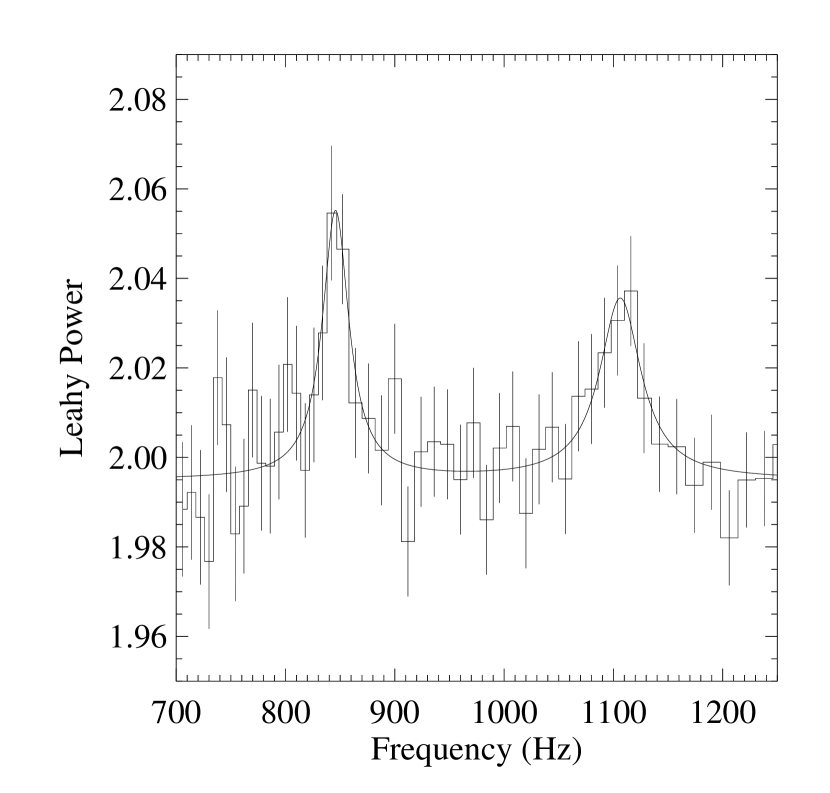
With the detection of kHz QPOs in XTE J2123–058, this source joins a group of 18 other neutron star LMXBs with high frequency QPOs (van der Klis (1998)). For several of these systems, two high frequency QPOs are observed simultaneously. According to the beat frequency model, the QPO with the higher frequency corresponds to the Keplerian frequency at the inner edge of the accretion disk and the QPO with the lower frequency corresponds to the beat frequency between the Keplerian frequency and the spin frequency of the neutron star. In this picture, the difference between the two QPO frequencies is the spin frequency of the neutron star (Alpar et al. (1982)). This interpretation is supported by the fact that, in several sources, the difference between the two QPO frequencies is approximately constant even though the QPO frequencies change (see e.g. Ford et al. (1997)). In addition to the detection of the 849 Hz QPO during the first RXTE orbit of observation 3, there is marginal evidence for a QPO at Hz. The feature is significant at the 86% confidence level. The detection is significant at the 92% confidence level if we use only the last 2240 s of the first orbit data rather than the entire 3344 s. The detection can be further improved to 99% confidence if the 4.6-20 keV energy band is used rather than the 2-20 keV energy band. This is consistent with the result of Homan et al. (1999) that the QPO strength increases with photon energy. Figure 5 shows the 4.6-20 keV power spectrum for the last 2240 s of the first orbit fitted with a model consisting of a constant and two Lorentzians. Both QPOs are detected at greater than 99% confidence. The QPO frequencies are Hz and Hz with fractional rms amplitudes of % and %, respectively. According to the beat frequency model, the observed frequency difference of Hz implies a neutron star spin period of ms. However, we note that the validity of the simple beat frequency model is in question because in some sources the difference between the two QPOs is not constant (van der Klis et al. (1997); Mendez et al. (1998)). In fact, Psaltis et al. (1998) suggest that the QPO separation is not constant for any source with two kHz QPOs.
8 X-Ray Energy Spectra
For the first four RXTE observations, we produced 2.5–20 keV PCA energy spectra using the processing methods described in Tomsick et al. (1998c). For observation 5, the data were processed in the same way except that the background spectrum was estimated using a model for faint sources (Stark et al. (1998)). Only the photons from the top anode layers were used. As described in Tomsick et al. (1998c), Crab spectra were made to test the response matrices. Of the five Proportional Counter Units (PCUs), the response matrix is best for PCUs 1 and 4. Since PCU 4 was off during observation 1 and part of observation 2, the spectral fits were carried out using only PCU 1 in order to avoid instrumental differences between observations. Also, fluxes or spectral component normalizations were reduced by a factor of 1.18 so that the PCA flux scale is in agreement with previous instruments (Tomsick et al. 1998c ). Energy spectra for the persistent emission were produced using data with 16 s time resolution. Time bins which overlap with X-ray bursts as specified in Table 1 were excluded. When the first two observations were made the source had not been optically identified and the source was about 0.2 degrees from the center of the field of view. The June 5, 1996 collimator response was used to correct for this pointing offset.
The spectra were fitted with a power-law model, a Comptonization model (Sunyaev & Titarchuk (1980)) and a model consisting of a blackbody plus a power-law. For each model, the fit was calculated with the column density free and also with the column density fixed to the Galactic value ( cm-2). A power-law alone provides a very poor fit to the first four spectra, but for the fifth spectrum, a power-law with a photon index () of 1.98 provides an acceptable fit ( = 36/45 with the column density free and = 37/46 with the column density fixed). The fits to the first four spectra are improved by using a Comptonization model or a model consisting of a blackbody and a power-law. The fit parameters for these two models are given in Table 3. For the first four spectra, Comptonization models with temperatures () between 2.5 and 3.0 keV and optical depths () between 11 and 14 provide reasonably good fits to the data. For observation 5, the Comptonization model does not provide a better fit than the power-law model, and the Comptonization parameters are very poorly constrained. The column density is consistent with the Galactic value for observation 5 if a power-law or a Comptonization model is used. For observations 2, 3 and 4, F-tests indicate that the spectra require a column density different from the Galactic value at greater than 90% confidence if a Comptonization model is used.
The blackbody plus power-law fits give similar results for the first four spectra, but the fitted parameters are significantly different for observation 5. For the first four spectra with the column density free, the blackbody temperatures are between 1.86 and 1.94 keV, the values for the photon index, , are between 2.5 and 3.1, and the column densities are between 1.3 and 2.6 cm-2. For observation 5, the blackbody temperature is 0.65 keV, , and the column density is consistent with the Galactic column density. For observations 2, 3 and 4, F-tests indicate that the spectra require a column density different from the Galactic value at greater than 99% confidence.
Near the end of the X-ray outburst from Aql X–1 in early 1997, Zhang et al. (1998) observed a sudden change in the hardness of the X-ray spectrum. They interpret the change as the onset of the “propeller” mechanism (Illarionov & Sunyaev (1975)). In this picture, as the mass accretion rate onto the neutron star drops, the size of the neutron star magnetosphere increases until it produces a centrifugal barrier for the accreting material. Zhang et al. (1998) fit the Aql X–1 energy spectra with a model consisting of a blackbody, a power-law and an iron line and find two main changes after the transition: the blackbody temperature decreases and the power-law index becomes harder. For XTE J2123–058, the power-law plus blackbody fit parameters for observations 4 and 5 show a similar change. The energy spectra for observations 4 and 5 fitted with a blackbody plus power-law model with the column density free are shown in Figure 6. Between observations 4 and 5 the blackbody temperature changed from keV to keV (68% confidence errors) and the power-law index changed from to . Assuming that the change is due to the onset of the propeller mechanism, we can estimate the strength of the neutron star magnetic field using equation 2 of Zhang et al. (1998). For this estimate, we assume 1.4 M☉ and cm for the mass and radius of the neutron star. Assuming that the neutron star spin period is 3.92 ms and that the critical X-ray luminosity for the transition is between the observation 4 and 5 levels, the neutron star magnetic field strength is between 2 and 8 G, where is the source distance in units of 10 kpc.
9 Correlated Spectral and Timing Behavior
For observations 2 to 5, we produced 0.008-128 Hz power spectra to study the timing properties of the system. An rms normalized power spectrum was made for each 128 s interval using non-burst data in the 2-20 keV energy band. To convert from the Leahy normalization to rms, we determined the Poisson noise level using the method described in Zhang et al. (1995) with a deadtime of 10 microseconds per event. The background count rates were estimated as described in the previous section. For each of the four observations, the 128 s power spectra were combined and then fitted with a power-law model. For observations 2 and 5, a power-law provides an acceptable fit to the data; however, for observations 3 and 4, we detect excess power above 5 Hz. For observations 3 and 4, the power spectra were fitted with a model consisting of a power-law plus a cutoff power-law. This model has the form
| (1) |
where , , , and are free parameters. For all four observations, the fitted parameters are given in Table 4. Instead of reporting the values for and , fractional rms amplitudes are given for the two components.
During the outburst there were two significant changes in the timing properties of the source. The first change occurred between observations 2 and 3 when excess noise above 5 Hz appeared in the spectrum. For observations 3 and 4, the fractional rms amplitudes (0.01-100 Hz) for the cutoff power-law component are % and %, respectively (68% confidence errors). For observation 2, the 90% confidence upper limit on the fractional rms amplitude of a similar component is 1%. The second change occurred between observations 4 and 5. For observations 2, 3 and 4 the fractional rms amplitudes are between 2.2% and 2.8%, while for observation 5, the fractional rms amplitude is %. The power spectra for observation 2, observations 3 and 4 combined and observation 5 are shown in Figures 7a, 7b and 7c, respectively. Although a power-law provides an acceptable fit for observation 5 ( = 10.7/12), the observation 5 power spectrum was re-fitted with the function given in equation 1. The fitted cutoff power-law parameters are and Hz. The 90% confidence upper limit on the fractional rms amplitude of the cutoff power-law component is 21%.
We made a color-color diagram (CD) to see how the changes in the XTE J2123–058 timing properties are related to its spectral properties. Figure 8 shows the CD, where the ratio of the 3.5-6.4 keV to 2.1-3.5 keV count rates is plotted on the horizontal axis (soft color), and the ratio of the 9.8-20 keV to 6.4-9.8 keV count rates is plotted on the vertical axis (hard color). The source occupied different regions of the CD during the outburst. The CD suggests that XTE J2123–058 should be classified as an atoll source (van der Klis (1995)), and that the source was in the upper banana state (UB) during observations 1 and 2, the lower banana state (LB) during observations 3 and 4 and the island state during observation 5 (van der Klis (1995)). This interpretation is supported by the timing properties of the source during observations 2 to 5. A change from the UB state to the LB state is typically accompanied by an increase in the high frequency noise component (which we characterize using a cutoff power-law). Also, the increase in the rms amplitude we observe between observations 4 and 5 defines the transition from the banana state to the island state. That XTE J2123–058 is an atoll source is not surprising since X-ray bursts are commonly seen in atoll sources.
The timing analysis presented here causes us to question whether the change observed during the outburst decay is related to the onset of the propeller mechanism. Based on its CD and the timing properties during the decay, the behavior of XTE J2123–058 appears to be typical for atoll sources as the mass accretion rate onto the neutron star decreases. It is not clear if the spectral and timing changes are due solely to the dynamics of the disk or due to the interaction between the disk and the magnetosphere. The latter possibility may suggest that the onset of the propeller mechanism causes the change from the banana to the island state in atoll sources. A argument against this is that the X-ray timing properties for black hole systems, where the compact object does not have an intrinsic magnetosphere, are similar to atoll source timing properties (van der Klis (1995)).
10 Relationship between Optical and X-Ray Flux
We observed XTE J2123–058 in the optical at X-ray flux levels from quiescence to erg cm-2 s-1 (1.5-12 keV). Our optical observations provide sufficient phase coverage to study the shape of the optical light curve at three X-ray flux levels. Table 5 gives the mean X-ray flux levels for the period of time between July 1 and July 16, on August 6 and on August 15. The folded optical light curve for July 1-16 is shown in Figure 3, and Figure 9 shows the V-band light curves for August 6 and August 15. For the August observations, we obtained good, but not complete, phase coverage. For July 1-16 and August 6, the X-ray fluxes come from RXTE/ASM measurements. Since the fifth pointed RXTE observation began immediately after our August 15 optical observation, the PCA flux measurement was used.
For each time interval, we fitted the optical light curve with a sine function to determine the V-band magnitude at maximum light () and minimum light (). The modulation amplitude (V(0.5)–V(0.0)) increases as the X-ray flux decreases. This trend was also observed in the R-band by Zurita et al. (1998). To understand this trend, we assume that the optical flux can be separated into a modulated component coming from the optical companion and an unmodulated component coming from the accretion disk. To separate the components, the V-band magnitudes given in Table 5 were converted into flux densities (i.e. erg cm-2 s-1 Hz-1 at Hz) using the relationship given in Table IV of Bessell et al. (1979). A flux density was also determined from the estimated quiescent V-band magnitude of 22.52. To correct for extinction, AV=0.3 was used. The peak contribution to the flux density from the optical companion is given by , where is the V-band flux density at the orbital phase . The contribution to the flux density from the disk is given by , where is the quiescent flux density. The values for and are given in Table 5. From July 1-16 to August 15, decreased by a factor of 10, while only decreased by a factor of 3. In the following, we assume that the optical light comes from X-ray reprocessing in the accretion disk and the optical companion. First, we calculate the expected change in as the X-ray flux drops from its July 1-16 level to its August 15 level, and find that it is consistent with the observed factor of 3. Then, a simplified model of the system is used to understand the physical changes in the system during the outburst decay.
We calculate the X-ray flux from the heated side of the optical companion by determining the temperature, , at each point on the star using equation 1.8 of van Paradijs (1991). Assuming that each surface element emits as a blackbody at the local temperature, the integral over the surface of the star is
| (2) |
where is the ratio of the neutron star radius to the source distance. For a binary at 10 kpc consisting of a 1.4 M☉ neutron star and a K8 star with an X-ray albedo of 0.4 (London et al. (1981)), the July 1-16, August 6, and August 15 X-ray fluxes imply values of erg cm-2 s-1 Hz-1, erg cm-2 s-1 Hz-1, and erg cm-2 s-1 Hz-1, respectively. Although these values are a factor of about 2 higher than the observed values, the ratio between the July 1-16 value and the August 15 value is about 3, consistent with observations. There are several reasons why our calculated values are higher than the observed values. First, to simplify the calculation, we assume a binary inclination () of 90∘. Assuming that is not too much less than the upper limit of 73∘, this correction changes the calculated value by a factor of sin . As stated above, the dip in the light curve near orbital phase 0.5 probably indicates that the accretion disk blocks part of the optical companion at maximum light, but our calculation assumes that we observe the entire optical companion unobstructed. Finally, if the accretion disk is flared at its edge (White & Holt (1982)), the disk may partially shield the optical companion from the X-ray source, reducing the level of X-ray heating.
The values of can be used to understand the evolution of the accretion disk during the decay of the outburst. We assume a spherical X-ray source of radius and a thin, azimuthally symmetric accretion disk extending radially from to and inclined at an angle with respect to the line of sight of the observer. Further, we assume that the V-band emission is dominated by blackbody emission from the accretion disk at a temperature and that the temperature is only a function of the radial coordinate, . Based on UV measurements of other LMXBs, we expect the accretion disk temperature to be high enough so that the V-band lies in the Rayleigh-Jeans portion of the blackbody spectrum (van Paradijs & McClintock (1995)). At a frequency , the flux density is
| (3) |
where is the speed of light, is Boltzmann’s constant and is the distance to the source. If the V-band emission comes from X-ray reprocessing, the temperature can be written as
| (4) |
where is the albedo of the disk. Equation 4 assumes that is much less than . Although we integrate over values of to , this approximation is valid because most of the flux comes from close to . Assuming that is much less than , the V-band flux density from the disk is
| (5) |
where is the X-ray flux in units of erg cm-2 s-1, is the radius of the X-ray source in units of cm, is the outer radius of the disk in units of cm and is the distance to the source in units of 10 kpc. Equation 5 can be used to understand how the geometry of the X-ray source and the disk change during the X-ray decline. Using the values of and from Table 5, cos is equal to 5.8, 2.7, and 1.2 for July 1-16, August 6 and August 15, respectively. Only and are likely to change during the outburst decay. decreases by a factor of 3.6 between July 1-16 and August 15 if is constant during the X-ray decay. If instead we assume that the X-ray flux is proportional to the surface area of the spherical X-ray emitting region (i.e. is proportional to ), then still decreases by a factor of 2.8 between July 1-16 and August 15. We conclude that the outer radius of the accretion disk decreases as the X-ray flux decreases.
11 Summary and Conclusions
We optically identified the neutron star X-ray transient XTE J2123–058, measured its orbital period and constrained the binary inclination. The orbital period is hr and the binary inclination is between 55∘ and 73∘. The properties of the observed optical bursts are consistent with being reprocessed X-ray bursts. The distance to the source is between 4.5 kpc and 15 kpc, indicating that the source is at least 2.6 kpc from the Galactic plane, which is considerably greater than the 1 kpc scale height for neutron star LMXBs. To determine the distance lower limit, we have assumed that all the quiescent optical light comes from a main sequence optical companion.
High frequency QPOs at Hz and Hz are simultaneously detected. According to the beat frequency model, the difference in frequency between the two QPOs indicates a neutron star spin period of ms. During the decay of the outburst, a change in the energy spectrum is observed, which is similar to a change observed in Aql X-1. We speculate that this is due to the onset of the propeller mechanism, indicating that the neutron star magnetic field strength is in the range from 2 to 8 G. However, the changes in the timing and spectral properties observed during the decay are typical of atoll sources, which may indicate that the changes are due solely to the dynamics of the accretion disk.
As the X-ray flux decays, we infer that the V-band flux density from the accretion disk drops by a factor of 10, while the V-band flux density from the optical companion only changes by a factor of 3. Assuming the optical flux comes from X-ray reprocessing in the disk and the optical companion, our calculations show that the V-band flux density from the optical companion is expected to change by a factor of 3 for the observed change in X-ray flux and that the factor of 10 change in the V-band flux density from the accretion disk can be explained if the size of the accretion disk decreases significantly during the decay of the outburst.
Although most of the properties of XTE J2123–058 are typical for neutron star LMXBs, its distance from the Galactic plane is unusual. In the future, it is important to improve constraints on its distance. This can be accomplished from a spectroscopic determination of the spectral type of the optical companion. Also, the low Galactic column density for this system provides a good opportunity to study the soft X-ray properties of a neutron star transient. This will be especially useful for X-ray observations in quiescence (e.g. Rutledge et al. (1998)).
References
- Alpar et al. (1982) Alpar, M.A., Cheng, A.F., Ruderman, M.A. & Shaham, J. 1982, Nature 300, 728
- Bessell et al. (1979) Bessell, M.S. 1979, PASP 91, 589
- Eggleton (1983) Eggleton, P.P. 1983, ApJ 268, 368
- Ford et al. (1997) Ford, E.C. et al. 1997, ApJ 475, L123
- Homan et al. (1998) Homan, J., van der Klis, M., van Paradijs, J. & Mendez, M. 1998, IAUC 6971
- Homan et al. (1999) Homan, J., et al. 1999, ApJ 513, L119
- Hynes et al. (1998) Hynes, R.I. et al. 1998, IAUC 6976
- Illarionov & Sunyaev (1975) Illarionov, A.F. & Sunyaev, R.A. 1975, A&A 39, 185
- Landolt (1992) Landolt, A.U. 1992, AJ 104, 340
- Leahy et al. (1983) Leahy, D.A. et al. 1983, ApJ 266, 160
- Levine et al. (1998) Levine, A., Swank, J. & Smith, E. 1998, IAUC 6955
- Lewin et al. (1992) Lewin, W.H.G., van Paradijs, J. & Taam, R.E. 1992, Space Sci. Rev. 62, 223
- Lewin et al. (1995) Lewin, W.H.G., van Paradijs, J. & Taam, R.E. 1995, in X-Ray Binaries, W.H.G. Lewin, J. van Paradijs & E.P.J. van den Heuvel (Eds.), Cambridge University Press, p. 175
- London et al. (1981) London, R., McCray, R. & Auer, L.H. 1981, ApJ 243, 970
- Mendez et al. (1998) Mendez, M., van der Klis, M. & van Paradijs, J. 1998, ApJ 506, L117
- Monet et al. (1996) Monet, D. et al. 1996, USNO-SA1.0 (Washington, DC: US Naval Observatory)
- Patterson (1984) Patterson, J. 1984, ApJS 54, 443
- Press et al. (1992) Press, W.H., Flannery, B.P., Teukolsky, S.A. & Vetterling, W.T. 1992, Numerical Recipes: The Art of Scientific Computing, Cambridge University Press
- Psaltis et al. (1998) Psaltis, D. et al. 1998, ApJ 501, L95
- Rutledge et al. (1998) Rutledge, R.E. et al. 1998, astro-ph/9810288
- Schlegel et al. (1998) Schlegel, D.J., Finkbeiner, D.P., & Davis, M. 1998, ApJ 500, 525
- Stark et al. (1998) Stark et al. 1998, PCABACKEST, http://lheawww.gsfc.nasa.gov/docs/xray/xte/pca
- Strohmayer et al. (1998) Strohmayer, T., Swank, J. & Zhang, W. 1998, astro-ph/9801219
- Sunyaev & Titarchuk (1980) Sunyaev & Titarchuk 1980, A&A 86, 121
- Takeshima & Strohmayer (1998) Takeshima, T. & Strohmayer, T.E. 1998, IAUC 6958
- (26) Tomsick, J.A., Halpern, J.P., Leighly, K.M. & Perlman, E. 1998a, IAUC 6957
- (27) Tomsick, J.A., Kemp, J., Halpern, J.P. & Hurley-Keller, D. 1998b, IAUC 6972
- (28) Tomsick, J.A., Kaaret, P., Kroeger, R.A. & Remillard, R.A. 1998c, astro-ph/9809098
- van der Klis (1995) van der Klis, M. 1995, in X-Ray Binaries, W.H.G. Lewin, J. van Paradijs & E.P.J. van den Heuvel (Eds.), Cambridge University Press, p. 252
- van der Klis et al. (1997) van der Klis, M., Wijnanads, R., Horne, K. & Chen, W. 1997, ApJ 481, L97
- van der Klis (1998) van der Klis, M. 1998, astro-ph/9812395
- van Paradijs (1991) van Paradijs, J. 1991, in Neutron Stars: Theory and Observation, Ventura, J. & Pines, D. (Eds.), Kluwer Academic Publishers, p. 289
- van Paradijs & McClintock (1995) van Paradijs, J. & McClintock, J.E. 1995, in X-Ray Binaries, W.H.G. Lewin, J. van Paradijs & E.P.J. van den Heuvel (Eds.), Cambridge University Press, p. 58
- van Paradijs & White (1995) van Paradijs, J. & White, N. 1995, ApJ 447, L33
- White & Holt (1982) White, N.E. & Holt, S.S. 1982, ApJ 257, 318
- Zhang et al. (1998) Zhang, S.N., Yu, W. & Zhang, W. 1998, ApJ 494, L71
- Zhang et al. (1995) Zhang, W. et al. 1995, ApJ 449, 930
- Zurita & Casares (1998) Zurita, C. & Casares, J. 1998, IAUC 7000
- Zurita et al. (1998) Zurita, C., Casares, J. & Hynes, R.I. 1998, IAUC 6993


| Observation | Dateaa1998 UT | Exposure Time (s)bbThis is the non-burst exposure time. | Non-Burst Fluxcc1.5–12 keV flux in erg cm-2 s-1 | Burst Start Timeaa1998 UT | Burst Stop Timeaa1998 UT |
|---|---|---|---|---|---|
| 1 | June 27 | 208 | June 27.98471 | June 27.98693 | |
| 2 | June 29 | 3392 | June 29.68425 | June 29.68527 | |
| 3 | July 14 | 19808 | July 14.45280 | July 14.45310 | |
| July 14.50451 | July 14.50487 | ||||
| 4 | July 22 | 25888 | July 22.23787 | July 22.23897 | |
| July 22.50956 | July 22.51042 | ||||
| 5 | August 15 | 16064 | No Bursts Detected | ||
| Date (UT 1998)aaThe date at the start of the XTE J2123–058 observations. | Telescope | Duration (hr) | Exposure Time (s) |
|---|---|---|---|
| June 30.332 | MDM 1.3m | 2.74 | 30-300 |
| July 1.280 | MDM 2.4m | 3.00 | 30 |
| July 1.355 | MDM 1.3m | 0.24 | 120 |
| July 2.314 | MDM 1.3m | 1.90 | 30 |
| July 2.396 | MDM 2.4m | 1.83 | 30-60 |
| July 3.410 | MDM 2.4m | 1.61 | 30 |
| July 4.361 | MDM 1.3m | 2.85 | 30 |
| July 15.253 | KPNO 0.9m | 5.45 | 60 |
| July 16.255 | KPNO 0.9m | 4.70 | 60 |
| August 6.075 | CTIO 0.9m | 3.90 | 120 |
| August 15.124 | CITO 0.9m | 3.92 | 120 |
| September 20.671 | MDM 1.3m | 1.00 | 600 |
| Obs. 1 | Obs. 2 | Obs. 3 | Obs. 4 | Obs. 5 | |
|---|---|---|---|---|---|
| Comptonization | |||||
| kT (keV) | |||||
| FluxccThe unabsorbed 2.5-20 keV flux is in units of erg cm-2 s-1. | 206 | 173 | 99 | 100 | 7.6 |
| NH ( cm-2) | |||||
| 40/44 | 46/44 | 65/44 | 52/44 | 36/44 | |
| ComptonizationbbColumn density fixed to cm-2. | |||||
| kT (keV) | |||||
| FluxccThe unabsorbed 2.5-20 keV flux is in units of erg cm-2 s-1. | 194 | 145 | 95 | 95 | 7.6 |
| 48/45 | 77/45 | 97/45 | 92/45 | 37/45 | |
| Blackbody plus Power-law | |||||
| kT (keV) | |||||
| RBB (in km for =10 kpc) | |||||
| FluxPLccThe unabsorbed 2.5-20 keV flux is in units of erg cm-2 s-1. | 147 | 123 | 77 | 75 | 7.4 |
| NH ( cm-2) | |||||
| 35/43 | 44/43 | 60/43 | 45/43 | 26/43 | |
| Blackbody plus Power-lawbbColumn density fixed to cm-2. | |||||
| kT (keV) | |||||
| RBB (in km for =10 kpc) | |||||
| FluxPLccThe unabsorbed 2.5-20 keV flux is in units of erg cm-2 s-1. | 131 | 96 | 62 | 58 | 7.4 |
| 38/44 | 103/44 | 154/44 | 149/44 | 26/44 | |
| Power-law | Cutoff Power-law | |||||
|---|---|---|---|---|---|---|
| Observation | NbbThe number of 128 s power spectra. | RMS AmplitudeccIn a frequency band from 0.01 to 100 Hz. | (Hz) | RMS amplitudeccIn a frequency band from 0.01 to 100 Hz. | ||
| 2 | 15 | % | 0.6ddFixed. | 27ddFixed. | %ee90% confidence upper limits. | |
| 3 | 143 | % | % | |||
| 4 | 183 | % | % | |||
| 5 | 117 | % | 0.5 | 7 | %ee90% confidence upper limits. | |
| Dates | aaThe 1.5-12 keV flux is in units of erg cm-2 s-1. | V() | V() | AmplitudebbThe optical modulation amplitude is in V magnitudes. | c,dc,dfootnotemark: | c,dc,dfootnotemark: |
|---|---|---|---|---|---|---|
| July 1-16 | 16.90 | 17.65 | 0.75 | 4.13 | 4.16 | |
| August 6 | 17.74 | 18.66 | 0.92 | 1.60 | 2.20 | |
| August 15 | 18.49 | 19.98 | 1.49 | 0.442 | 1.44 | |
| ccfootnotetext: Inferred flux densities at Hz in units of erg cm-2 s-1 Hz-1. ddfootnotetext: AV=0.3 is used to correct for extinction. |