Modeling Dust on Galactic SED:
Application to Semi–Analytical Galaxy Formation Models
Abstract
We present the basic features and preliminary results of the interface between our spectro–photometric model GRASIL (that calculates galactic SED from the UV to the sub–mm with a detailed computation of dust extinction and thermal reemission) with the semi–analytical galaxy formation model GALFORM (that computes galaxy formation and evolution in the hierarchical scenario, providing the star formation history as an input to our model). With these two models we are able to synthetize simulated samples of a few thousands galaxies suited for statistical studies of galaxy properties to investigate on galaxy formation and evolution. We find good agreement with the available data of SED and luminosity functions.
1 Introduction
Dust in galaxies extinguishes starlight and thermally radiates it in the FIR–submm. Observations indicate that a significant fraction of the high–z star formation is hidden in the optical by dust reprocessing as observed in local starbursts. Thus dust shapes the spectral energy distribution (SED) of star forming galaxies as a function of its optical properties and of the geometry of the star–dust distribution, i.e. to infer information on the evolutionary status of galaxies from their spectra, a complex of very uncertain radiative processes connected to dust must be taken into account. A simplified treatment can lead to wrong estimates of fundamental quantities such as the star formation rate (SFR).
To investigate on galaxy formation and evolution we have developed a spectro–photometric model (GRASIL, see Silva et al. 1998 for details and Granato et al., these proceedings) properly computing the radiative effects of dust on starlight, in order to interpret the huge amount of available and incoming data over a 4 decades spectral range.
We present here the application of our model as the observational interface to the Durham group semi–analytical hierarchical galaxy formation model (GALFORM, see Cole et al. 1994, Baugh et al. 1998 for details). Basically, this model calculates the formation and evolution of dark matter halos starting from an assumed cosmology and initial spectrum of density fluctuations, then the process of galaxy formation within these evolving halos is calculated using a set of simple, physically–motivated rules to model gas cooling, star formation and supernova feedback. The output from GALFORM, star formation histories and most geometrical parameters, are used as input by GRASIL to calculate detailed SED for simulated samples of a few thousands galaxies at different redshifts.
In the following sections we outline a brief description of the interface between the two models and some preliminary results of the comparisons with observations. The detailed description will be presented in forthcoming papers (Granato et al. 1999, Lacey et al. 1999).
2 Model interface
Our photometric model GRASIL has been implemented in several ways in order to provide a proper observational interface to the semi–analitycal models. Two aspects required particular consideration:
-
[]
-
1.
In the hierarchical clustering scenario galaxies are built up from sub–units which underwent independent star formation and hence chemical histories before merging to form a galaxy at a given cosmic epoch. Therefore stars in the final object do not have a metallicity univocally determined by their age, as commonly assumed in monolithic one–zone chemical evolution models, but rather a broad distribution for each age (see for instance Fig. 1, where the star formation history of a sample model is shown as a function of time and metallicity).
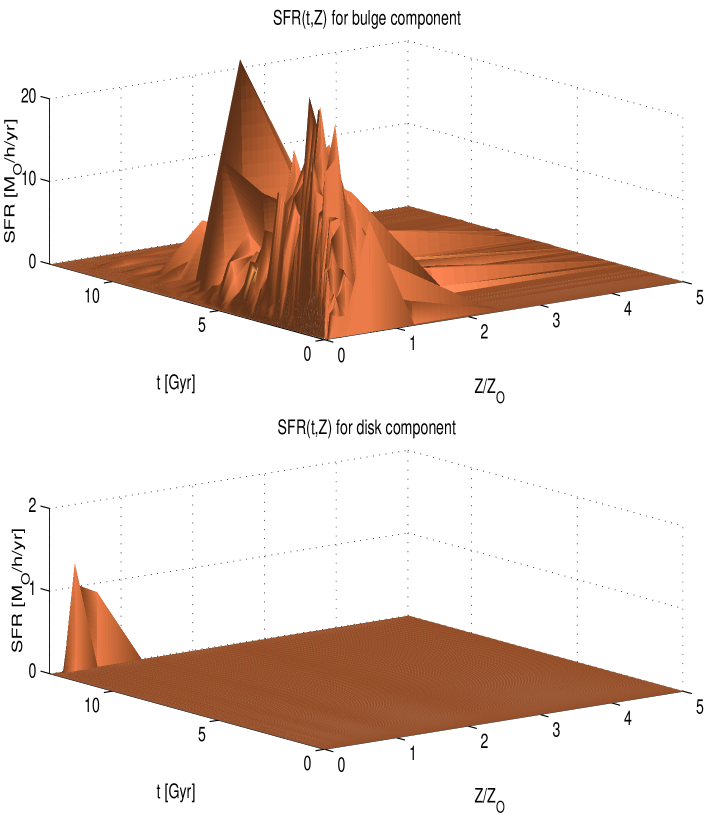
Figure 1: An example of the star formation history calculated by the semi–analytical models: the evolution of the different sub–units merging into a galaxy is represented as a metallicity binned SFR, separately for the components merging into the bulge and disk of the final galaxy. In order to compute the spectra of these composite objects, the semianalytical code provides the evolution of the star–formation rate, , subdivided into 11 logarithmic metallicity bins from log to log in steps of .
Hence we compute the average spectrum of the stellar population born at any galactic time step , , through a weighted mean of the spectra of the single stellar populations (SSP) of age and metallicity , with weights provided by the metallicity binned SFR, as follows:
(1) -
2.
In Silva et al. (1998) we considered systems which are either spheroidal or disk dominated. Now we have to properly describe galaxies of all morphological classes, covering the range of bulge–to–disk ratios yielded by the semi-analytical models in order to reproduce the distribution of morphologies. The semi–analytical model provides the star–formation histories separately for each component (see Fig. 1), we implemented a general composite geometry in which stars and gas are distributed in both a disk–like component and in a spheroidal one.
To properly compute dust extinction and emission in this geometry in a reasonable CPU time we optimized the angular and radial grids that define the galaxy volume elements. Since gas is always in the disk component we adopted a grid suited for disks, finer near the equatorial plane, as a function of the disk flattening, i.e. of the ratio of the disk scale–height to the galaxy radius, . The best radial grid was obtained by merging one suited for bulges, dominating the inner part, with one for disks. Both were obtained by imposing const, with given by a King and an exponential profile respectively. This yields a radial array dependent on scale–radius, with scale–radius equal to core and disk scale–radius.
In summary, with these improvements our model is now multicomponent as far as both the stellar mix as a function of time and the geometry are concerned.
3 Preliminary results
A first check of the model is provided by the direct comparison of the SED of the model galaxy catalogue with observed spectra, as the example shown in Fig. 2 for field face–on galaxies with B/T . For the luminosity and B/T bins where enough data are available the comparison is statistically good and well reproduces the great dispersion of the SED in the IR.
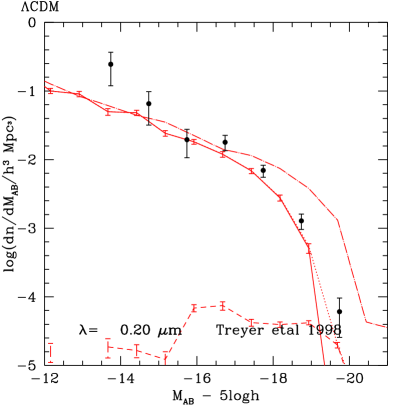
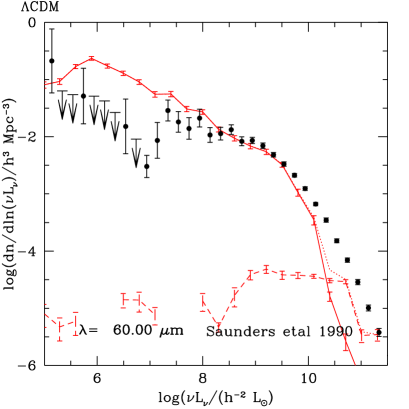
The synthetic luminosity functions (LF) at different wavelenghts of the galaxy catalogue have been computed and compared with observations. The LF at m and m are shown in Fig. 3 and 4 respectively (see captions for explanations). These are computed for certain prescriptions for the cosmology and the star formation. In particular, the deficiency of the m LF at the high luminosity end is to be attributed mostly to the brown dwarfs rich IMF adopted for these models rather than to an underestimate of the UV–optical light dust absorption, since also the m LF is slightly scarce. Another possibility to be checked is that the number of galaxies with ongoing or recent bursts is underestimated in the galaxy catalogue. We are working to explore the range of parameters of GALFORM and GRASIL able to fit all the available observational constraints.

References
- [1] Baugh, C.M., Cole, S., Frenk, C.S., Lacey, C.G., 1998, ApJ, 498, 504
- [2] Cole, S., Aragón–Salamanca, A., Frenk, C.S., Navarro, J.F., Zepf, S.E., 1994, MNRAS, 271, 781
- [3] Granato, G.L., Silva, L., Danese, L., Rodighiero, G., Franceschini, A., Fasano, G., Bressan, A., these proceedings
- [4] Granato, G.L., et al., 1999, in preparation
- [5] Lacey, C.G., et al., 1999, in preparation
- [6] Saunders, W., Rowan–Robinson, M., Lawrence, A., Efstathiou, G., Kaiser, N., Ellis, R.S., Frenk, C.S., 1990, MNRAS, 242, 318
- [7] Silva, L., Granato, G.L., Bressan, A., & Danese, L., 1998, ApJ, 509, 103
- [8] Treyer, M.A., Ellis, R.S., Milliard, B., Donas, J., Bridges, T.J., 1998, MNRAS, 300, 303