1 Introduction
With an infrared luminosity of LL⊙, IRAS 091044109 is one of the most luminous objects detected in the IRAS survey. First identified with a faint, R18 mag, galaxy at by Kleinmann et al.(1988), IRAS 091044109 emits more than of its bolometric luminosity longward of m. Like most Ultraluminous Infrared Galaxies (ULIRGs), IRAS 091044109 has very strong emission lines. The nucleus exhibits a Seyfert type 2 spectrum, with strong, narrow lines over a wide range of ionization (Kleinmann et al.,1988; Soifer et al.,1996). Two–dimensional, ground–based spectrophotometry shows a “plume” of [OIII] emission–line gas extending almost from the nucleus, along with a strong, blueshifted (V km s-1) nuclear component [Crawford & Vanderriest (1996)]. Although the dominant energy source in most ULIRGs is still a matter of some debate, the highly polarized spectrum (), broad ( km s-1), (presumably reflected) MgII emission line, and double–lobed, core–jet radio structure, indicate a quasar at the heart of IRAS 091044109 [Hines & Wills (1993)]. Recent calculations by Hines et al. (1999) suggest that the buried quasar in IRAS 091044109 can account for all of the bolometric luminosity of the system.
What makes IRAS 091044109 unique among ULIRGs, is its environment. While nearly all known ULIRGs are either pairs of interacting, spiral galaxies or post-merger systems, (Armus et al., 1987; Sanders et al., 1988; Lawrence et al., 1989; Murphy et al., 1996), IRAS 091044109 is a cD galaxy at the center of a rich cluster (Kleinmann et al., 1988; Hutchings & Neff 1988). The apparent shape of this cluster is relatively flat (a/b), suggesting a dynamically unrelaxed system. The cD halo of IRAS 091044109 itself extends at least kpc in radius, with a number of “knots” seen in projection, having R mag and RK mag [Soifer et al. (1996)]. The IRAS 091044109 cluster also contains a large reservoir of hot, inter–galactic gas. X-ray observations with the ROSAT and ASCA satellites (Fabian & Crawford 1995) show a resolved source extending over around IRAS 091044109, but having a central “hole” in the emission. The X-ray morphology, and particularly the X-ray spectra, suggest that IRAS 091044109 sits at the center of a cooling flow with a mass deposition rate of as much as M⊙ yr-1.
There are a number of fundamental, un–answered questions concerning IRAS 091044109 which we might hope to address with high–resolution, multi–color imaging. First, what is the source of the gas and dust ? Is it more likely to be the cluster (i.e. the cooling flow), or cannibalized cluster members ? Second, what is the structure of the ionized gas and the stellar continuum on kpc scales ? Can the morphology provide clues as to the excitation and possibly the kinematics in the circumnuclear environment (e.g. sub–structures such as radiating filaments or blue clusters that suggest reflected nuclear light or young stars) ? Finally, how do the small (sub–kpc) and large–scale features relate to the radio jets and the cluster as a whole ? In order to address these questions, we have obtained high–resolution, WFPC2 images of IRAS 091044109 with the Hubble Space Telescope. The results of these imaging observations are described here. Note, that at the redshift of IRAS 091044109, corresponds to a projected linear dimension of 5.07 kpc, for an H km s-1 Mpc-1 and q.
2 Observations and Data Reductions
IRAS 091044109 was observed with the WFPC2 in the F622W, F814W, and FR680N filters. The F622W and F814W filters are broad–band filters with effective wavelengths of Å and Å , respectively. The FR680N filter is a bandpass linear ramp filter. For the F622W and F814W observations, IRAS 09104 4109 was centered on the PC chip. For the FR680N observations, the galaxy was positioned on the WF4 chip at a location corresponding to an effective observed bandpass of Å (Å in the rest frame). At the redshift of IRAS 091044109, the centers of the F622W and F814W bandpasses are close to restframe B, and V, respectively, and the FR680N filter isolates the [OIII] 5007Å emission line. The F622W data consisted of four 1000 second integrations and two 900 second integrations, with the galaxy moved by approximately five PC pixels between successive exposures. The F814W data consisted of four 1000 second integrations, with similar telescope movements between exposures. The FR680N data consisted of two 1300 second integrations. All magnitudes quoted below are on the Vega system.
After standard WFPC2 pipeline processing, all images in a given filter were spatially registered and then combined using the cosmic ray rejection algorithm CRREJ in the NOAO’s IRAF reduction package. The FR680N data were flattened using a WF4 flat field image taken with the F673N, narrow–band filter. A pure [OIII] 5007Å emission–line image was constructed by subtracting a resampled, scaled (in flux) version of the F814W PC image, from the FR680N image, after using the nearby early–type (line–free) galaxies to determine the proper multiplicative flux scale factor.
3 Results & Discussion
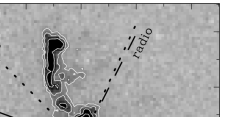
We detect a great deal of structure in the WFPC2 data on sub–kpc scales in the stellar envelope and circum–nuclear regions of IRAS 091044109. The emission–line “plume” previously seen in [OIII] by Crawford & Vanderriest (1996) is resolved into a number of loops and filaments extending over the entire length of the structure ( or 25 kpc – see Figs. 1 and 2). There is an apparent bend, or break, in the plume approximately from the nucleus, and a possible counter–plume at a position angle of about . The plume itself is responsible for approximately of the total [OIII] 5007Å emission–line flux from IRAS 091044109 (f erg cm-2 s-1). Note that the plume seen in the F814W image (Fig. 1 & Fig. 2, top) is entirely consistent with the expected amount of [OIII] emission within the filter bandpass. The primary emission–line plume sits within the scattering cone recently seen in polarized light by [Hines et al. (1999)], but approximately east of the radio jet axis (see Fig. 2, bottom). The northern radio jet sits on the western edge of the scattering cone. Since the plume is at the systemic velocity of IRAS 091044109 and is ionized by a source of hard photons (Crawford & Vanderriest 1996), it is likely that this structure represents gas which is lit up by the mis-directed quasar, and not a radially expanding jet.
Besides the emission–line plume, there are other interesting structures in the IRAS 091044109 WFPC2 data. A number of narrow filaments radiate from the nucleus along a direction nearly perpendicular to the plume axis (see Fig. 2, top). These “whiskers” have lengths of kpc, relatively blue colors (mm mag, or mag bluer than the stellar halo), and are not visible in the [OIII] image. Since these whiskers radiate from the nucleus along directions which are apparently shielded from direct quasar light, they may be associated with gas which is cooling out of the cluster potential and raining down on the nucleus. Alternatively, they may be lit up by the buried quasar through “cracks” in the obscuring torus.
A second set of structures seen in the IRAS 091044109 data, are blue (mm mag) filaments at radii of kpc (see Fig. 2, top). These objects range in size from , or kpc. The nature of these sources is unknown, but they may represent the shredded ISM of late–type cluster members. However, there still appears to be no obvious evidence for strong galaxy–galaxy interactions in the recent past between one or more gas–rich galaxies around IRAS 091044109.
Finally, there are a small number of spheroids within of IRAS 091044109 which are not seen in the ground–based data, and which may be the bulges of cannibalized cluster galaxies. These spheroids have m mag, mm mag, and are all marginally resolved in the PC images, with FWHM pixels ( kpc). These objects are clearly not single, proto–globular clusters, since they are resolved and have high luminosities (the faintest have M mag – comparable to a early–type galaxy like M32). For comparison, the brightest elliptical galaxies in the PC field of IRAS 091044109 have M mag. In general, the spheroids surrounding IRAS 091044109 have the colors and luminosities expected of either (1) star–forming clusters with ages of yrs and star formation rates of M⊙ yr-1, seen behind magnitudes of visual extinction, or (2) massive ( M⊙), aging clusters observed at least yrs after formation, seen behind approximately one magnitude of visual extinction (Leitherer & Heckman 1995).
Clearly, IRAS091044109 has a complex structure down to the resolution limit of the HST. While we can currently only speculate as to the relationships between the various stellar, ionized gas, and non–thermal radio components, high–resolution spectra (i.e. with STIS) should allow us to better fit this unique galaxy into the current ULIRG framework, and understand its relationship to other active galaxies as well.
References
- Armus et al. (1987) Armus, L., Heckman, T.M., and Miley, G.K. (1987), AJ, 94, 831.
- Crawford & Vanderriest (1996) Crawford, C.S., and Vanderriest, C. (1996), MNRAS, 283, 1003.
- Fabian & Craford (1995) Fabian, A.C., and Crawford, C.S. (1995), MNRAS, 274, L63.
- Hines & Wills (1993) Hines, D.C., and Wills, B. (1993), ApJ, 415, 82.
- Hines et al. (1999) Hines, D.C., et al. (1999), ApJ, 512, 145.
- Hutchings & Neff (1988) Hutchings, J.B., and Neff, S.G. (1988), AJ, 96, 1575.
- Kleinmann et al. (1988) Kleinmann, S.G., et al. (1988), ApJ, 328, 161 (K88).
- Lawrence et al. (1989) Lawrence, A., et al. (1989), MNRAS, 240, 329.
- Leitherer & Heckman (1988) Leitherer, C., and Heckman, T.M. (1995), ApJ Suppl, 96, 9.
- Murphy et al. (1996) Murphy, T.W., JR., et al. (1996), AJ, 111, 1025.
- Sanders et al. (1988) Sanders, D.B., et al. (1988), ApJ, 325, 74.
- Soifer et al. (1996) Soifer, B.T., Neugebauer, G., Armus, L., and Shupe, D.L., 1996, AJ, 111, 649.