The Quiescent Accretion Disk in IP Peg at Near-Infrared Wavelengths
Abstract
We present near-infrared, H-band (1.45 - 1.85 m) observations of the eclipsing dwarf nova, IP Peg, in quiescence. The light curves are composed of ellipsoidal variations from the late-type secondary star and emission from the accretion disk and the bright spot. The light curves have two eclipses: a primary eclipse of the accretion disk and the bright spot by the companion star, and a secondary eclipse of the companion star by the disk. The ellipsoidal variations of the secondary star were modeled and subtracted from the data. The resulting light curve shows a pronounced double-hump variation. The double-hump profile resembles those seen in the light curves of WZ Sge and AL Com and likely originates in the accretion disk. The primary eclipse was modeled using maximum entropy disk mapping techniques. The accretion disk has a flat intensity distribution and a cool brightness temperature ( 3000 K) in the near-infrared. Superimposed on the face of the disk is the bright spot ( 10,000 K); the position of the bright spot is different from the observed range of visible bright spot positions. The near-infrared accretion disk flux is dominated by optically thin emission. The secondary eclipse indicates the presence of some occulting medium in the disk, but the eclipse depth is too shallow to be caused by a fully opaque accretion disk.
Subject headings:
accretion, accretion disks — binaries: eclipsing — infrared: stars — novae, cataclysmic variables — stars: individual (IP Peg)1. Introduction
Observations at near-infrared wavelengths (NIR) are well-suited for studying the companion star and the outer accretion disk in cataclysmic variables (CVs) and other compact binaries. The spectral type of the late-type secondary star can be determined from its NIR colors or its absorption line strengths, although both methods usually require an estimate of the contribution of the accretion disk to the near-infrared flux (Berriman et al. (1985); Dhillon & Marsh (1995)). In high-inclination compact binary systems, the NIR light curves typically show ellipsoidal variations from the Roche-lobe shaped secondary star. The ellipsoidal variations constrain the inclination and mass ratio of the binary and, when combined with the observed mass function, place limits on the mass of the primary object, an important means of modeling black hole binary systems (e.g. Haswell et al. 1993, Shahbaz et al. 1994) .
| Table 1: Observations of IP Peg | ||
|---|---|---|
| Date (UT) | Exposures | Integration Time |
| 1993 Sept 4 | 260 | 10s |
| 1993 Sept 5 | 381 | 10s |
| 1993 Sept 7 | 646 | 10s |
| 1994 Sept 28 | 1404 | 5s |
| 1994 Sept 29 | 2346 | 5s |
| 1994 Sept 30 | 2548 | 5s |
| 1994 Oct 25 | 1795 | 5s |
| 1994 Oct 27 | 155 | 5s |
Near-infrared photometry of CVs also probes their accretion disks. The visible and ultraviolet light curves of CVs are dominated by flux from the accretion disk, the white dwarf, and the bright spot where the mass transfer stream impacts the disk. The disk flux seen at these wavelengths emanates predominantly from hotter, inner annuli, the disk/white dwarf boundary layer, and the disk chromosphere. Near-infrared data supplement these shorter wavelength observations by probing the cool disk at larger radii. It is in precisely these regions of the disk, where material accreted from the companion star accumulates in quiescence, that many physical phenomena of interest take place, including the initiation of some dwarf novae outbursts. High-inclination CVs show eclipses of the accretion disk at inferior conjunction of the secondary star; in the near-infrared, secondary eclipses of the companion star by the disk are also seen (Bailey et al. (1981); Sherrington et al. (1982)). Flux-ratio diagrams of near-infrared emission from CVs indicate the presence of both opaque and transparent material in the accretion disk, and show that the fraction of optically thick to optically thin gas varies from system to system (Berriman et al. (1985)). A combination of multicolor NIR light curves and spectra can be used to determine the relative contributions of the secondary star and the accretion disk to the total flux, and the amount of optically thick and optically thin emission from the disk.
In nearly edge-on systems, where the companion star occults the primary star and the accretion disk, the shape of the eclipse contains information on the pattern of emissivity across the disk. Maximum entropy modeling methods have been successfully used at optical and UV wavelengths to construct maps of the accretion disk intensity and determine its radial brightness temperature profile (see Horne 1993 for a review). In dwarf novae in outburst, visible disk maps show brightness temperature () profiles roughly consistent with optically thick, steady-state emission (e.g. Horne and Cook 1985; Rutten et al. 1992). Maps of quiescent dwarf novae, however, show flat profiles and accretion disks that are far from steady-state (Wood et al. (1986); Wood, Horne, & Vennes (1992)). In order to extend multiwavelength modeling of accretion disks, we present the first near-infrared map of a disk, in the cataclysmic variable, IP Peg.
IP Peg is a dwarf nova consisting of a mass-donating, M-dwarf secondary star and an accretion disk around a white dwarf primary star. It undergoes regular outbursts every few months in which it brightens by approximately two magnitudes in the visible. IP Peg has an orbital period of 3.8 hours. With its high inclination, it is one of the few dwarf novae above the period gap with eclipses of the white dwarf, accretion disk and bright spot. Visible eclipse timings have constrained the geometry of the system, although the fits are complicated by blending of the eclipse features due to the bright spot and white dwarf ingress (Wood & Crawford (1986); Wolf et al. (1993)). The large contribution of the bright spot to the eclipse profile has also precluded any quiescent, visible maps of the accretion disk. Szkody & Mateo (1986) observed IP Peg in the near-infrared. They obtained mean J, H and K colors and their light curves show ellipsoidal variations and both primary and secondary eclipses.
In this paper, we present H-band light curves of IP Peg, fits to the ellipsoidal variations of the secondary star, and a map of the accretion disk. Section 2 summarizes the observations and data reduction. Section 3.1 discusses the morphology of the light curves, while Section 3.2 describes modelling the ellipsoidal variations. We describe the eclipse mapping method and present the quiescent disk map in Section 3.3, and consider the dependence of the results on the choice of modeling parameters in Section 3.4. Section 4 discusses the results, and concluding remarks are presented in Section 5.
2. Observations and Data Reduction
We observed IP Peg for three nights in 1993 September and five nights in 1994 September and October using the infrared imaging camera, ROKCAM (Colomé & Harvey (1993)), on the 2.7-m telescope at McDonald Observatory. We obtained 15 hours of H-band data; the observations are summarized in Table 1. IP Peg was in quiescence during the observations; the next outbursts began on 1993 October 25 and on 1994 December 7 (Bortle 1993a ; Bortle (1995)). We observed IP Peg and a nearby field star, located approximately 34 arcseconds to the southwest, and measured the sky background by nodding the telescope in a grid of nine positions.
The data were reduced using the standard IRAF data reduction packages and the DAOPHOT aperture photometry routines. The data initially showed evidence of an instrumental artifact, causing variations of up to mag in both the target and the comparison stars. The variations were correlated with the grid position of the star on the array, which we attributed to a poor match between the dome flats and the actual sensitivity variations across the ROKCAM chip. We removed most of the instrumental signature by applying corrective terms to the calculated instrumental magnitudes. The correction for each grid position and each star was computed from the difference between the mean magnitude of the star and its mean magnitude in a given grid position for each night. We then subtracted the field star magnitude from the IP Peg magnitude in each frame to correct for atmospheric effects.
The shapes of the resulting light curves did not vary appreciably from one night to the next, so we combined the data into three mean light curves: 1993 September, 1994 September, and 1994 October. The individual nights were shifted to have the same mean magnitude before combining (a typical shift of 0.008 mag). The data from 1994 October 27 were not used in the mean 1994 October light curve because IP Peg appeared to be fainter on that night, and with the limited data, it was impossible to determine whether this was real or an instrumental effect. We converted the data from magnitude to arbitrary intensity units and binned them using phase bins equal to 0.5% of the orbital period. We used the Wolf et al. (1993) ephemeris, in which phase zero corresponds to the phase of white dwarf egress. A bin size of 0.005 is equal to a time interval of 1.14 minutes.
We calibrated the data using standard star observations from 1994 September 30 (Elias et al. (1982)). Since only two standard stars were observed, we fit the data using a simple transformation equation with a fixed extinction coefficient and no color terms (Allen (1976)). The mean H magnitude for IP Peg on 1994 September 30 was , a value consistent with previous observations (Szkody & Mateo (1986)). The conversion from magnitude to intensity units was calibrated using a flux calibration of mJy for a zero-magnitude M-dwarf star (Berriman & Reid (1987)). The standard deviation of the mean after flux calibration averaged , , and mJy for 1993 September, 1994 September and 1994 October, respectively. The uncertainties were dominated by systematic effects such as the sensitivity variations of pixels across the array, so we set the error bars in each light curve equal to the mean error. We tripled the error bar on a single bin near primary minimum in the 1994 September light curve ( = 0.0625; see Figure 11), because the deviation of this point from the surrounding points is not real, but a remnant of the instrumental calibration error.
3. Analysis of the Quiescent Light Curves
3.1. Morphology
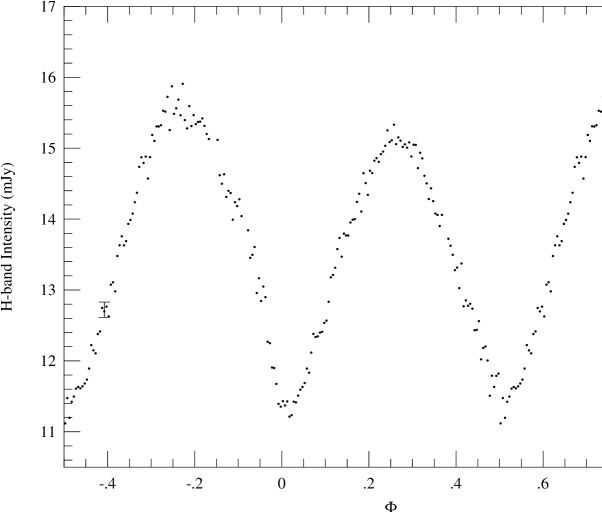
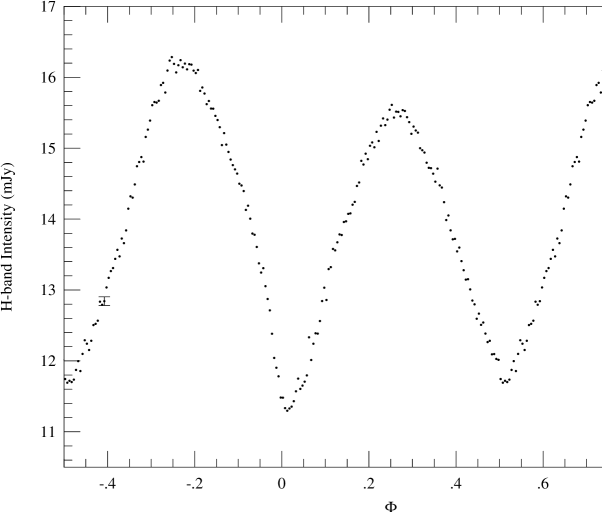
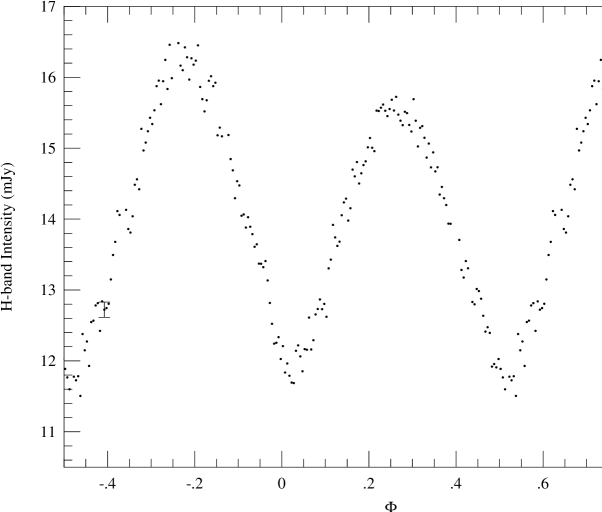
The mean H-band light curves of IP Peg are shown in Figures 1 through 3. Due to the difficulty in measuring the white dwarf ingress in IP Peg, the published ephemeris designates = 0 as the phase of white dwarf egress, but convention – and the maximum entropy modeling program – place the point of zero phase at inferior conjunction of the secondary star. The observed light curves can be shifted to the conventional zero phase using the known width of the white dwarf eclipse (Wood & Crawford (1986)). Due to changes in IP Peg’s orbital period, however, the linear ephemeris is imprecise. As a result, we shifted the light curves by half the white dwarf eclipse width plus an additional amount ( = 0.027) to correct for deviations from the ephemeris. This additional shift was determined while mapping the accretion disk (see Section 3.3) and applied iteratively to the data. The orbital phasing shown in Figures 1 through 3 incorporates this correction.
All three light curves are dominated by what appears to be ellipsoidal variations from the late-type companion star, but it is clear that the secondary star is not the only near-infrared emitter. The peak in the light curve near = 0.75 is greater than the peak near = 0.25; typically, this phenomenon is indicative of beamed emission from the bright spot. The primary eclipse of the accretion disk is visible in the 1993 September and 1994 September light curves. A primary eclipse is probably present in the 1994 October data, but it is less obvious in that light curve. The 1994 September light curve also shows bright spot ingress and egress features (near = 0.9 and 0.1 in Figure 2 and more clearly in Figure 5). The primary eclipse is not deep, suggesting that the integrated flux from the accretion disk in IP Peg is small in the H-band. The second minimum in the data near = 0.5 is caused partially by the ellipsoidal variations, but a secondary eclipse of the companion star by the accretion disk may also be present.
The 1993 September and 1994 September light curves are morphologically similar. The flux at primary minimum is nearly the same, but the 1993 data has smaller peak-to-peak variations, indicating that the accretion disk and/or the bright spot fluctuate in brightness. The 1994 October light curve is significantly different from the September data: the primary eclipse is shallower and the eclipse minimum is shifted to a later orbital phase. The secular variations in IP Peg precluded combining all the data into a single light curve. Since the 1994 September light curve has the best signal-to-noise ratio, we concentrated on modeling it. All further references to the data, unless stated otherwise, refer to Figure 2.
3.2. Modeling the Ellipsoidal Variations
The first step in analyzing the light curve required modeling and removing the contribution of the secondary star. The ellipsoidal variations were modeled using a light-curve synthesis program (Zhang et al. (1986); Haswell et al. (1993)). The program calculates the flux from a Roche lobe-filling secondary star by dividing the surface of the star into a grid. The flux at each grid position is modified to account for the effects of gravity-darkening and limb-darkening:
| (1) |
and
| (2) |
where and are the gravity darkening and linear limb-darkening coefficients, respectively, and are the temperature and surface gravity at the pole of the star, is the intensity emitted normal to the surface of the star, and is the angle between the line of sight and the normal to the surface.
The output of the program is a light curve of flux versus orbital phase in arbitrary flux units. Traditionally, the program has been used to create model light curves by varying the free parameters until the fit to the observed data has been optimized. The free parameters for a model of the secondary star are the mass ratio, , the orbital inclination, , , , and . Since the secondary star is not the only source of modulation in the light curve of IP Peg, we initially fit the model light curve to the data in the orbital phases between = 0.1 and 0.4. We assumed that the flux at these phases consists of the ellipsoidal variations plus a constant disk component, that is:
| (3) |
where is the observed data, is the flux from the secondary star and is the contribution of the accretion disk. The constant term, , scales the modeled secondary star flux to the data. We then solved for and using a least-squares fit to determine the fractional contributions of the secondary star and the disk to the observed data. This method assumed that the uneclipsed disk flux is constant over the observing period and that — consistent with the visible light curves of IP Peg — the bright spot does not contribute to the data at these orbital phases (Wood & Crawford (1986)).
To create the model light curve of the secondary star, , we initially set = 0.49 and = 809, values derived from the visible eclipses of IP Peg (Wood & Crawford (1986)). The spectral type of the secondary star and its temperature were determined from the observed (H-K) color and set to = 3050 K (Szkody & Mateo (1986); Leggett (1992)). The gravity darkening coefficient was set to = 0.05 (Sarna (1989)), and the limb-darkening coefficient was extrapolated from Wade & Rucinski (1985) and set to = 0.30. We also varied the parameters to cover the range of physically permitted models for the secondary star, varying from 0.35 to 0.6, from 895 to 79∘, from 2800 to 3200 K, from 0.2 to 0.5, and from 0.05 to 0.08. We were unable to fit a viable model to the observed data for any of the parameter values. Every fit to = 0.1 to 0.4 generated more modeled flux than observed flux at other orbital phases. This was particularly evident at mid-eclipse, = 0, where the modeled secondary star flux must be equal to or less than the observed flux, and instead was higher. The best fits to Equation 3 for the secondary star models also generated negative, unphysical values for the disk flux, . The failure of the ellipsoidal variations plus a constant disk component to fit the data for = 0.1 – 0.4 demonstrates that an additional, phase-dependent source contributes to the IP Peg light curve in the near-infrared, partly mimicking an ellipsoidal variation.
Since the near-infrared light curve alone is insufficient to constrain the contribution of the secondary star, we abandoned the use of Equation 3 and calculated the model for the ellipsoidal variations using best-guess parameter values obtained from previous visible and near-infrared observations: = 0.49, = 809, and = 3050 K. The model light curve was then scaled to the data at the primary eclipse. The scaling was done iteratively. First, we assumed that the secondary star is the only source of flux at = 0 and set the model flux equal to the observed flux at this phase. After modeling the accretion disk, we determined that 8% of the area of the accretion disk remains unocculted at primary minimum (i.e. the sides of the disk stick out at mid-eclipse). Using the primary eclipse depth (see Figure 6) and assuming a roughly uniform distribution of flux in the disk, we determined that the unocculted disk emits 0.15 mJy at minimum light. Accordingly, we rescaled the model to the observed data assuming 0.15 mJy of unocculted light at primary minimum.
For the final model, we improved the light curve synthesis program via the addition of improved limb-darkening coefficients and specific intensities for the secondary star (). We obtained these parameters using the Allard model atmospheres for cool M dwarf stars (Allard & Hauschildt (1995)). For the secondary star in IP Peg, we assumed T = 3000 K, log g = 4.5, and solar metallicity. The resulting linear limb-darkening coefficient in the H-band is . The limb-darkening profile in the H-band is decidedly non-linear, however, so the limb-darkening equation (Equation 2) was modified to use a quadratic approximation:
| (4) |
where and are the quadratic limb-darkening coefficients. The coefficients were derived from the model atmospheres following the method outlined in Wade & Rucinski (1985) . For IP Peg, the coefficients were = 0.022 and = 0.321. Finally, we tested the effects of including irradiation of the secondary star in the model (assuming a 15,000 K white dwarf; Marsh 1988). The change in the depth of the ellipsoidal dip at = 0.5 was 0.04 mJy, or 0.36%. We neglected the small effect of irradiation to avoid additional model-dependent choices for the temperature of the white dwarf and the albedo of the secondary star.
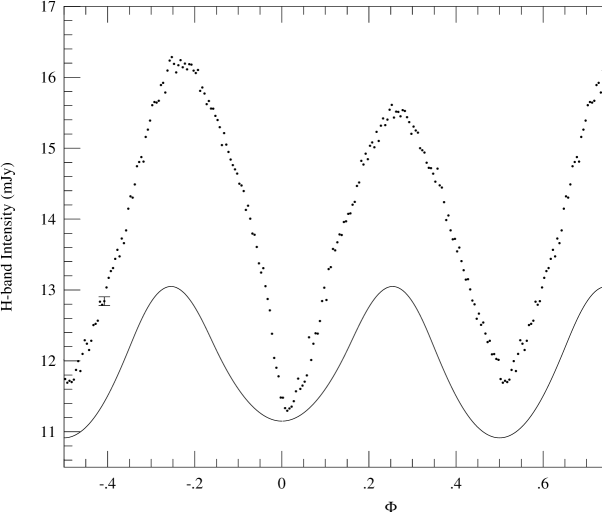
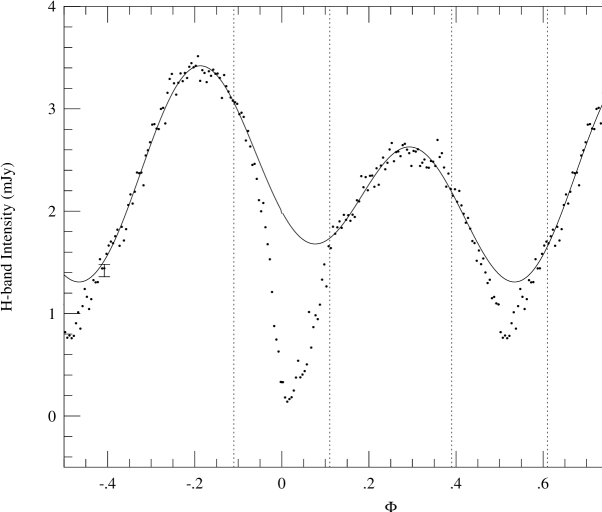
Figure 4 shows the model ellipsoidal variations scaled to the observed data and Figure 5 is the light curve from which the model secondary star flux has been subtracted. The ratio of the mean secondary flux to the mean observed flux shows that the secondary star provides approximately 85% of the observed H-band flux, a value consistent with the estimate in Szkody & Mateo (1986) that the disk contributes up to 20% of the H-band flux. The subtracted light curve has both a primary and a secondary eclipse and shows bright spot ingress and egress features during primary eclipse. The peak in the light curve near = 0.8 is early in phase compared to the visible (where it peaks near = 0.9; Wood and Crawford 1986). The gradual decline from the peak to the start of bright spot ingress is more extended as a result. If the peak is due to beamed emission from the bright spot, its phasing suggests an unusual position for the spot on the disk. The subtracted light curve also confirms the presence of a secondary eclipse of the companion star by the accretion disk.
Unlike the visible data, the near-infrared light curve is not flat after the primary eclipse, and instead shows a second peak. It was this hump which accounted for our failure in fitting the ellipsoidal variations to this region of the light curve. The appearance of the subtracted light curve resembles a double-hump variation such as those seen in the visible light curves of the dwarf novae WZ Sge and Al Com (Robinson et al. (1978); Patterson et al. (1996)). A double-hump variation in IP Peg would account for the early phase position of the hump before primary eclipse, and for the presence of the second hump in Figure 5. This phase-dependent variation may be present in the light curves of other CVs; if so, the double-hump variation may have been confused with the ellipsoidal variations in other binary systems.
3.3. Maximum entropy eclipse mapping of the accretion disk
The accretion disk was modeled using the maximum entropy eclipse mapping program developed by Horne (1985) . The model assumes that a Roche-lobe filling secondary star eclipses a flat accretion disk which lies in the plane of the binary orbit. The maximum entropy method (MEM) divides the surface of the accretion disk into a two-dimensional grid and numerically solves for the intensity distribution that best fits the eclipse data while maximizing the entropy of the model relative to a default map of the disk. The program is iterated repeatedly and the default map regularly updated until the desired quality of fit () is achieved.
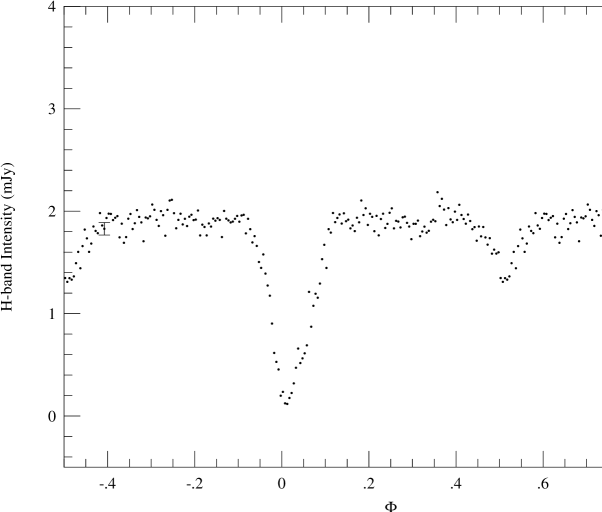
We chose a disk radius equal to = 0.56 based on the variation of the visible bright spot position with time after outburst (Wolf et al. (1993)) and the date of the 1994 September observations relative to the previous outburst. After initial modeling (see below), the disk radius was increased to = 0.6 . The initial modeling also demonstrated that fitting the data to values of 2.0 introduced spurious features in the disk map by fitting flickering in the data. To avoid this, we set the target fit to = 2.0. The maximum entropy program assumes that any variation in the light curve is due to the eclipse, necessitating the removal of all non-eclipse features from the light curve before mapping (i.e. the orbital humps and/or the anisotropic emission from the bright spot). To remove the double-hump variation, we fit a double-sine curve to the data, excepting the regions of the primary and secondary eclipses. The fit is shown in Figure 5. This figure also shows the extent of the primary and secondary eclipses in orbital phase for a disk radius of = 0.6 . The fit was used to rectify the light curve to a constant value outside of eclipse. The rectified light curve is shown in Figure 6; the flatness of the light curve outside of eclipse is evidence that the double-sine curve is a good approximation to the orbital humps in Figure 5.
Usually, the default maps are smoothed azimuthally so that the maximum entropy solution favors the most axisymmetric model to fit the observed data. This has the effect of suppressing azimuthal information in the model accretion disk while the radial intensity distribution remains largely constrained by the data (Horne (1985)). The traditional method of choosing an axisymmetric default map in MEM modeling is ill-suited to eclipses of IP Peg in quiescence, however, because of the dominant contribution of the bright spot to the eclipse profile. We tried many alternative default maps and modeling schemes to determine the best disk map and to test the dependence of the map on the method chosen. Two methods will be discussed in this text:
1. We started with a uniform default map of constant intensity and iterated the program until was reached and the entropy maximized. The default map was not updated while iterating. The resulting disk map is the least model-dependent map possible, but also the least physical, subject to ’crossed-arch’ distortions of compact features in the map (Horne (1985)).
2. We allowed the initially uniform default map to evolve as the disk map converged on a solution. The default map was updated regularly by smoothing the disk map with a Gaussian of width = 0.01 . The constraint of maximizing entropy then suppresses disk structure on scales smaller than , while allowing the data to constrain broad features, producing the smoothest disk map consistent with the data (Horne (1985)).
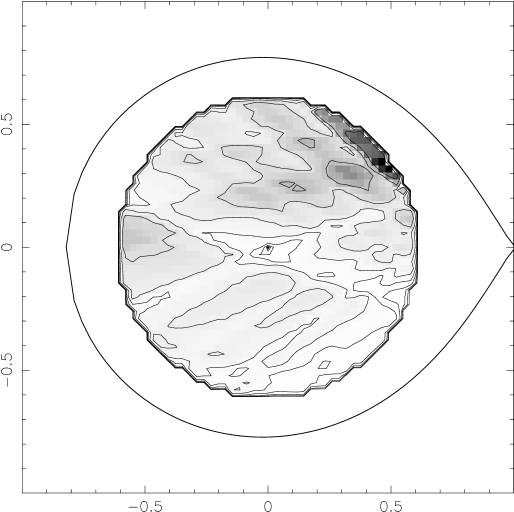

Figure 7 is the contour map of the accretion disk for the flat default map. By assuming blackbody emission at each annulus, we derived the disk’s radial brightness temperature profile, shown in Figure 8. We used a distance to IP Peg of 121 pc, based on the Szkody & Mateo (1986) distance determination but correcting for the variation in the K-band surface brightness with (V–K) (Ramseyer (1994)). We set cm (Wood & Crawford 1986, assuming the intermediate value for the white dwarf boundary layer in Table 4). Despite the distortions present in the map, several features stand out. The accretion disk has a flat radial brightness temperature profile and a bright spot. We found the radius of the spot by creating three disk maps of varying outer disk radius: = 0.56, 0.6 and 0.7 . In the latter two cases, the spot intensity peaked at = 0.47 and = 0.34 . This places the radius of the spot, and thus a lower limit to the disk radius, at 0.58 . This value is larger than the typical radius of the visible spot during this time in quiescence, so the disk map with an outer radius = 0.56 was too small. We subsequently set the disk radius in the maps to = 0.6 . The position of the spot on the disk does not correspond to the range of positions for the bright spot in IP Peg in visible light; nor does it lie along the theoretical mass stream trajectory for material being accreted from the secondary star (the mass stream trajectory is shown in Figure 9; Wood et al. 1989b ).
The disk map in Figure 7 was also used to determine the position of = 0 in the observed light curve. This was done by shifting the light curve in phase until the intensity contours at small disk radii and the central ’crossed-arch’ distortion were aligned with the geometric center of the disk. The corrected time of = 0 was used to calculate the orbital phasing shown in Figures 1 – 3.
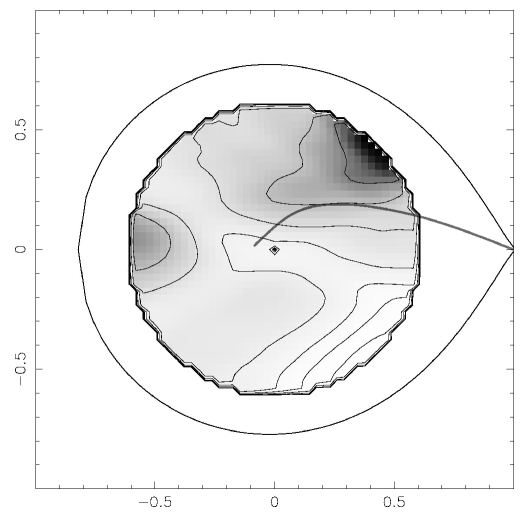

Figure 9 shows the contour map of the accretion disk created using the Gaussian-smoothed default map. Figure 10 is the radial brightness temperature profile for this disk map, and Figure 11 shows the fit of the disk map to the observed light curve. Again, the brightness temperature profile shows that the bulk of the accretion disk has a flat profile with a brightness temperature 3000 K. A bright spot with a peak temperature 10,000 K is located at the edge of the disk. The disk map also shows a region of enhanced intensity in the back of the disk. In some disk maps, a bright region in the back of the disk is caused by an underestimate of the unocculted background flux in the system (Rutten, van Paradijs & Tinbergen (1992)). This is not the case in IP Peg, where alterations in the amount of background light do not affect this region of the disk map. Excess light in the back of the disk has also been indicative of a flare in the opening angles of the disk (Robinson et al. (1995)). It appears more likely that the enhanced emission in the map of IP Peg is an artifact of the maximum entropy constraint, which favors producing the smoothest disk map possible, spreading emission from the bright spot over the disk along lines of constant shadow (Horne (1985)). The disk map also shows a lower surface brightness edge at large radii in the fourth quadrant of the disk in space. The feature is very robust — showing up in every disk map we created — and is dictated by the shape of the observed eclipse.

3.4. Dependence of the results on the modeling parameters chosen.
Many steps in the modeling of the light curve required fixing parameters whose true values are uncertain. Below, we discuss how the modeling results are affected by changes in several key parameter values:
1. The binary geometry, and : The value of the mass ratio in IP Peg, , could range from 0.35 to 0.6, although most observations indicate that 0.49 (Wood & Crawford (1986); Marsh (1988); Wolf et al. (1993)). The inclination is most likely between 79∘ and 81∘. The disk maps we present assumed = 0.49 and = 809. We repeated the entire modeling process for = 0.6 and = 79∘ (Wolf et al. (1993)). The morphology of the double-hump variation and the relative depths and shapes of the two eclipses remained the same in the new light curve, while the peaks in the light curve (near = 0.25 and 0.75) increased by 0.1 mJy. The disk maps consequently showed the same flat brightness temperature distribution and the prominent bright spot seen in Figures 7 and 9. Changing the system geometry did decrease the brightness temperature in the accretion disk from roughly 3000 K to 2000–2500 K, with a slight rise in temperature with disk radius. The peak bright spot temperature declined from 10,000 K to 6000 K, although much of this decline appears to be due to the flux from the spot being distributed across the disk (hence the rise in disk temperature with radius).
2. The orbital ephemeris and choice of = 0: Given the rapid changes in IP Peg’s orbital period and the absence of a white dwarf egress feature in the near-infrared, it is difficult to determine the correct orbital phasing for the light curve. We chose the time of = 0 using the intensity distribution in the accretion disk map. We tested this assumption by shifting = 0 by 0.01 in phase, so that the primary eclipse minimum coincides with inferior conjunction of the secondary star. Moving = 0 causes small changes in the fits of the ellipsoidal variations and double-sine curves to the data and also rotates features in the accretion disk map. The resulting disk map had the same intensity distribution, but the intensity contours were no longer centered on the geometric center of the disk and the spot was rotated closer to the white dwarf–secondary star axis. Even with the rotation, however, the bright spot position did not coincide with the visible bright spot position or with the theoretical mass stream trajectory.
3. Fitting the ellipsoidal model to the data: We scaled the model ellipsoidal light curve to the data by assuming that 8% of the accretion disk flux in Figure 6 was unocculted at primary minimum. Since the bright spot is a significant source of flux in IP Peg, the assumption of uniform disk emission is not strictly true (see Figure 9); however, 0.15 mJy of background light is a good estimate, and changing the background light by up to 0.05 mJy did not affect the results. Larger changes in the background light (either by eliminating it or by adding large amounts of extra flux) showed up as artifacts in the disk maps, in particular as light being removed from or added to the edges of the disk, which remain unocculted at primary minimum.
4. Fitting and removing the double-hump variation: Subtracting the double-sine fit across the primary eclipse (Figure 5) introduces uncertainty in interpreting the subsequent disk maps. Without knowing the source of the double-hump variation, and in particular if it is wholly or partially an anisotropic emitting source, it is difficult to determine the shape of the rectification across the primary eclipse. To test the dependence of the models on the shape of the fit across the eclipse, we repeated the disk mapping procedure after using a straight line drawn between the beginning and end-points of the eclipse to rectify the light curve. The resulting accretion disk map was unchanged, with the exception of a slightly lower peak bright spot temperature (from 10,000 K to 9000 K) and a larger spot extent on the face of the disk.
5. The white dwarf: Throughout the modeling, we ignored the contribution of the white dwarf to the H-band flux. Marsh (1988) states that the temperature of the white dwarf is less than 15,000 K, and that it contributes less than 0.2 mJy in the visible. We used the light curve synthesis models (discussed in Section 3.2) to estimate that a 15,000 K white dwarf would contribute approximately 0.08 mJy to the H-band flux, a small, but not undetectable, amount (geometric parameters for the white dwarf came from Wood & Crawford 1986). The light curves showed no evidence of white dwarf egress features, however, and the accretion disk maps did not add light to small disk radii, as would be expected for unaccounted–for white dwarf flux. This suggests that the white dwarf may be much cooler than the upper limit of 15,000 K.
The alternate modeling methods discussed above demonstrate that key features in the accretion disk map of IP Peg are robust: the flat intensity distribution in the disk, the unusual location for the bright spot, and the brightness temperatures of the accretion disk and bright spot are relatively unaffected by changes in the modeling parameters used.
4. Discussion
Figure 5 shows the H-band light curve of IP Peg after the ellipsoidal variations of the secondary star have been removed. There is a double-peaked component to the light curve that mimics but cannot be attributed to the ellipsoidal variations. This orbital modulation is not apparent in the visible light curves of IP Peg, which are flat following primary eclipse. The peak before primary eclipse also occurs at an earlier phase in the NIR than in the visible. While the visible peak is typically attributed to anisotropic beaming from the bright spot, the early phase position of the peak in the near-infrared implies an additional contribution from the double-hump source.
The variation may originate in any of the cool emitters seen in the near-infrared: the accretion disk, the bright spot, or the secondary star. Star spots caused by magnetic activity have been observed on late-type stars and may preferentially occur at the inner Lagrangian point in binaries (Ramseyer, Hatzes, & Jablonski (1995); Livio & Pringle (1994)). A star spot at the inner Lagrangian point in IP Peg could contribute to the depth of the light curve at secondary minimum ( = 0.5), although a second persistent spot on the opposite side of the star would also be necessary to create the observed double-humped variation.
The morphology of the variation observed in IP Peg most strongly resembles the double-hump profile seen in the quiescent, visible light curves of WZ Sge and AL Com, two dwarf novae with extremely short orbital periods. In these two systems, the double-hump variation appears to originate in the accretion disk. In WZ Sge, for example, the secondary star is virtually invisible even in the near-infrared, and cannot be the source of the strong variability (Dhillon (1998)). A double-hump variation is also present in both systems during the early days of outburst (after which the more common superhumps are seen), again pointing to a disk origin for the variability (Patterson et al. (1981, 1996); Kato et al. (1996)). Models of the double-hump profile in WZ Sge and AL Com have included attributing it to the bright spot being visible on both the near and far sides of the accretion disk, or to a spiral dissipation pattern in the disk caused by a 2:1 resonance instability (Robinson et al. (1978); Patterson et al. (1996)). Observations of visible continuum emission in IP Peg have shown a second hump in the light curve, which may be caused by the bright spot shining through the disk (Wolf et al. (1998)). Recent visible spectra of IP Peg on the rise to outburst and in quiescence have also indicated the presence of multiple bright emission sites in the accretion disk, which could be due to spiral structure in the (outbursting) disk or to a second bright spot from mass-stream overflow (Steeghs et al. (1997); Wolf et al. (1998)).
The presence of the double-hump variation in the NIR light curves of other CVs cannot be discounted, particularly since the phenomenon may be inadvertently attributed to ellipsoidal variations from the secondary star. It is possible that the contribution of the secondary star to the light curve could be estimated incorrectly, affecting determinations of the absolute magnitudes for the secondary star and the accretion disk. Ellipsoidal variations have also been used to constrain the values of and in other compact binaries. When these values are used to determine the mass of the primary object, such as in black-hole binaries, the presence of a variable disk contribution to the light curve can significantly alter the calculated results (cf. Sanwal et al. 1995, Shahbaz et al. 1996).
The contour map of the quiescent accretion disk in IP Peg (Figure 9) shows that the disk has a flat surface brightness distribution. The prominent feature is the bright spot. The location of the bright spot on the disk is unusual. It does not correspond to the range of positions of the bright spot in the visible nor to the theoretical trajectory of the mass stream from the secondary star (shown in Figure 9). The near-infrared bright spot is located at a larger azimuth than the spot seen at visible wavelengths (where azimuth is measured relative to the line between the secondary star and the inner Lagrangian point); and it is at a larger disk radius than is usually seen at this time in quiescence in the visible, although disk radii this large have been seen in visible measurements at times soon after outburst (Wolf et al. (1993)). The disk map also has a lower-intensity edge at large radii in the part of the disk facing the inner Lagrangian point in Figure 9. It is unclear why this occurs, but the feature is robust and unaffected by the method used to create the disk map or the system parameters chosen.
Except for the spot and turned-down edge, the brightness temperature of the disk (Figure 10) is flat and clearly deviates from the law for a steady-state disk. In this respect, it resembles the quiescent disk maps of the other eclipsing dwarf novae, Z Cha, OY Car, and HT Cas, at visible wavelengths (Wood et al. (1986); Wood et al. 1989a ; Wood, Horne, & Vennes (1992)). The profile of IP Peg is even flatter than in these systems, however, and the brightness temperature is lower as well. The effect could be caused by differing opacities in different wavebands, or the brightness temperature in the visible (where the disk in IP Peg has not been mapped) may be lower in IP Peg than in the other eclipsing dwarf novae. Temperatures as low as 2500 K have been seen in OY Car soon after an outburst; the disk becomes steadily warmer during quiescence (Wood (1986)). The observations we modeled were taken a month after the previous outburst of IP Peg (Bortle 1993b ), so the low temperatures observed are not likely to be caused by a similar phenomenon. The flat, non-steady state brightness temperature profiles seen in these quiescent CVs provide more support for the disk instability model of normal dwarf novae outbursts, in which an outburst is caused by a thermal limit cycle instability in the accretion disk (e.g. Cannizzo 1993).
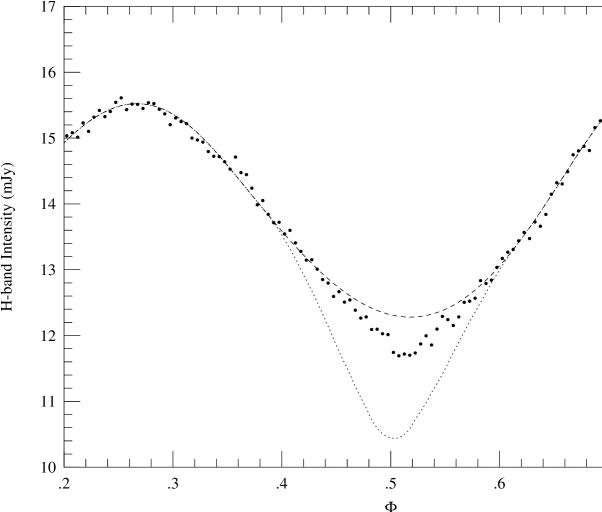
The presence of the secondary eclipse in the near-infrared light curves limits the interpretation of the models of the primary eclipse. The secondary eclipse indicates that the accretion disk is occulting some of the flux from the secondary star, so the observed near-infrared disk flux cannot completely originate in an optically thin disk. The secondary eclipse is too shallow to be caused by a fully opaque disk, however. We tested the expected depth of the secondary eclipse for an optically thick accretion disk by allowing a dark, opaque disk to occult the secondary star (using the light curve modeling code discussed in Section 3.2). For an accretion disk radius of = 0.6 , the secondary hump at = 0.5 would be 1.85 mJy deeper than it is without the secondary eclipse; the effect of adding the secondary eclipse is shown in Figure 12. This depth is much larger than the dip at = 0.5 in Figure 5, even before the double-sine fit is subtracted. A smaller disk radius of = 0.56 (the original guess based on visible observations) occults 1.7 mJy at secondary eclipse, still too deep to be consistent with the observed hump at = 0.5. The shallow secondary eclipse also rules out a two-phase accretion disk (an opaque, cool disk with a hot, optically thin chromosphere), unless the size of the opaque disk is smaller than the disk radius inferred from the observed visible and near-infrared bright spot positions.
The shallow secondary eclipse shows that optically thin emission dominates the observed H-band flux from most of the disk in IP Peg. This result is consistent with the near-infrared colors of IP Peg, which, when plotted on a flux-ratio diagram point to a strong optically thin component to the flux (Szkody & Mateo (1986); Berriman et al. (1985)). The distribution of the transparent and opaque gas is unclear, however. The disk emissivity could be patchy. In particular, while the accretion disk is primarily optically thin, the bright spot emission is probably optically thick because its brightness temperature is greater than 10,000 K, and is near the temperature of the spot determined from visible observations (Marsh (1988)).
The effective temperature of the accretion disk is a more complex issue. For a one-phase disk, either completely opaque or transparent, the radial brightness temperatures in Figure 10 give a rough lower limit to the effective temperature of the disk. For a transparent disk, the brightness temperature is likely to be a severe underestimate of the actual disk temperature. Since the secondary eclipse in IP Peg is too shallow to allow for an opaque accretion disk, models for the quiescent disk which have temperatures of 5000 – 6000 K (and are optically thin) are more consistent with the data than models which invoke a cold ( 2000 – 3000 K), optically thick disk.
The 1993 September and 1994 October light curves were too noisy to model. It is clear, however, particularly from the variations in the shape of the light curves in the month from 1994 September to October, that parameters in the accretion disk in IP Peg—the amplitude of the double-hump variation, and the temperatures and densities in the disk and the bright spot—vary over the course of the quiescent cycle. As a result, additional and repeated modeling of the double-hump variation and both eclipses would better resolve the optical depth and temperature of the quiescent disk in IP Peg. Future work should also include simultaneous, multicolor eclipse maps in the near-infrared to further constrain the optical depth and temperature of the disk by probing how the NIR colors vary throughout the binary orbit.
5. Conclusions
1. The quiescent H-band light curve of IP Peg contains contributions from the late-type companion star, the accretion disk and the bright spot, as well as a primary eclipse of the accretion disk and a secondary eclipse of the companion star. The characteristic ellipsoidal variations from the secondary star dominate the light curve, but the amplitude of the variation is not enough to account for all of the orbital modulation seen in the light curve outside of eclipse.
2. The light curve after the model secondary star flux has been subtracted shows a phase-dependent, double-hump profile reminiscent of the quiescent light curves of WZ Sge and AL Com. In these two systems, the double-hump variation is believed to originate in the accretion disk. The presence of a double-hump variation in the near-infrared light curves of other compact binaries may complicate determinations of the relative flux contributions of the accretion disk and the secondary star.
3. The primary eclipse was modeled using maximum entropy eclipse mapping techniques. The bulk of the disk has a flat surface brightness distribution and a cool brightness temperature ( 3000 K). There is a prominent bright spot on the edge of the disk ( 10,000 K). The position of the near-infrared bright spot is not the same as the position of the theoretical mass stream trajectory or the range of measured visible bright spot positions in IP Peg.
4. The flat radial brightness temperature distribution of the accretion disk is consistent with those of other eclipsing dwarf novae in quiescence, although the near-infrared disk in IP Peg is both flatter and cooler than in the other systems. The flat intensity distribution is consistent with the quiescent, non-steady-state behavior predicted by the disk instability model of normal dwarf novae outbursts.
5. The secondary eclipse of the companion star indicates that some occulting material is present in the disk, but the eclipse depth is too shallow to allow for an opaque accretion disk. The disk emissivity could be patchy. In particular, while optically thin emission dominates the H-band flux, the bright spot is probably optically thick with a temperature around 10,000 K. The temperature of the bulk of the accretion disk depends on its optical depth, but is probably higher than the brightness temperature.
References
- Allard & Hauschildt (1995) Allard, F., & Hauschildt, P. H. 1995,ApJ,445,433
- Allen (1976) Allen, C. W. 1976, Astrophysical Quantities (New Jersey: The Athlone Press),3rd edition
- Bailey et al. (1981) Bailey, J., Sherrington, M. R., Giles, A. B., & Jameson, R. F. 1981,MNRAS,196,121
- Berriman & Reid (1987) Berriman, G., & Reid, N. 1987,MNRAS,227,315
- Berriman et al. (1985) Berriman, G., Szkody, P., & Capps, R. W. 1985,MNRAS,217,327
- (6) Bortle, J. E. ed., AAVSO Circular 1993a, No. 277, AAVSO
- (7) Bortle, J. E. ed., AASVO Circular 1993b, No. 287, AAVSO
- Bortle (1995) Bortle, J. E. ed., AAVSO Circular 1995, No. 291, AAVSO
- Cannizzo (1993) Cannizzo, J. K. 1993, in Accretion Disks in Compact Stellar Systems, Vol. 9, Advanced Series in Astrophysics and Cosmology, ed. J. C. Wheeler (Singapore: World Scientific Publishing Co. Pte. Ltd.),6
- Colomé & Harvey (1993) Colomé, C., & Harvey, P. M. 1993,Rev. Mex. de A. y A.,27,99
- Dhillon (1998) Dhillon, V. 1998, in Wild Stars in the old west: proceedings of the 13th north american workshop on cataclysmic variables and related objects, Vol. 137, ASP Conference Series, eds. S. Howell, E. Kuulkers, & C. Woodward,Astronomical Society of the Pacific,132
- Dhillon & Marsh (1995) Dhillon, V. S., & Marsh, T. R. 1995,MNRAS,275,89
- Elias et al. (1982) Elias, J. H., Frogel, J. A., Matthews, K., & Neugebauer, G. 1982,AJ,87,1029
- Haswell et al. (1993) Haswell, C. A., Robinson, E. L., Horne, K., Steining, R. F., & Abbott, T. M. 1993,ApJ,411,802
- Horne (1985) Horne, K. 1985,MNRAS,213,129
- Horne (1993) Horne, K. 1993, in Accretion Disks in Compact Stellar Systems, Vol. 9, Advanced Series in Astrophysics and Cosmology, ed. J. C. Wheeler (Singapore: World Scientific Publishing Co. Pte. Ltd.),117
- Horne & Cook (1985) Horne, K., & Cook, M. C. 1985,MNRAS,214,307
- Kato et al. (1996) Kato, T., Nogami, D., Baba, H., Matsumoto, K., Arimoto, J., Tanabe, K., & Ishikawa, K. 1996,PASJ,48,L21
- Leggett (1992) Leggett, S. K. 1992,ApJS,82,351
- Livio & Pringle (1994) Livio, M., & Pringle, J. E. 1994,ApJ,427,956
- Marsh (1988) Marsh, T. R. 1988,MNRAS,231,1117
- Patterson et al. (1996) Patterson, J., Augusteijn, T., Harvey, D. A., Skillman, D. R., Abbott, T. M. C., & Thorstensen, J. 1996,PASP,108,748
- Patterson et al. (1981) Patterson, J., McGraw, J. T., Coleman, L., & Africano, J. L. 1981,ApJ,248,1067
- Ramseyer (1994) Ramseyer, T. F. 1994,ApJ,423,243
- Ramseyer, Hatzes, & Jablonski (1995) Ramseyer, T. F., Hatzes, A. P., & Jablonski, F. 1995,AJ,110,1364
- Robinson et al. (1978) Robinson, E. L., Nather, R. E., & Patterson, J. 1978,ApJ,219,168
- Robinson et al. (1995) Robinson, E. L., Wood, J. H., Bless, R. C., Clemens, J. C., Dolan, J. F., Elliot, J. L., Nelson, M. J., Percival, J. W., Taylor, M. J., van Citters, G. W., & Zhang, E. 1995,ApJ,443,295
- Rutten et al. (1992) Rutten, R. G. M., Kuulkers, E., Vogt, N., & van Paradijs, J. 1992a,A&A,265,159
- Rutten, van Paradijs & Tinbergen (1992) Rutten, R. G. M., van Paradijs, J., & Tinbergen, J. 1992b,A&A,260,213
- Sanwal et al. (1995) Sanwal, D., Robinson, E. L., Zhang, E., Colomé, C., Harvey, P. M., Ramseyer, T. F., Hellier, C., & Wood, J. H. 1995,ApJ,460,437
- Sarna (1989) Sarna, M. J. 1989,A&A,224,98
- Shahbaz et al. (1996) Shahbaz, T., Bandyopadhyay, R., Charles, P. A., & Naylor, T. 1996,MNRAS,282,977
- Shahbaz et al. (1994) Shahbaz, T., Naylor, T., & Charles, P. A. 1994,MNRAS,268,756
- Sherrington et al. (1982) Sherrington, M. R., Jameson, R. F., Bailey, J., & Giles, A. B. 1982,MNRAS,200,861
- Steeghs et al. (1997) Steeghs, D., Harlaftis, E. T., & Horne, K. 1997,MNRAS,290,L28
- Szkody & Mateo (1986) Szkody, P., & Mateo, M. 1986,AJ,92,483
- Wade & Rucinski (1985) Wade, R. A., & Rucinski, S. M. 1985,A&A,60,471
- Wolf et al. (1998) Wolf, S., Barwig, H., Bobinger, A., Mantel, K.-H., & S̆imić, D. 1998,A&A,332,984
- Wolf et al. (1993) Wolf, S., Mantel, K.-H, Horne, K., Barwig, H., Schoembs, R., & Baernbantner, O. 1993,A&A,273,160
- Wood, Horne, & Vennes (1992) Wood, J. H., Horne, K., & Vennes, S. 1992,ApJ,385,294
- (41) Wood, J. H., Horne, K., Berriman, G., & Wade, R. A. 1989a,ApJ,341,974
- (42) Wood, J. H., Marsh, T. R., Robinson, E. L., Stiening, R. F., Horne, K., Stover, R. J., Schoembs, R., Allen, S. L., Bond, H. E., Jones, D. H. P., Grauer, A. D., & Ciardullo, R. 1989b,MNRAS,239,809
- Wood et al. (1986) Wood, J., Horne, K., Berriman, G., Wade, R., O’Donoghue, D., & Warner, B. 1986,MNRAS,219,629
- Wood & Crawford (1986) Wood, J., & Crawford, C. S. 1986,MNRAS,222,645
- Wood (1986) Wood, J. 1986, Ph.D. thesis, University of Cambridge
- Zhang et al. (1986) Zhang, E.-H., Robinson, E. L., & Nather, R. E. 1986,ApJ,305,740