HST Imaging of Globular Clusters in the Edge–on Spiral Galaxies NGC 4565 and NGC 5907
Abstract
We present a study of the globular cluster systems of two edge–on spiral galaxies, NGC 4565 and NGC 5907, from WFPC2 images in the F450W and F814W filters. The globular cluster systems of both galaxies appear to be similar to the Galactic globular cluster system. In particular, we derive total numbers of globular clusters of and (where the first are statistical, the second potential systematic errors) for NGC 4565 and NGC 5907, respectively. This determination is based on a comparison to the Milky Way system, for which we adopt a total number of globular clusters of . The specific frequency of both galaxies is : indistinguishable from the value for the Milky Way. The similarity in the globular cluster systems of the two galaxies is noteworthy since they have significantly different thick disks and bulge-to-disk ratios. This would suggest that these two components do not play a major role in the building up of a globular cluster system around late–type galaxies.
keywords:
galaxies: individual (NGC 4565, NGC 5907) — galaxies:formation — galaxies: star clusters1114
1 Introduction
Globular clusters in extragalactic systems have established themselves as powerful diagnostics of the star formation history, dynamics, and structure of their host galaxies (see Ashman & Zepf 1998 for a recent review). Most of the observational studies of extragalactic globular cluster systems (GCSs) have concentrated on the systems of early–type galaxies, where globular clusters are easily identified against the smooth, dust free background. These studies have uncovered the characteristic properties of such globular cluster systems, as well as notable galaxy-to-galaxy variations in these properties. In comparison, information on the globular cluster systems of late-type galaxies is sparse.
The use of globular cluster systems as probes of the formation and evolution of galaxies is severely limited by this scarcity of data for spiral galaxy GCSs. There are two primary problems. The first is that much of the interpretation of early-type galaxy GCSs has used the well-studied globular cluster system of the Milky Way as a benchmark. For example, the result that the globular clusters of elliptical galaxies are more metal-rich in the mean than those of spiral galaxies is largely based on the mean metallicity of Milky Way globulars. Consequently, it is extremely important to establish whether the properties of the Milky Way globular cluster system are typical of spiral galaxy GCSs.
The second issue is that a better understanding of the GCSs of late–type galaxies is needed in order to fully utilize GCSs as probes of the formation and early evolution of galaxies. This is self-evident for the case of late–type galaxies, but is also a critical issue for constraining models of the formation and early evolution of elliptical galaxies. This is particularly important for testing the predictions of the merger model, in which elliptical galaxies are formed in the merger of spiral galaxies. In this picture, the GCSs of elliptical galaxies are composite systems. One population of clusters is associated with the progenitor spirals, while a second population of clusters forms in the merger event. Ashman and Zepf (1992) described several testable predictions arising from this scenario. However, the limited information on the the GCSs of spirals leads to uncertainties in these predictions since it is currently unclear what constitutes a typical spiral galaxy GCSs. One particular problem is that the characteristic specific frequency of globular clusters around spirals is poorly known. The absence of firm constraints on the number of globular clusters contributed by the progenitor spirals to an elliptical galaxy GCS leads to uncertainties in many of the detailed predictions for these systems that follow from the merger model. One of the key results of the present study is to add to the database of globular cluster specific frequencies for spiral galaxies.
In this paper, we present an imaging study of the globular cluster systems of two edge–on spiral galaxies: NGC 4565 and NGC 5907. Globular clusters were already statistically detected in NGC 4565 as stellar-like objects above the mean background by van den Bergh & Harris (1982) and Fleming et al. (1995). The former detected 100 clusters to an equivalent limiting magnitude of , and found the clusters to be compatible with a surface density profile of the form , similar to the profile of the Milky Way system. The latter study determined the peak of the globular cluster luminosity function to be at V. Fleming et al. (1995) extrapolated the observed number of clusters () to a total number of globular clusters and a specific frequency of under their assumptions for luminosity and distance. NGC 5907 has been searched for globular clusters by Harris, Bothun & Hesser (1988), but no globular cluster could be detected. The authors speculated that the lack of globular clusters was related to the non–existence of a central bulge.
In Section 2, we present the properties of the galaxies and the observations, and describe the photometry against a highly variable background. In Section 3, the results are analyzed. In Section 4 we compare the globular cluster systems to each other and to the Milky Way. Concluding remarks are made in Section 5.
2 Observations and Data Reduction
2.1 Observations
2.1.1 The target galaxies
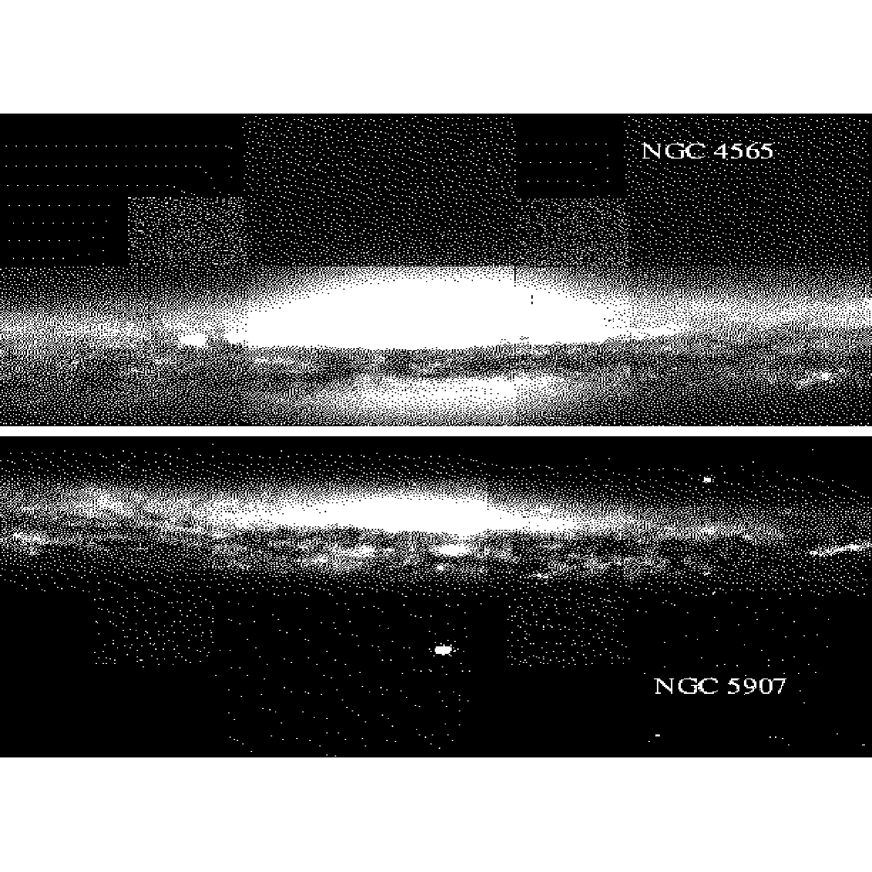
We obtained WFPC2 observations of the nearby, edge–on spiral galaxies, NGC 4565 and NGC 5907 (Program GO 6092). Basic properties of the two galaxies are given in Table 1 and a composite of our images is shown in Fig. 1. NGC 4565 is classified as an Sb galaxy (RC3, Hubble Atlas) with an inclination of (García-Burillo et al. 1997), and is at a distance of 10 Mpc, based on surface brightness fluctuations and planetary nebulae (Jacoby et al. 1996 and references therein). NGC 5907 is classified as an Sc galaxy (RC3, Hubble Atlas), with an inclination of (Morrison et al. 1994), and is at a distance of 12 Mpc, based on the Tully–Fisher relation (Bottinelli et al. 1988, Schöniger & Sofue 1994).
The two galaxies are very similar to each other in luminosity, but differ considerably in their disk characteristics. NGC 4565 has a prominent thick disk, accounting for roughly of the total luminosity (van der Kruit & Searle 1981). NGC 5907 has a less prominent bulge and an upper limit to the thick disk luminosity of 0.6% of the thin disk value—a relative contribution of less than of the thick disk of the Milky Way (Morrison et al. 1994).
2.1.2 The observations
For both of our target galaxies, NGC 4565 and NGC 5907, we obtained two pointings with the WFPC2 on HST. As shown in Fig. 1, we aligned each pointing so that the major axis was parallel to the edges of two WF chips, the third WF chip and the PC sampling part of the halo.
For every pointing, images in the F450W and F814W filters were obtained with total integration times ranging from 600 sec to 780 sec in the F450W filter, and of 480 sec in the F814W filter. Every pointing was split in three exposures shifted by 0.5\arcsec.
2.2 Data Reduction
2.2.1 Basic reduction and photometry
The basic image reduction was carried out under IRAF. For every pointing, the three calibrated science images provided by the Space Telescope Science Institute were shifted by 0.5\arcsec (using the task imshift) and trimmed in order to be aligned. They were then combined with the task crrej that rejected the vast majority of cosmic rays.The images were transformed into FITS format for the photometry.
The photometry was carried out using the SExtractor software (Bertin & Arnouts 1996). The finding parameters were set to 2 connected pixels 2.5 above the local background (computed in a 10 by 10 pixel mesh). The computation of a local background in a relatively fine grid was chosen to allow the finding criteria to be equivalent in the various parts of the image, in particular towards the disks where the background becomes very irregular. Typically, down to an equivalent B magnitude of 25.5, 0 to 2 objects were detected in both the F450W and F814W image on the PC, 8 to 18 on the WF “halo” field, and 130 to 340 on the WF fields including disc and bulge. The latter included a large number of stellar associations and HII regions. Positions on the sky (RA and DEC) were computed for all objects using the task metric in the STSDAS package. Distance from the center, along the disc, and orthogonal distance from the disc were computed using position angles of for NGC 4565 (Rupen 1991) and for NGC 5907 (García-Burillo et al. 1997).
The photometry was carried out with 2 pixel radius apertures in order to avoid being affected by background irregularities. Corrections to get the equivalent magnitude to a 0.5\arcsec aperture were determined from isolated bright objects on the images and found to be 0.35 and 0.18 mag for the PC and WF F450W measurements respectively, and 0.55 and 0.21 mag in the F814W filter, with errors of %. Additional 0.1 magnitudes were added to obtain the total magnitude of the objects (derived for the WFPC2 point spread functions, following Holtzman et al. 1995). Note that at the distance of our galaxies the largest globular clusters will be resolved and these corrections underestimated. This will hardly affect the colors since the luminosity profiles in F450W and F814W are similar, but could significantly affect the individual magnitudes, as a function of the object size (cf. Kundu & Whitmore 1998, Puzia et al. 1999). Finally, the calibration relation given in Holtzman et al. (1995) were used to obtain Johnson–Cousins B and I magnitudes.
2.2.2 Globular cluster selection
Extensive artificial star experiments with artificial point sources and artificial globular clusters were carried out. For the latter WFPC2 point spread functions obtained with Tiny Tim (Krist & Hook 1997) and convolved with a Modified Hubble law of core radius 0.1\arcsec and 0.2\arcsec were used 111The core radius of the modified Hubble law is almost identical to the “core” radius of a King profile, the King radius being the radius where the projected density of an isothermal sphere drops to almost half (0.5013) as oppose to half (0.5) for the core radius of the Modified Hubble law.. The latter correspond to core radii of about 4 to 10 pc at the distance of 10 to 12 Mpc, and lie in the upper range of the values measured in the Milky Way (only 27% of the Milky Way cluster have a core radius larger than 4 pc in the compilation of Harris 1996). The resulting FWHM of our artificial objects range from 0.8 to 1.5 pixels and 1.5 to 2.5 pixels for artificial stars and globular clusters respectively, at B. These allowed us to define robust selection criteria for globular clusters based on the FWHM of the detected objects ( and pixels, as returned by SExtractor). These selection criteria were applied down to B; at fainter magnitudes the signal–to–noise was not sufficient to discriminate with high confidence between point sources and extended objects. Note that down to this magnitude limit our finding algorithm is 100% complete and objects will only be missed if they are physically obscured, e.g. by dust.
We further introduced a cut in color and magnitude. For the color cut, we chose B–I , roughly 0.2 magnitudes bluer than the bluest globular clusters in the Milky Way (see also Fig. 3). No upper limit was chosen to avoid excluding reddened objects. As a magnitude range, we chose B, corresponding to B and at the respective distances of NGC 4565 and NGC 5907. As a reference, the brightest clusters in the Milky Way and M31 have B ( Cen) and B (Mayall II). Our upper magnitude cut was dictated by the FWHM selection, only reliable down to B which was used as the limiting magnitude. The peak of the globular cluster luminosity function is expected at B, as derived by Della Valle et al. (1998), using the new HIPPARCOS distance calibration and the list of Milky Way clusters of Harris (1996). This corresponds to B and B at the distance of the two galaxies, so that we pass the peak of the luminosity function in both cases.
The expected number of foreground stars contaminating our images and passing our selection criteria were estimated from galactic models (Ibata, priv. com.) and the Hubble Deep Field to be per pointing. The number of contaminating galaxies was estimated from several fields of the Medium Deep Survey (Griffiths et al. 1993) and our selection criteria turned out to be robust against background galaxy contamination at these bright magnitudes (B) estimated to be per pointing.
The final samples include 40 and 25 globular clusters in NGC 4565 and NGC 5907 respectively (see Table 2 and 3). All candidates (except one in NGC 5907 identified as a star) were confirmed by a visual inspection. The distribution of globular clusters, together with all objects detected is shown in Fig. 2. The colors of the globular cluster candidates in NGC 4565, as well as visual inspection of the galaxy dust lane, suggests that the majority of the clusters with positive Z suffer significant extinction. The identifiable regions of dust are less extended in NGC 5907 and there is less direct evidence for significant extinction, but we cannot rule out reddening of the clusters in this galaxy.
Color magnitude diagrams for the detected globular clusters in NGC 4565 and NGC 5907 are shown in Fig. 3, together with one for Milky Way globular clusters (uncorrected for reddening) as comparison. The mean colors and dispersion for the samples are in NGC 4565, in NGC 5907, and in the Milky Way ( when corrected for reddening, corresponding to a mean metallicity of [Fe/H] dex). This tends to support the evidence that reddening is more of an issue in NGC 4565 than NGC 5907, at least if the intrinsic colors ( metallicities) of the GCSs of the three galaxies are similar. One cautionary note in this regard is that the bluer mean colors of the NGC 5907 clusters is partly driven by some very blue objects amongst the globular cluster candidates. Since these blue objects are not preferentially located near the disk, it is unlikely that they are young compact star clusters, but it is possible that one or two such objects maybe be included in the sample. Despite these complications, the small differences () in the mean values probably suggest only moderate differences in the mean metallicities ( dex following the conversion of Couture et al. 1990).
3 Total Numbers of Globular Clusters and Specific Frequencies
3.1 The total number of globular clusters
In order to estimate the total number of globular clusters around NGC 4565 and NGC 5907, three extrapolations are required. The first is to account for globular clusters fainter than our magnitude limit. The second is for globular clusters that are not covered by our imaging field. The third is for globular clusters lying behind the disk and bulge and being obscured.
3.1.1 The approach: a direct comparison with the Milky Way
We chose to estimate the counts by direct comparison with the Milky Way and estimate the total number of globular clusters in the two galaxies by comparing our observations with the same spatial region and equivalent magnitude limit in our Galaxy. This approach has the advantage of taking into account all three extrapolations at once without propagating unnecessary errors. It is motivated by the small number of objects detected and the limited spatial coverage of our observations. These do not allow us to derive the spatial profile of either globular cluster system, necessary to estimate the spatial extrapolation. Further, we would still need a model to account for the clusters behind the disk.
Specifically, we created a mask for each galaxy based on the areal coverage of the two WFPC2 pointings of our observations. These masks excluded regions between chips and the edges of chips where the images were trimmed. Also excluded were small regions ( 150 \arcsec) centered on the bulges where our artificial star experiments indicated the data to be incomplete. By imposing the relevant mask onto the Milky Way clusters and using an absolute magnitude cut appropriate to at the distances of the two galaxies, we determined the number of Milky Way globular clusters that would have been detected with our observations. We used positions and magnitudes of Milky Way globular clusters taken from the McMaster catalog (Harris 1996) to create a 2-dimensional spatial distribution by projecting Galactocentric coordinates into the plane. Figures 4 and 5 give a visual representation of the results of this process.
For each galaxy, there are four possible orientations of the mask that preserve the alignment of the pointings along the major axis of the galaxy. We therefore repeated the above exercise for all four orientations and in each case counted the number of Milky Way globular clusters that were “detected” (see Table 4). The mean number of clusters from these four possibilities was used to estimate the total number of globular clusters, , in each galaxy, using the expression:
where is the total number of globular clusters in the Milky Way (, Ashman & Zepf 1998), is the number of globular clusters observed in our target galaxies (40 and 25 for NGC 4565 and NGC 5907, respectively, corrected to 38 and 23 when accounting for fore-/background contamination), and is the mean number of globular clusters from the four mask orientations (see Table 4).
The method relies on several assumptions that we discuss in turn.
3.1.2 The Milky Way globular cluster sample
The McMaster catalog lists 141 globular clusters, 134 of which have Galactocentric coordinates, and 112 of which have de-redenned absolute B magnitudes (which served for the magnitude cut). However, the clusters with no reported magnitudes are almost exclusively more than one magnitude fainter than the peak of the luminosity function (based on their available absolute magnitudes) and would also be undetected at the distances of our target galaxies.
We assumed the total number of globular clusters in the Milky Way to be . The majority of undetected Milky Way globulars are assumed to be behind the Galactic bulge. The counterparts of such globular clusters in NGC 4565 and NGC 5907 would also be undetected in our observations due to obscuration by disk and bulge. The scale length and scale heights of the thin disk of all three galaxies is not too different (e.g. van der Kruit & Searle 1981, Morrison et al. 1994, Kent et al. 1991). We therefore assume than the number of obscured objects is the same in all galaxies (within 20%).
Thus while our Milky Way sample is not complete, the missing clusters tend to be ones that we would not detect in NGC 4565 and NGC 5907 anyway.
3.1.3 Extrapolation over the luminosity function
We assumed that the globular cluster luminosity functions of NGC 4565 and NGC 5907 are similar to the one of the Milky Way, i.e. roughly Gaussian with a peak at B and a standard deviation of (see Sect. 2.2). This assumption of a ‘universality’ of the globular cluster luminosity functions is well supported by all recent observations (e.g. Whitmore 1997 for a recent review). For our assumed distances (see Table 1), our limiting magnitude of B corresponds to and magnitudes past the peak for NGC 4565 and NGC 5907 respectively. This corresponds to and past the peak. In other words, we sampled % and % of the luminosity functions respectively, and had to implicitly extrapolate over the remaining fraction. This extrapolating was taken care of by a corresponding cut in the absolute magnitude in the Milky Way sample. We stress that down to the magnitude limit, we do not suffer from finding incompleteness due to the software finding algorithm.
3.1.4 Extrapolation over the spatial distribution
Another caveat is the implicit assumption that the spatial profile of the Milky Way globular cluster system is similar to that of the globular cluster systems of NGC 4565 and NGC 5907. For NGC 4565, the available photographic data are consistent with this assumption (see Sect. 1). For NGC 5907, we assume it also to be the case (but see Sect. 3.3). If the spatial profile of the globular cluster system of NGC 5907 was markedly shallower than that of the Milky Way, we would detect a higher fraction of globular clusters in the “halo” WF and PC fields than we actually do. On the other hand, if the spatial profile was much steeper, it would not greatly affect our estimate of since our areal coverage includes roughly half of all the globular clusters for density profiles comparable to that of the Milky Way.
3.1.5 Errors in the distance
Errors in the distances to the galaxies lead to uncertainty in both the limiting magnitude and size of the mask used to derive the total number of clusters around each galaxy. The distance to NGC 4565 is fairly well established, with three independent secondary indicators all agreeing closely with a value of 10 Mpc. The distance to NGC 5907 was derived from the Tully–Fisher relation and found to be 12 Mpc by independent groups. To estimate the effects of distance variations on our derived values, we carried out the same procedure as above with the galaxies at assumed distances of % their preferred values, affecting both mask size and limiting magnitude. The results of this exercise are summarized in Table 4.
3.1.6 The total numbers of globular clusters
In summary, the above considerations lead us to total numbers of globular clusters for the two galaxies of and , following the equation of Sect. 3.1.1, where was corrected for fore-/background contamination. The error is the statistical error only: it includes Poisson errors in the observed number of globular clusters, Poisson errors in the average number of Milky Way globular clusters in the mask (derived from the 4 different orientations), and errors in the number of contaminating objects. To this error, potential systematic errors should be added. First, we estimate up to 20% difference in the number of obscured clusters between the Milky Way and our target galaxies. Second, we assumed for the Milky Way a total number of clusters of ; for a different assumption, our counts should be adjusted accordingly. Note that this systematic error does not influence any direct comparison between our two galaxies. The third systematic error comes from our assumed distances. For a 20% error in distance, our results would vary by for NGC 4565 and for NGC 5907, mainly due to the different limiting magnitude. Note that this systematic error significantly affects the total numbers of clusters, but has a much smaller effect on the derived specific frequencies (see below) due to the varying total magnitude of the galaxy which compensates somewhat the varying total number of clusters. Finally, for NGC 5907 an additional uncertainty is present due to the lack of knowledge on the exact shape of the globular cluster density profile.
Thus, formally, the total number of globular clusters are and , where the first error is the statistical one, the second error the systematic one.
For NGC 4565, our result is in good agreement with that of Fleming et al. (1995), who followed a completely different approach. This gives us confidence that our approach is also valid for NGC 5907 and the previous non–detection of globular cluster should probably be attributed to the poor observing conditions.
3.2 The specific frequencies
One can also express these numbers in terms of a specific frequency , where is the absolute visual magnitude of the parent galaxy. Using the absolute magnitudes of the two galaxies given in Table 1 and the total numbers from the previous section, we obtain and for NGC 4565 and NGC 5907, respectively. The errors include the random errors from above, as well as an error of 0.2 magnitudes in the de-reddened apparent magnitudes of the galaxies. The effect of the systematic errors would be to lower the values by 0.05, should the total number of globular clusters in the Milky Way be ; and to vary by less than 0.1 should the distance of the galaxy vary by 20% (the increase/decrease in total number being partly compensated by an increase/decrease in the total magnitude of the galaxy).
The quantity was introduced by Harris & van den Bergh (1981) primarily for use in elliptical galaxies where there is little variation in the stellar population from one galaxy to another. Zepf & Ashman (1993) attempted to account for stellar mass-to-light ratio variations in a statistical sense by defining a parameter to be the number of globular clusters per unit () stellar mass of a galaxy. Conversion from galactic luminosity to stellar mass was achieved by assuming a characteristic for each morphological type of galaxy. This is not an ideal procedure for individual galaxies, but it does tend to minimize differences in generated by stellar population differences. Thus the approach allows us to obtain a comparison of the number of globular clusters in our target galaxies with other late–type galaxies studied to date. For the conversion from luminosity to mass, we follow Zepf & Ashman (1993) and use values of 5.4, 6.1 and 5.0 for Sa, Sab-Sb and Sbc-Sc galaxies, respectively (cf. Faber & Gallagher 1979). The value for NGC 4565 is if it is assumed to be of type Sb and 1.2 if its type is Sbc (errors are of the order 20%, see above). For NGC 5097 (type Sc) . We comment on these values below.
3.3 -distributions
A visual comparison of the detected globular clusters in NGC 4565 and NGC 5907 with the masked Milky Way distributions (Fig. 4 and 5) suggests that the globular cluster system of NGC 5907 may be more flattened than that of the Milky Way. It is difficult to derive shape information directly for the globular cluster system of this galaxy from our small sample of 25 objects, as well as the asymmetric geometry of the field of view. A comparison of the -distributions of NGC 5907 with that of the masked Milky Way dataset suggests a difference at a 2- level according to a K-S test (NGC 4565 and the Milky Way show no detectable difference). The inner regions of the Milky Way globular cluster system is itself known to be somewhat flattened, primarily because of the presence of a thick disk population of globular clusters (e.g. Zinn 1985) so our data are consistent with a flattened globular cluster distribution in NGC 5907, but do not demand it. The previous non–detection of globular clusters in NGC 5907 (Harris et al. 1988) could also point towards a deficiency of objects in the halo, although we can only speculate on this point. Their ground based study was based on object over-densities, and was probably unable to detect clusters close to the disk. With a limiting magnitude similar to ours, the density of globular clusters in the halo would be only marginally detectable in a statistical comparison with a background field.
The shape of the cluster system in NGC 5907 is of some interest since it has been reported by Sackett et al. (1994) that this galaxy has a highly flattened halo () with a flat density profile falling off roughly as , compared to for the Milky Way halo and halo clusters.
4 Discussion
4.1 Comparison between the two galaxies
Although NGC 4565 and NGC 5907 have similar total luminosities and Hubble types, there are significant differences in the disk and bulge properties of the two galaxies. If the properties of the disk and bulge of a spiral galaxy influence the formation and evolution of its globular cluster system, we would therefore expect to find differences in the GCSs of these two galaxies.
The metal–rich globular cluster population in the Milky Way shares the kinematics, abundances and spatial distribution of the bulge and thick disk (e.g. Armandroff 1993; Burkert & Smith 1997). In the absence of a prominent bulge and thick disk (as in NGC 5907), we could have expected the absence of metal–rich globular clusters and the presence of a halo population only. The globular cluster system of NGC 5907 would have been less flattened than the one of NGC 4565 (whereas the opposite is observed as discussed above), and the total number of clusters normalized to the galaxy mass would be lower by 20% to 30% in NGC 5907 compared to NGC 4565 (estimated from the fraction of metal–rich to metal–poor clusters in the Milky Way). The latter could be the case (see Sect. 3.3) but for the contradictory reason that NGC 5907 lacks halo clusters and not disk clusters.
Given the uncertainties in reddening (i.e. metallicity determination from the colors), we cannot allocate individual clusters in these two galaxies to the disk/bulge or halo. This awaits spectroscopic measurements of individual clusters. However, the fact that the globular cluster systems of NGC 4565 and NGC 5907 are still very similar despite difference in the thick disk and bulge characteristics suggests that the processes which form the bulge and thick disk are largely unrelated to the processes which form the total globular cluster systems around late-type galaxies.
4.2 Comparison with the Milky Way and other Sb–Sbc spirals
As mentioned above, both NGC 4565 and NGC 5907 are similar in many respects to the Milky Way. Not only are their morphological types similar (Sb and Sbc compared to the Sbc Milky Way), but also their absolute magnitudes ( and compared to for the Milky Way, derived from the Tully-Fisher relation by adopting ) and by implication their total stellar masses.
It is therefore notable, although perhaps not surprising, that all three galaxies have very similar numbers of globular clusters. Independently of the total number of Milky Way clusters, NGC 4565 has about 20% more clusters than the Milky Way (but is also slightly more massive), while NGC 5907 has the same number of globular clusters as the Milky Way within the errors. Even large errors in our adopted distance would leave all numbers within 50% of each other. In terms of specific frequency, the Milky Way has for an assumed total magnitude of and globular clusters, identical to the value derived for the two other spirals.
Five other spirals of type Sb to Sc have studied globular cluster systems. Their values are (M31, Sb), (NGC 253, Sc), (NGC 2683, Sb), (NGC 4216, Sb), (NGC 5170, Sb), all taken from the compilation of Ashman & Zepf (1998). The quoted errors do not take into account the possibility of systematic errors. The corresponding values (using the mean values as in Sect. 3.2) are: , and . A maximum likelihood estimation of the mean and dispersion (including the Milky Way , NGC 4565 and NGC 5907) returns . Within the large uncertainties, galaxies of type Sb to Sc seem to produce a similar number of globular clusters per unit mass.
Should NGC 5907 have a lower than assumed (see Sect. 3.3), there would be a hint for Sc galaxies to have fewer globular clusters per unit mass. An increase of the number of globular clusters per unit mass along the Hubble sequence of late-type galaxies is strengthened by observations of 4 Sa and Sab galaxies (NGC 3031 (=M81), NGC 4569, NGC 4594, and NGC 7814). The respective values are , , , (taken from the compilation in Ashman & Zepf 1998), and the respective values are , , , and . The mean value for these earlier types is , but note that, except for M81, these values are poorly defined (either the number of globular clusters and/or the assumed distance is uncertain).
5 Summary and Conclusions
We have studied the globular cluster systems around two edge-on spiral galaxies, NGC 4565 and NGC 5907. For both these galaxies we derive a specific frequency of , indistinguishable from the value of the Milky Way GCS. The similarity of the specific frequencies is notable since the bulge-to-disk ratio and prominence of the stellar thick disk both differ considerably between the three galaxies. This result suggests that the properties of the thick disk and bulge of spiral galaxies do not have a significant influence on the building of globular cluster systems around such galaxies.
There is some evidence for flattening of the globular cluster system of NGC 5907, but we are unable to determine whether this is driven by a flattened halo population of clusters or a thick disk system. The latter possibility seems somewhat unlikely given the upper limits on any stellar thick disk in this galaxy. An interesting alternative is that the globular clusters in NGC 5907 are following the profile of a significantly flattened halo.
Acknowledgements.
We are very grateful to our Program Coordinator, Max Mutchler, whose work and help greatly assisted this project. M.K.-P. gratefully acknowledges support from the Alexander von Humboldt Foundation. K.M.A. and S.E.Z. acknowledge support for this project from NASA through the STScI grant GO-06092.01-94A.References
- [1]
- [2] Armandroff, T.E. 1993, in The Globular Cluster – Galaxy Connection, ASP Conf. Series Vol. 48, eds. G.H.Smith and J.P.Brodie, p. 48
- [3] Ashman, K.M., & Zepf, S.E. 1992, ApJ, 384, 50
- [4] Ashman, K.M., & Zepf, S.E. 1998, Globular Cluster Systems (Cambridge University Press: Cambridge).
- [5] Bertin E., & Arnouts S., 1996, A&AS 117, 393
- [6] Botinelli, L., Gouguenheim, L., & Teerikorpi, P. 1988, A&A 196, 17
- [7] Burkert, A., & Smith, G.E. 1997, ApJ 474, L15
- [8] Couture, J., Harris, W.E., & Allwright, J.W. 1990, ApJS 73, 671
- [9] Della Valle, M., Kissler-Patig, M., Danziger, J., Storm, J. 1998, MNRAS 229, 267
- [10] Faber, S.M., & Gallagher, 1979 ARA&A 17, 135
- [11] Fleming, D.E.B., Harris, W.E., Pritchet, C.J., & Hanes, D.A. 1995, AJ 109, 1044
- [12] García-Burillo, S., Guélin, M., & Neininger, N. 1997, A&A 319, 450
- [13] Griffiths, R.E., et al. 1994, ApJ 435, L19
- [14] Harris, H.G., Bothun, G.D., & Hesser, J.E. 1988, in Globular Cluster Systems in Galaxies, IAU Symp. xxx, eds.J.E.Grindlay and A.G.Davis Philip, Reidel:Dodrecht, p.613
- [15] Harris, W.E. 1996, AJ 112, 1487
- [16] Harris, W.E., & van den Bergh, S. 1981, AJ 86, 1627
- [17] Hilker, M. 1998, PhD thesis, Sternwarte Bonn
- [18] Holtzman, J.A., et al. 1995, PASP 107, 156
- [19] Jacoby, G.H., Ciardullo, R., & Harris, W.E. 1996, ApJ, 462, 1
- [20] Kent, S.M., Dame, T.M., & Fazio, G. 1991, ApJ 378, 131
- [21] Krist, J., & Hook, R., 1997, The Tiny Tim User’s Manual, Version 4.4, (available from the STScI)
- [22] Kundu, A., & Whitmore, B.C. 1998, AJ December issue
- [23] Morrison, H. L., Boroson, T. A., & Harding, P. 1994, AJ, 108, 1191
- [24] Puzia, T.H., Kissler-Patig, M., & Brodie, J.P. 1999, in preparation
- [25] Rupen, M.P. 1991, AJ, 102, 48
- [26] Sackett, P.D., Morrison, H.L., Harding, P., Boroson, T.A. 1994, Nature, 370, 441
- [27] Schöniger, F., & Sofue, Y. 1994, A&A 283, 21
- [28] van den Bergh, S., & Harris, W.E. 1982, AJ 87, 494
- [29] van der Kruit, P.C. & Searle, L. 1981, A&A 95, 105
- [30] Whitmore, B.C. 1997, in The Extragalactic Distance Scale, STScI workshop
- [31] Zepf, S.E., & Ashman, K.M. 1993 MNRAS, 264, 611
- [32] Zinn, R. 1985, ApJ, 293, 424
- [33]
| Property | NGC 4565 | NGC 5907 | Reference |
|---|---|---|---|
| RA (2000) | RC3 | ||
| DEC(2000) | RC3 | ||
| Type | Sb | Sc | RC3 |
| V | RC3 (value corrected for internal and external reddening) | ||
| (B–V) | RC3 | ||
| E(B–V) | 0.015 (+internal) | 0.011 (+internal) | Schlegel et al. 1998 |
| Inclination | García-Burillo et al. 1997, Morrison et al. 1994 | ||
| Thick Disk | 5% of BT | % of thin disk | van der Kruit & Searle 1981, Morrison et al. 1994 |
| Position Angle | Rupen et al. 1991, García-Burillo et al. 1997 | ||
| vhelio | RC3 | ||
| Adopted distance | Mpc | Mpc | Jacoby et al. 1996, Bottinelli et al. 1988, Schöniger & Sofue 1994 |
| 30.0 | 30.4 | derived from the above distance | |
| derived from the above values |
l ll rr r r
\tablenum2
\tablecaption
Globular clusters in NGC 4565
\tablehead
\colheadID & \colheadRA(2000) \colheadDEC(2000)
\colheadYa \colheadZb \colheadB \colhead(B–I)
\colhead \colhead \colhead \colheadarcsec
\colheadarcsec \colheadmag \colheadmag
KAZF4565-1 &12 36 13.8 26 00 35.3 -11.6 -122.4 \nlKAZF4565-2 12 36 14.0 25 59 58.2 -35.8 -94.6 \nlKAZF4565-3 12 36 15.7 26 00 41.0 11.1 -108.5 \nlKAZF4565-4 12 36 16.5 25 58 25.0 -76.8 -3.7 \nlKAZF4565-5 12 36 17.4 25 59 16.8 -31.6 -32.2 \nlKAZF4565-6 12 36 17.5 25 59 24.0 -25.7 -36.4 \nlKAZF4565-7 12 36 18.0 25 58 51.2 -44.7 -9.0 \nlKAZF4565-8 12 36 18.0 25 59 26.5 -20.0 -34.3 \nlKAZF4565-9 12 36 18.1 25 59 29.8 -15.9 -35.0 \nlKAZF4565-10 12 36 18.4 25 59 30.5 -12.7 -32.8 \nlKAZF4565-11 12 36 18.5 25 59 26.9 -14.7 -29.5 \nlKAZF4565-12 12 36 18.8 25 59 04.9 -27.4 -11.3 \nlKAZF4565-13 12 36 18.9 25 59 01.7 -28.1 -7.7 \nlKAZF4565-14 12 36 19.2 25 59 25.4 -9.2 -22.4 \nlKAZF4565-15 12 36 19.7 26 00 04.7 23.2 -45.3 \nlKAZF4565-16 12 36 19.8 25 58 55.9 -23.4 5.1 \nlKAZF4565-17 12 36 19.9 25 59 20.4 -5.4 -11.3 \nlKAZF4565-18 12 36 20.0 25 59 14.3 -8.7 -6.2 \nlKAZF4565-19 12 36 20.2 25 59 56.0 22.0 -34.8 \nlKAZF4565-20 12 36 20.3 25 59 06.4 -11.5 2.0 \nlKAZF4565-21 12 36 20.8 25 58 31.8 -30.8 31.8 \nlKAZF4565-22 12 36 21.1 25 59 36.6 17.8 -11.3 \nlKAZF4565-23 12 36 21.2 25 58 34.7 -25.3 33.2 \nlKAZF4565-24 12 36 21.6 25 59 44.2 27.3 -12.8 \nlKAZF4565-25 12 36 21.9 25 58 18.1 -29.6 52.2 \nlKAZF4565-26 12 36 22.3 25 58 30.4 -17.6 46.6 \nlKAZF4565-27 12 36 22.4 25 58 40.8 -8.8 40.6 \nlKAZF4565-28 12 36 22.8 25 58 01.6 -32.9 71.8 \nlKAZF4565-29 12 36 23.4 25 59 10.0 20.5 28.7 \nlKAZF4565-30 12 36 23.7 25 59 10.0 24.0 32.0 \nlKAZF4565-31 12 36 24.3 25 59 08.2 28.1 38.6 \nlKAZF4565-32 12 36 25.4 25 58 21.7 6.2 82.0 \nlKAZF4565-33 12 36 25.4 25 58 33.2 14.1 74.0 \nlKAZF4565-34 12 36 25.5 25 58 36.1 17.3 72.9 \nlKAZF4565-35 12 36 25.9 25 58 47.6 28.7 68.1 \nlKAZF4565-36 12 36 26.1 25 57 26.6 -25.9 127.8 \nlKAZF4565-37 12 36 26.1 25 58 42.2 27.3 74.1 \nlKAZF4565-38 12 36 26.6 25 58 08.4 8.7 103.2 \nlKAZF4565-39 12 36 26.9 25 58 00.8 6.1 111.2 \nlKAZF4565-40 12 36 27.4 25 58 16.0 21.5 105.5 \nl\enddata
aY: Distance from the center along the disk \tablenotetextbZ: Distance orthogonal from the disk \tablenotetext
l ll rr r r
\tablenum3
\tablecaption
Globular clusters in NGC 5907
\tablehead
\colheadID & \colheadRA(2000) \colheadDEC(2000)
\colheadYa \colheadZb \colheadB \colhead(B–I)
\colhead \colhead \colhead \colheadarcsec
\colheadarcsec \colheadmag \colheadmag
KAZF5907-1 & 15 15 40.1 56 20 03.8 -96.7 -64.6 \nlKAZF5907-2 15 15 46.7 56 19 50.9 -51.8 -29.7 \nlKAZF5907-3 15 15 46.9 56 21 14.8 -15.2 -105.1 \nlKAZF5907-4 15 15 47.3 56 21 31.3 -5.6 -118.8 \nlKAZF5907-5 15 15 47.7 56 20 52.8 -18.5 -82.4 \nlKAZF5907-6 15 15 49.1 56 20 28.0 -18.3 -55.0 \nlKAZF5907-7 15 15 50.0 56 20 03.1 -22.3 -29.4 \nlKAZF5907-8 15 15 51.5 56 19 28.6 -25.5 7.4 \nlKAZF5907-9 15 15 51.8 56 19 49.1 -14.2 -10.1 \nlKAZF5907-10 15 15 52.2 56 20 38.8 9.8 -53.6 \nlKAZF5907-11 15 15 52.5 56 20 11.4 -0.1 -28.0 \nlKAZF5907-12 15 15 53.1 56 19 01.2 -25.0 37.8 \nlKAZF5907-13 15 15 53.4 56 19 22.1 -13.7 20.0 \nlKAZF5907-14 15 15 54.2 56 20 00.2 8.6 -11.6 \nlKAZF5907-15 15 15 54.5 56 20 02.4 11.0 -12.8 \nlKAZF5907-16 15 15 54.8 56 19 39.4 4.0 9.1 \nlKAZF5907-17 15 15 55.4 56 18 45.3 -14.7 60.2 \nlKAZF5907-18 15 15 55.7 56 19 44.4 12.6 7.8 \nlKAZF5907-19 15 15 55.8 56 19 49.4 15.7 3.5 \nlKAZF5907-20 15 15 55.9 56 19 28.9 8.0 22.6 \nlKAZF5907-21 15 15 56.1 56 19 57.3 21.2 -2.8 \nlKAZF5907-22 15 15 57.3 56 19 25.3 17.2 30.9 \nlKAZF5907-23 15 15 57.4 56 17 47.4 -24.1 119.5 \nlKAZF5907-24 15 15 57.6 56 19 10.9 13.4 45.1 \nlKAZF5907-25 15 15 57.8 56 18 12.6 -9.8 98.6 \nl\enddata\tablenotetextaY: Distance from the center along the disk \tablenotetextbZ: Distance orthogonal from the disk \tablenotetext
l c c
\tablenum4
\tablecaption
Numbers of Milky Way globular clusters in mask
\tablehead
\colhead & \colheadNGC 4565 mask \colheadNGC 5907 mask
\startdata
orientation & 29 24
orientation 34 24
orientation 36 26
orientation 35 23
Mean , Dispersion
20% closer
20% further
X and Y are Galactic coordinates. The results for the closer and further sample are the means of all 4 orientations.