2Padua Astronomical Observatory, Vicolo dell’Osservatorio 5, I-35122 Padua, Italy
3Astronomy Department, University of Padua, Vicolo dell’Osservatorio 5, I-35122 Padua, Italy
4Brera Astronomical Observatory, Via Brera 28, I-20121 Milan, Italy
Star Formation History of Early–Type Galaxies in Low Density Environments.
Abstract
We analyze the star formation properties of a sample of 21 shell galaxies and 30 early-type galaxies members of interacting pairs, located in low density environments (Longhetti et al. 1998a, 1998b).
The study is based on new models developed to interpret the information coming from ‘blue’ H/FeI, H+K(CaII) and 4000 line-strength indices proposed by Rose (1984; 1985) and Hamilton (1985).
We find that the last star forming event that occurred in the nuclear region of shell galaxies is statistically old (from 0.1 up to several Gyr) with respect to the corresponding one in the sub-sample of pair galaxies ( Gyr or even ongoing star formation).
If the stellar activity is somehow related to the formation of shells, as predicted by several dynamical models of galaxy interaction, shells have to be considered long lasting structures.
Since pair members show evidence of very recent star formation, we suggest that either large reservoirs of gas have to be present to maintain active star formation, if these galaxies are on periodic orbits, or most of the pair members in the present sample are experiencing unbound encounters.
Key Words.:
Galaxies: elliptical and lenticular, cD; Galaxies: evolution; Galaxies: formation; Galaxies: fundamental parameters; Galaxies: interactions; Galaxies: star-burst1 Introduction
This paper is a sequel of a series dedicated to studying the star formation history of early type galaxies showing shells, ripples, fine structures etc. which are taken as signatures of past interactions (see Malin & Carter 1983; Schweizer 1992; Reduzzi et al. 1996) and complex star formation histories.
It is commonly accepted that dynamical interactions between galaxies leading to the formation of shell structures are in general accompanied by star formation if enough gas is at disposal to the interacting system. However, there are different views of this subject that emerge from dynamical models. In fact, numerical simulations of merging/accretion events with SPH codes, in which shell structures can develop, yield contrasting predictions as far as the accompanying stellar activity is concerned. The models by Kojima & Noguchi (1997) suggest that star formation in the satellite is turned off well before the shells develop. This explains why we see in shell galaxies signatures of post-star-burst. In contrast, the models by Weil & Hernquist (1993) show that star formation occurs (in the galaxy center) while the shell structure is forming. In both cases the shell structure lasts for time scales shorter than Gyr.
In alternative to the merging/accretion hypothesis (cf. Barnes 1996 and references therein), dynamical simulations show that shell structures could also originate from “weak interaction” between galaxies (Thomson 1991 and reference therein). In this case, shells are expected to last much longer than with the previous alternative.
The first paper of the series (Longhetti et al. 1998a) presented the sample of galaxies to be examined, i.e. 21 shell galaxies and 30 members of isolated interacting pairs located in low density environments and derived for their nuclear region several line strength indices defined in the spectral range 3700 Å 5700 Å. The indices were further splitted in two groups: red indices ( 4200 Å) and blue indices ( 4200 Å). The red indices (H, Mg1, Mg2, etc…, 16 indices in total) are according to the definition by Worthey (1992) and Worthey et al. (1994) and have been transformed into the Lick-IDS standard system, whereas the blue indices are 4000 Å, H+K(CaII) and H/FeI according to the definition by Rose (1984, 1985), Leonardi & Rose (1996) and Hamilton (1985). Finally, the spectra used to calculate the indices had a 2.1 Å FWHM resolution.
In the second paper (Longhetti et al. 1998b) the kinematics of the gaseous and stellar components of the galaxies under investigation were properly studied to correct the line-strength indices for velocity dispersion.
With the aid of this material, a thorough comparison of the above indices with those predicted by the fitting functions of several authors (Worthey 1992; Gorgas et al. 1993; Worthey et al. 1994; Idiart & de Freitas Pacheco al. 1995; Buzzoni et al. 1992, 1994) was made by Longhetti et al. (1998c) in a subsequent study. Furthermore, the properties of the galaxies in the sample were compared with those obtained by Gonzalez (1993), with particular attention to the distribution on the H vs. [MgFe] plane. The main result was that no difference could be detected in this plane between interacting and post-interacting galaxies. In particular, Longhetti et al. (1998c) discussed the influence of a secondary burst of star formation induced by interaction/accretion events.
In the present paper we will investigate the capability of the blue indices in unraveling the strength and age of the last star forming episode. Indeed determining the strength and age of this episode would bear very much on our understanding of the formation of shell galaxies and the relationship between shell formation and star formation events.
The paper is organized as follows. Section 2 summarizes the basic properties of the “blue” indices. Section 3 presents models of Simple Stellar Populations (SSP) and describes how we calculate the line–strength indices by amalgamating the medium resolution empirical library of stellar spectra by Jacoby et al. (1984, J84) with the library of low resolution theoretical spectra by Kurucz (1992). In addition to this, section 3 compares the line strength indices directly calculated from spectra with those obtained from fitting functions (see also Longhetti et al. 1998c). Section 4 presents the line–strength indices for composite stellar populations (CSP), i.e. model of galaxies in which a young stellar component is added to an old one in different proportions. This would mimic a recent burst of stellar activity taking place in an old galaxy (Leonardi & Rose 1996). The effects of emission lines and metallicity on the intensity of the blue indices are also discussed in some detail. The results of these simulations and how they compare with other similar models in literature are discussed in section 5. Finally, some implications for dynamical models of shell formation and galaxy evolution are discussed in section 6.
2 The Line–Strength Indices
2.1 H+K(CaII)
According to its definition (see Longhetti et al. 1998a), the index H+K(CaII) is actually a measure of the Balmer H line. It is in fact only the blend of H with the H(CaII) line that is able to affect the apparent ratio between H and K(CaII) lines.
Rose (1985) has pointed out that stars of type later than F5 show a constant ratio between H and K(CaII) lines, while hotter stars, with a deeper Balmer series, are characterized by a stronger blend H(CaII)+H relative to K(CaII) and consequently by a smaller value of the H+K(CaII)index, which reaches the minimum value in A-type stars characterized by the maximum Balmer absorption.
2.2 H/FeI
This index, introduced by Rose (1985), is a measure of the Balmer H line, whose central intensity is related to the average intensity of two FeI lines. At increasing surface temperature of a star, this index decreases because the H and FeI lines increase and decrease, respectively. The H/FeI index reaches its minimum value in A0-type stars (whereby the Balmer absorption lines have their maximum intensity). It turns out to be a good age indicator (just like all the Balmer lines) even though it is also sensitive to metallicity via the dependence on the FeI lines. In addition to this, like the other Balmer lines indices, it might be contaminated by emission lines.
2.3 4000
The spectral break at 4000Å is produced by two factors: the concentration of Balmer lines toward the asymptotic limit of 3650Å and the increase in stellar opacity at shortward of 4000Å caused by ionized metals. The 4000 index decreases with increasing surface temperature, it depends upon the stellar gravity only for stars cooler than F5 (Hamilton 1985) and is also sensitive to the chemical composition (Van den Bergh 1963, van den Bergh & Sackmann 1965, Hamilton 1985). This index provides information about the stellar population at the turn off, blending metallicity and age effects (Worthey 1992). Furthermore, the 4000 index is useful for studies of distant galaxies, because thanks to the large band-passes adopted for its definition it can be measured with small errors also on spectra at low signal to noise. Finally, just like all other “blue” indices, cosmological recession shifts this index toward redder spectral ranges whereby modern CCDs are more sensitive.
3 Line-Strength Indices of SSPs
Most sudies of evolutionary population synthesis (EPS) are based on low resolution stellar spectra, see for instance Bressan et al. (1994, 1996) who made use of the Kurucz (1992) library. This fact prevents the direct measure of line-strength indices on the integrated spectral energy distribution (ISED) of stellar aggregates of any complexity, e.g. SSPs and galaxy models. The problem is solved by making use of the so-called fitting functions that express the intensity of the indices as a function of three basic stellar parameters, namely effective temperature, gravity and metal content (see Worthey 1992, Worthey et al. 1994). Knowing these quantitities for each single star in the stellar mix, the integrated line strength indices can be easily calculated both for SSPs and galaxy models in a fully consistent manner with their associated ISEDs, see Bressan et al. (1996) for all details. It goes without saying that this is possible only if the fitting functions are known. Unfortunately, there are indices, for instance the blue ones, for which fitting functions are not available. Therefore one is forced to make use of spectra with the required degree of resolution. This is the subject of the coming section.
3.1 Using empirical Medium-Resolution Spectra
In general, the spectral energy distribution , flux (in suitable units) as a function of the wavelength, of a SSP of any age and metallicity is defined by
| (1) |
where the product between the initial mass function (IMF) and the monochromatic flux, of a star of initial mass , metallicity and age , is integrated along the isochrone associated with the SSP in question. The integration is performed from , the minimum mass of objects that can become stars, up to , which is the maximum mass of the stars in the most evolved phase still contributing to the total luminosity (see for details Bressan et al. 1994, 1996).
The function indicates the adopted spectrum of the constituent stars of mass , age and metallicity , i.e. the adopted spectral library as function of effective temperature, gravity and metal content (a trivial re-normalization of the spectra is required to scale the flux emitted by a star according to its total bolometric luminosity). This library has of course its own resolution which determines the final result.
For the purposes of this study, we have adopted the empirical library of stellar spectra by J84, which contains fluxes in units of Å with a mean resolution of 4.5 Å (FWHM) for stars of different spectral type and luminosity class. The spectra cover the range of wavelength 3500Å – 7500Å and refer to stars with solar composition.
To incorporate the J84 library in our population synthesis algorithm, we proceed as follows:
(i) We assign to each star of the J84 catalog the gravity and effective temperature according to the relationships by Garcia-Vargas (1991).
(ii) As the J84 spectra cover only a limited spectral range, we have extended them both at the short and long wavelength side by means of the Kurucz (1992) spectra of the same composition, gravity and effective temperature. The Kurucz spectra have been cut at 3510Å and 7427Å and after suitable re-scaling, patched with the J84 spectra.
(iii) The spectral ranges used to calculate the scaling factors are [3510Å–3550Å] and [7390Å–7427.2Å] at the blue and red side of the spectrum, respectively. From a theoretical point of view, the blue and red scaling factors should be the same. Actually, we have detected differences between the blue and red scaling factors of about 26%. Various reasons concur to build up this difference: (a) inaccuracy of the synthetic spectra; (b) errors in the flux calibration by J84; (c) some mismatch in the correspondence between Kurucz (1992) and J84 spectra via the correspondence in gravity and effective temperature.
The monocromatic flux of individual stars in eq.(1) now reduces to because the J84 library is only for solar composition. However, the dependence on the metallicity (chemical composition) is not completely wiped out, because it still remains via the metal dependence of the isochrones along which relation (1) is integrated. Though reduced, the effect of different metallicities (chemical compositions) on the final results can be noticed.
In order to compare indices derived from direct measurements on the spectra with those obtained from fitting functions, we must now degrade the spectra of our SSP and/or model galaxies (see below) to the resolution of 8.2 Å (FWHM) typical of the Lick-IDS spectra. To this purpose we convolve our spectra with a Gaussian distribution with = 2.92Å.
Using the degraded spectra we calculate the line-strength indices by means of one of the relations below
| (2) |
| (3) |
as appropriate to whether we are dealing with atomic or molecular indices (see Worthey 1992, Worthey et al. 1994 and Longhetti et al. 1998a for the meaning of the various symbols).
In several cases, the results we have obtained do not perfectly agree with the standard Lick standard system, but a small off-set is present. Determining this off-set is not possible because there is no sample of stars or spectra in common between the Lick and the J84 library.
Finally, we have calculated indices for three large grids of SSPs, i.e. at varying metallicity (Z=0.004, Z=0.02, Z=0.05), each grid containing 30 values of the age in the interval 0.05 to 19 Gyr.

3.2 Comparing stellar indices
In this section we check whether stellar indices derived directly from the stellar spectra of the J84 library (therein-after the Jacobi indices) are fully consistent with the same indices but obtained from fitting functions. The comparison is made for all the stars of the J84 catalog.
In Fig. 1 we display the comparison between the Jacobi indices and those obtained from the Lick system fitting functions (Worthey 1992, Worthey et al. 1994) as, however, modified by Longhetti et al. (1998a,c) in the high temperature regime.
Similar comparison has been made using the fitting function of Buzzoni et al. (1992; 1994) for Mg2, Fe5270 and H (open squares) and those of Idiart & de Freitas Pacheco (1995) for Mg2, Mgb and H. The results are also shown in Fig. 1, where the open squares are for Buzzoni et al. (1992, 1994) and open triangles for Idiart & de Freitas Pacheco (1995). Considering all the uncertainties affecting the whole procedure, the agreement we get is remarkable.
| Mean Value of [Index(ff) - Index(J84)] | ||||
|---|---|---|---|---|
| Index | Stars | SSP | SSP | SSP |
| (J84) | () | () | () | |
| H | 0.64 | 0.16 | 0.02 | -0.08 |
| Mg1 | -0.01 | 0.02 | 0.03 | 0.03 |
| Mg2 | -0.02 | -0.01 | 0.04 | 0.05 |
| Mgb | 0.24 | 0.26 | 0.51 | 0.58 |
| MgFe | -0.24 | 0.14 | 0.31 | 0.36 |
| CN | -0.07 | -0.01 | -0.01 | -0.01 |
| CN2 | -0.05 | 0.01 | 0.00 | 0.00 |
| Ca4427 | 0.07 | 0.10 | 0.17 | 0.20 |
| G4300 | -0.31 | -0.24 | -0.07 | 0.01 |
| Fe4383 | -0.28 | 0.21 | 0.53 | 0.63 |
| Ca4455 | -0.40 | 0.69 | 0.94 | 1.01 |
| Fe4531 | -0.22 | 0.03 | 0.16 | 0.23 |
| Fe4668 | 1.78 | 0.13 | 0.21 | 0.22 |
| Fe5015 | 0.70 | 0.43 | 0.57 | 0.59 |
| Fe5270 | -0.05 | -0.03 | 0.08 | 0.10 |
| Fe5335 | 0.63 | 0.22 | 0.25 | 0.27 |
| Fe5406 | -0.07 | -0.05 | -0.01 | 0.01 |
3.3 Comparing SSP indices
In this section firstly we examine the red indices for SSPs and compare them with their counterparts based on fitting functions. Secondly we look at the blue indices for SSPs. In such a case, no comparison with fitting function analogs is obviously possible.
In Fig. 2 we show the comparison of SSP red indices with solar metallicity (=0.02) obtained from the two methods (fitting functions and direct measurement). Along each curve the symbols change according to the age of the SSP: full squares for 1019 Gyr, open circles for 19 Gyr, full circles for 0.20.9 Gyr and open squares for 0.05 0.1.
The data displayed in Fig. 2 show that both methods yield consistent results. Although almost all red indices strongly depend on the metallicity, i.e. their values significantly change for small variations in the metal content, this effect is not shown here as we are more interested now in the mutual consistency of the two methods rather than the absolute values of the indices as function of age and metallicity.
Particularly remarkable is the agreement for those indices that are commonly considered as valuable age indicators, such as H and G4300.
Specifically, the values of H derived from the two methods at ages older than 1 Gyr show an average difference of with a root mean difference of . For G4300 we find that they differ by with a root mean difference passing from one method to the other. Also in this case, the average difference gets smaller for ages older than 1 Gyr (mean difference , root mean difference ).

A systematic comparison between the Jacobi and Lick indices is presented in Table 1 for all indices in common.
Finally, in the three panels of Fig. 3 we plot the blue indices 4000, H+K(CaII) and H/FeI as a function of the age for SSP with different metal content. The effect of this is shown by using different symbols. The same data are also listed in Table 2 (available in electronic form only) for the sake of general use. The following remarks can be made:
(a) The indices H+K(CaII) and H/FeI at ages older than Gyr tend to flatten out or, at ages older than about 10 Gyr, even to reverse the trend. They somehow loose ability in deriving the age. The same is true for ages younger than 0.3 Gyr. Therefore, there is only a limited range in age in which these indices vary monotonically with time, i.e. 0.3 to about 3 Gyr. However the effect of metallicity is not neglible bringing an uncertainty on the age of about
(b) The index 4000 works much better than the previous ones, because it is monotonic with the age up to ages older than 10 Gyr. The uncertainty brought about by the metal parameter is however still large ().

4 Modeling Narrow Band Indices of CSPs
If fine structures and/or signatures of interaction in early type galaxies imply additional star forming episodes of various intensities and ages, how they would reflect into the spectro-photometric properties of these systems? Do the line strength indices keep memory of this past activity? How can we model this complex dynamical picture from the point of view of spectro-photometry?
A viable approximation to the problem is to consider a galaxy of a certain mass, which underwent bulk star formation in the far past, acquired its own pattern of abundances and ages for the mix of stars, evolved passively ever since and at a certain age hosted an additional episode of star formation of suitable duration and intensity in which a certain amount of gas was turned into stars. The source of gas can be either internal, if any is left over and retained after the first initial activity, or acquired from outside during the interaction episode.
If the initial star forming activity took place on a time scale much shorter than the Hubble time, the host galaxy can be further approximated to a single entity, in which stars span a certain range of age and metallicity. In the context of the standard galactic wind scenario (Larson 1974), the bulk star forming activity is terminated within the first Gyr and the mean metallicity of the stars (galaxy) is from nearly two times solar to a third of solar as the galaxy mass decreases from 1 to 0.01 (see for instance the complete galaxy models by Bressan et al. 1994, 1996; Tantalo et al. 1996, 1998).
The bursting mode idea has long been around starting from the pioneer studies by Huchra (1977) and Larson & Tinsley (1978) to explain the scatter in broad band colors observed in normal and peculiar galaxies of the same morphological type, till the more specific attempt by Leonardi & Rose (1996) who investigated the effects of a burst of star formation on the indices H+K(CaII) and H.
Leonardi & Rose (1996) start from the spectrum of a normal galaxy, obtained as the average spectrum of about 70 elliptical galaxies observed in the core of the Coma cluster and add to this template the synthetic spectra of young SSPs with solar metallicity and different ages.
The age of the SSP stands for different burst ages, whereas the burst strength is simulated by changing the relative proportions in which old and young spectra concur to build the final spectrum of the bursting galaxy.
The indices H+K(CaII) and H/FeI are then measured on the composite spectrum of the post-star-burst models and are compared with the observational data. The location of a sample of E+A galaxies on the H+K(CaII) vs. H/FeI diagram provides a first estimate of the ages and intensity of the star forming activity characterizing E+A galaxies.
In this work we make use of the same technique. The main difference with respect to Leonardi & Rose (1996) is that also for the normal galaxy we adopt a theoretical spectrum of suitable age and metallicity. In all experiments we are going to present the age of the quiescent galaxy is 15 Gyr and the metallicity is solar. Tests however have been made at varying the age and metallicity of the host galaxy. Specifically, we have also adopted for the age the values of 12 and 18 Gyr and for the metallicity the values (20% of the solar value) and (2.5 times the solar value). As expected the results are little affected by the choice for the age of the host galaxy, whereas they are more sensitive to the metallicity.
To simulate the bursts of star formation we have added to the template spectrum of the host galaxy, spectra of SSPs of seven different ages, i.e. 10, 6, 4, 2, 0.9, 0.1 and 0.05 Gyr.
In each simulation, the spectra of the two components (host galaxy and SSP) are weighted by a factor expressing the percentage of stellar mass, relative to the total mass, created during the corresponding star formation episode.
Table 3 shows the correspondence between the fractionary mass in the burst and the contribution to the total luminosity by the two component. This correspondence has been calculated using the mass to light ratio characterizing each SSP at the chosen age.
The mass is given by the total mass in living stars plus the mass in White Dwarfs and Neutron stars for which we have assumed the typical values of 0.6 and 1.4, respectively. The dependence of the White Dwarf and Neutron Stars mass on the progenitor mass is neglected here for the sake of simplicity.
The luminosity factor is taken from the Padua library of SSPs (Bertelli et al. 1994, Bressan et al. 1994, Tantalo et al. 1996).
| T [Gyr] | 15.00 | 10.00 | 6.00 | 4.00 | 2.00 | 0.90 | 0.10 | 0.05 |
|---|---|---|---|---|---|---|---|---|
| 0.95 | 1.06 | 1.21 | 1.36 | 1.69 | 2.38 | 5.81 | ||
| 4.82 | 4.53 | 4.12 | 3.73 | 3.25 | 2.60 | 0.44 | -0.30 | |
| 3.48 | 2.69 | 1.88 | 1.34 | 0.89 | 0.51 | 0.08 | 0.04 | |
| % YSSP | ||||||||
| 0.01 | 0.01 | 0.02 | 0.03 | 0.04 | 0.08 | 0.56 | 1.10 | |
| 0.05 | 0.07 | 0.10 | 0.14 | 0.21 | 0.39 | 2.76 | 5.28 | |
| 0.1 | 0.13 | 0.19 | 0.27 | 0.42 | 0.77 | 5.38 | 10.03 | |
| 0.5 | 0.66 | 0.95 | 1.35 | 2.09 | 3.75 | 22.19 | 35.88 | |
| 1 | 1.31 | 1.89 | 2.68 | 4.12 | 7.27 | 36.44 | 52.94 | |
| 5 | 6.46 | 9.13 | 12.53 | 18.31 | 29.01 | 74.92 | 85.43 | |
| 10 | 12.72 | 17.50 | 23.22 | 32.12 | 46.31 | 86.31 | 92.52 | |
| 20 | 24.70 | 32.31 | 40.49 | 51.56 | 65.99 | 93.42 | 96.53 | |
| 30 | 35.99 | 45.00 | 53.84 | 64.60 | 76.89 | 96.05 | 97.95 | |
| 40 | 46.66 | 56.00 | 64.47 | 73.95 | 83.81 | 97.43 | 98.67 | |
| 50 | 56.75 | 65.62 | 73.13 | 80.98 | 88.59 | 98.27 | 99.11 | |
| 60 | 66.31 | 74.12 | 80.32 | 86.46 | 92.09 | 98.84 | 99.40 | |
| 70 | 75.38 | 81.67 | 86.39 | 90.86 | 94.77 | 99.25 | 99.62 | |
| 80 | 84.00 | 88.42 | 91.59 | 94.45 | 96.88 | 99.56 | 99.78 | |
| 90 | 92.19 | 94.50 | 96.08 | 97.46 | 98.59 | 99.80 | 99.90 | |
| 100 | 100.00 | 100.00 | 100.00 | 100.00 | 100.00 | 100.00 | 100.00 | |
The percentages of mass supposedly stored in the young SSPs ranges from 0 (only the host galaxy is considered) to 100 (only the young population contributes to the spectrum).
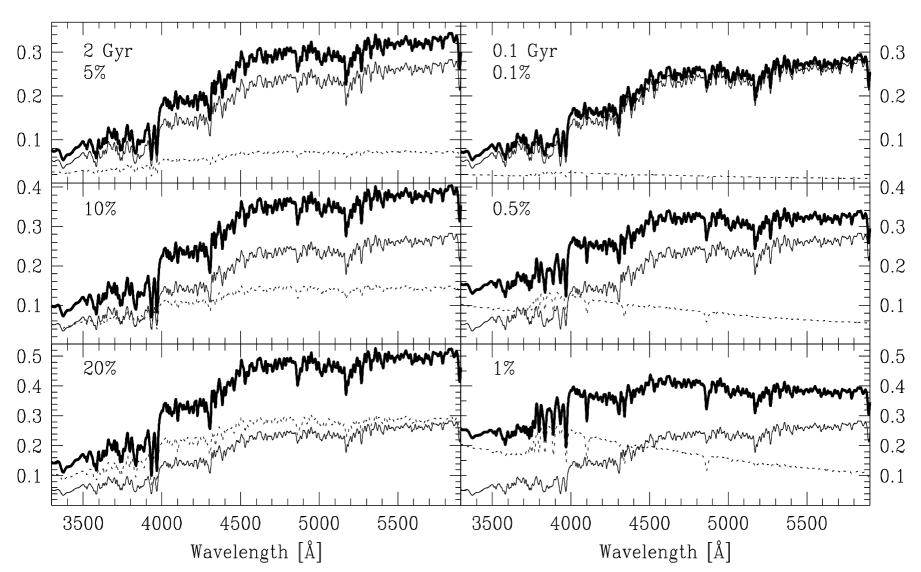
For purposes of illustration, we show in Fig. 4 a few cases with different burst age and intensity (percentage of mass turned into stars). Each panel contains the spectrum of the hosting galaxy, the spectrum of the SSP representing the burst and the resulting total spectrum. Worthy of note is that the contribution from the young component grows at decreasing age of the burst and that even very small percentages of a young component may deeply alter the final spectrum. This is particularly evident looking at the spectral region short-ward of 4000Å, where, for instance, the contribution by a SSP of 0.9 Gyr involving only the 5% of the total galaxy mass parallels that of the host galaxy, 15 Gyr old and containing the remaining 95% of the mass. Furthermore, a stellar population of 0.1 Gyr representing only the 5% of the total mass can produce 2/3 of the total luminosity emitted at Å. This comparison makes evident the usefulness of the spectral region short-ward of 4000Å to unravel even small traces of recent star forming activity.
| Shell Galaxies | Pair Galaxies | |||||||
|---|---|---|---|---|---|---|---|---|
| Name | 4000 | H+K(CaII) | H/FeI | Name | 4000 | H+K(CaII) | H/FeI | |
| E3420390 | 2.13 | 0.98 | 0.91 | R101b | 2.15 | 1.10 | 0.87 | |
| N1316 | 2.12 | 1.15 | 0.89 | R24b | 1.31 | 0.63 | 0.86 | |
| N6776 | 2.04 | 0.82 | 0.94 | R298b | 1.64 | 0.59 | 0.94 | |
| N7135 | 2.19 | 1.09 | 1.03 | R381a | 2.28 | 1.23 | 0.92 | |
| E1070040 | 2.12 | 1.09 | 0.91 | R405a | 2.26 | 1.02 | 0.96 | |
| E2890150 | 1.62 | 0.79 | 0.76 | R405b | 2.34 | 0.93 | 0.94 | |
| N1210 | 1.83 | 0.47 | 0.96 | R317a | 2.17 | 1.08 | 0.98 | |
| N6849 | 2.27 | 1.00 | 0.94 | R317b | 1.72 | 0.86 | 1.04 | |
| N6958 | 2.02 | 1.16 | 0.93 | R387a | 2.16 | 1.60 | 1.01 | |
| N813 | 2.20 | 1.11 | 0.85 | R387b | 2.12 | 1.27 | 0.91 | |
| N1553 | 2.27 | 1.22 | 0.97 | R210a | 2.02 | 0.58 | 1.01 | |
| N1549 | 2.26 | 1.22 | 1.00 | R210b | 2.90 | 1.45 | 0.99 | |
| N1571 | 2.16 | 1.15 | 0.94 | R187b | 2.02 | 0.71 | 1.07 | |
| N2865 | 1.69 | 1.12 | 0.80 | R225a | 2.38 | 0.89 | 1.03 | |
| N2945 | 2.24 | 1.24 | 1.00 | R225b | 2.50 | 0.80 | 1.00 | |
| N5018 | 1.96 | 0.99 | 0.82 | R397b | 2.62 | 1.23 | 1.00 | |
| E2400100a | 2.31 | 1.18 | 0.97 | |||||
| E2400100b | 2.01 | 1.24 | 0.88 | |||||
5 The blue indices diagnostic
In this section we compare the results of our simulations with the data for real galaxies making use of two diagnostic planes. i.e. H+K(CaII) vs. H/FeI and H+K(CaII) vs. 4000, displayed in Figs.5 and 6, respectively.
The galaxy data are from the catalog of Longhetti et al. (1998a) further selected by choosing only those objects with index H+K(CaII) measured with less than 0.25 units of error. Due to the low S/N in the blue part of the spectrum of some galaxies, only 18 shell galaxies and 16 pair members pass the scrutiny. The basic data for this sub-sample of objects is presented in Table 4.
The models (dashed lines) superposed to data in Figs. 5 and 6 refer to the solar metallicity and show the expected values for the three indices in post-star-burst galaxies. All lines start from a common origin which is the locus in these diagrams of the host quiescent galaxy (15 Gyr old and solar metallicity). The indices of this reference galaxy are H+K(CaII)1.21, H/FeI1.12 and 40002.32. Each line refers to a specific age of the burst event as annotated along the curves. Moving from the common origin, along each line what is varying is the percentage of mass turned into stars during the burst event. The percentage increases moving from the origin to the blue end of each curve. This in fact represents the case of a 100% young galaxy with the age indicated.
In these diagrams, an old quiescent galaxy suffering from a burst of star formation would soon leave the original place and move toward the blue corner up to a maximum location dictated by the percentage of newly born stars. As soon as the burst is over and the new stellar component start aging, the galaxy goes back to it original place. Once about 3 Gyr have elapsed, the current position is virtually indistinguishable from the original one (see also the run of the three indices as a function of the age in Fig. 3).
The remarkable novelty showing up both in Figs. 5 and 6 is the different distribution of the shell and pair galaxies. In fact, while shell galaxies fall in the region covered by the theoretical models, pair galaxies have a much broader distribution.
The large error bars affecting the data (in particular the index H/FeI) do not allow us to derive any specific conclusion about the age and intensity of the secondary episode of star formation for individual galaxies. The diagnostic diagrams have to be interpreted only in a statistical sense.
Recalling that old galaxies suffering from a secondary burst of star formation perform the loop in the diagnostic diagrams away from the quiescence position on a rather short time scale (which in turn depends on the amount of mass engaged in the burst), the different behavior of shell and pair galaxies can be explained if the bursting episode in the former is statistically older than in the latter.
This is also somehow hinted by the large value of H+K(CaII), larger than 1.2, that some pair galaxies reach. Such high values of H+K(CaII) are expected only if the index is contaminated by the H emission line (see below for more details). Therefore, the distribution of pair galaxies in the two diagnostic planes is statistically indicative of ongoing star formation. In contrast, the distribution of shell galaxies seem to suggest that the secondary star forming episode is on the average older than 1 Gyr.
We have checked that the above conclusions are not affected by the age adopted for the host galaxy at quiescence. Indeed similar results hold assuming for this object ages of 12 and 18 Gyr.


5.1 Effect of Line Emission
In order to support our preliminary suggestion that values of H+K(CaII) higher than 1.2 are indicative of contamination by the H emission line and hence ongoing star formation, we have analyzed the spectroscopic atlas by Kennicutt (1992).
It contains 55 local galaxies, well distributed among the different morphological types. Table 5 reports the results of our measurements of the H+K(CaII) and 4000 indices for this sample. All peculiar and irregular galaxies have been excluded from the analysis.
The resolution of the Kennicutt (1992) spectra is between 5Å and 8Å FWHM, slightly better than the one in usage here. While 4000 is not expected to depend on the spectral resolution and/or velocity dispersion, H+K(CaII) tends to increase as the spectral lines get wider. However, the expected increase in H+K(CaII), passing from the spectral resolution of Kennicutt (1992) data to ours, is very small and within statistical errors.
From the entries of Table 5, the mean value of the index H+K(CaII) for early–type galaxies (E+S0) is 1.19 ( 0.16). In galaxies of later types the index gets smaller. H+K(CaII) indeed decreases in stellar systems richer in A0-type stars, i.e. stellar systems with active star formation. Interestingly enough, the value of H+K(CaII) in post-star-burst models with solar (Figs. 5 and 6) and non solar metallicities (not shown here for the sake of brevity) agrees with the maximum observational value .
In contrast, the bottom panels of Figs. 5 and 6 show some pair members (RR210b, RR381a, RR387a, RR387b and RR397b) characterized by values of H+K(CaII) 1.3. This means that the strength of the blend of H(CaII) with the Balmer line H is lower than expected.
The only possible explanation of this fact is to consider the contamination of the H absorption line by the corresponding emission line.
It is worth noticing that none of the above 5 galaxies shows a clear H emission line. Although the H emission line is expected to have a lower absolute intensity with respect to that of the H line, its influence on the H+K(CaII) index could be greater than that of H on the corresponding absorption feature. Then a small variation in the intensity of the H absorption line caused by the corresponding emission component could be more easily revealed in the H+K(CaII) index, thus making it a good indicator of star formation.
5.2 Effects of the Metallicity
We have also calculated two grids of post-star-burst models with metallicities different from the solar value. The results are shown in Fig. 7. As explained in § 3, models of non solar metallicity represent only a first order approximation because of the incomplete dependence of our simulations on this parameter (only in the isochrones and not in the library of stellar spectra). The new models are, however, much similar to the case of solar metallicity presented above, even though they differ in some details.
(i) The reference galaxy of 15 Gyr age and the loci of the bursting galaxies shift to bluer and redder indices passing from solar to and , respectively. In more detail, for the reference galaxy has indices H+K(CaII)1.17, H/FeI0.82 and 40002.05, whereas for it has H+K(CaII)1.23, H/FeI1.18 and 40002.55. All the paths of the bursting galaxies are accordingly shifted.
(ii) In the H+K(CaII) vs. H/FeI plane, different metallicities produce almost the same loci for the post-star-burst galaxies.
(iii) A significantly larger variation is seen in the H+K(CaII) vs. 4000 plane.
(iv) As compared to the observational data, the models are too blue, whereas the ones are too red but still marginally compatible.
Given the adopted approximation and the uncertainty in the data (see the error-bars) we cannot contrive the mean metallicity of galaxies from their location in the diagnostic planes H+K(CaII) vs. H/FeI and H+K(CaII) vs. 4000. Nevertheless, the results shown in Figs. 5, 6 and 7 hint that the solar metallicity is perhaps suited to represent the mean value in early-type galaxies. Similar conclusions have been reached by Bressan et al. (1996), Greggio (1996) and Longhetti et al. (1998c) analyzing the position of early-type galaxies in the H vs. [MgFe] diagram.
| Class | 4000 | H+K(CaII) |
| E+S0 | ||
| Sa | ||
| Sb | ||
| Sc |

6 Summary and concluding remarks
Adopting the medium resolution spectral library obtained by J84 and the SSP models by Bressan et al. (1994, 1996) and Tantalo et al. (1996) we have calculated three narrow band indices in the spectral range 4200Å, namely H+K(CaII), H/FeI and 4000, as a function of age and metallicity.
With the aid of these results, we simulated post-star-burst galaxies by means of the simple recipe: an old host galaxy (with age of 15 Gyr and solar composition) to which at some arbitrary age a burst of star formation is added. The intensity of this is measured by the percentage of mass with respect to the total which is turned into stars by the burst episode.
We have shown that the line strength indices H+K(CaII), H/FeI and 4000 respond to even small traces of past star formation activity. In particular, we have discussed the sensitivity of H+K(CaII) to the ongoing star formation events due to the contamination of the Balmer H emission line.
From the analysis of the location of shell and pair galaxies on the diagnostic planes based on the indices H+K(CaII), H/FeI and 4000 we may advance some suggestions, whose validity is, however, of mere statistical nature owing to the large uncertainty still affecting the data.
-
1.
Shell galaxies and early-type galaxies members of pairs in the diagrams show different distributions in the 4000 vs. H+K(CaII) and H/FeI vs. H+K(CaII) planes.
-
2.
In shell galaxies, the age of the last star forming event goes from 0.1 to several Gyr and involves different percentages of mass. If the last burst of stellar activity that affects the line strength indices, correlates with the dynamical mechanism, i.e. merger or weak interaction, forming the shell features, in such a case these latter are long lasting phenomena.
-
3.
The distribution of early–type galaxies members of pairs suggests that the vast majority of them contain a very young stellar component (between 0.1 and 1 Gyr), i.e. they suffer from a very recent burst of star formation.
Let us now discuss the above results in the context of dynamical models of galaxy interaction, having in mind that the formation of shell structures of long duration is a sort of constraint hinted by the observational data.
Among the N-body and/or SPH dynamical models dealing with the formation of shells, merger models are in general unable to produce shells of long duration. Dupraz & Combes (1986) may produce shells that last longer than in other merger models (Quinn 1984; Hernquist & Quinn 1989), depending on the initial conditions. However these models fail in predicting the radial distribution of shells in the best studied shell galaxies. Only the inclusion of the dynamical friction (Dupraz & Combes 1987), that slows down the merging process between the two galaxies, may produce long lasting shells with the correct distribution. Nevertheless, these models predict also the presence of a double nucleus in the galaxy hosting the shells. Noteworthy, in the present sample of shell galaxies only ESO 240-100, out of twenty objects, is characterized by the presence of a double nucleus.
Furthermore, SPH simulations of mergers by Weil & Hernquist (1993) show that during the shell structure phase, a large fraction of the gas content (if present) falls soon onto the nucleus whereby star formation is likely to occur. In these models shells are as old as the last central star forming event. Similar predictions are found in the models by Kojima and Noguchi (1997), in which the time delay between the end of the star-burst and the shell formation is very short ( Gyr). This prediction hardly matches the occurrence of shell structures and relatively old star-bursts indicated by line strength diagnostic.
Alternatively, dynamical models producing shells via weak interaction event (Thomson & Wright 1990, Thomson 1991) predict much longer lifetimes for the shells up to Gyr. This type of model requires, however, the presence of a thick disc structure in the host early-type galaxy. Furthermore, shells do not develop if the galaxies experience multiple interactions.
Rampazzo et al. (1998b) analyzed the isophotal structure of pair galaxies in our sample and found that a large fraction of them show a disc-like structure. Therefore, if the interaction generating shells is the weak interaction mechanism of Thomson & Wright (1990) and Thomson (1991), we would expect to see them associated to pair galaxies where the disc-like structure is often present. Among the pair galaxies of our sample, only a few possess shell structures, namely RR 225a, RR 225b and RR 278a to which the system NGC 1549+NGC 1553 (the difference among the two systemic velocities is 31 km s-1: Longhetti et al. 1998b) in the Dorado group can be added.
Finally, let us comment on the observational hint that despite the large uncertainty affecting the indices we have derived, many pair galaxies seem to be characterized by very young bursts.
Among others, RR278a is particularly remarkable as it has the H+K(CaII) index as high as 1.95 and most likely H lines in emission, suggesting ongoing star formation. Another interesting case is NGC 1553 in the center of which Trinchieri et al. (1997), using narrow band imaging, have found H emission. Longhetti et al. (1998a,b) did not detect H emission probably because it was too faint or it was filling the absorption feature. If so, also the value of the H+K(CaII) line may be contaminated by H in emission. It follows from all this that burst in NGC 1553 could be as recent as in pair galaxies with shells.
What the implications are as far as the star formation history in pair galaxies is concerned?
Prior to any other consideration, one has to clarify the question whether the pair galaxies in question are bound or unbound systems. The criteria used to select pairs of galaxies are designed to isolate objects whose interaction potential energy is by far larger than that with any other nearby galaxy. Nevertheless, there remains the controversial problem of the relative percentage of bound vs. unbound pairs (see e.g. Junqueira & de Freitas Pacheco 1994 and reference therein).
In recent years, efforts have been made to disentangle the problem of the physical reality of pairs by means of techniques different from the classical statistical methods. For instance, the X-ray diffuse background has been proposed as a probe of the gravitational potential well and physical reality of a pair/group in turn.
The NGC 2300 group, dominated by the pair NGC 2300/NGC 2276 (Mulchaey et al. 1993, 1996) and surroundend by X-ray diffuse background could be taken as an example of a bound system. In contrast, the absence of an X-ray diffuse background in K 416 pair of galaxies (Rampazzo et al. 1998a), the analog of NGC2300 as far as morphology is concerned, suggests this system is an unbound encounter.
In this context, the fact that the majority of pair members in our sample underwent a recent star formation event (in some of them even going on now) suggests that either large reservoirs of gas must be present to maintain active star formation (if these galaxies are bound systems on periodic orbits) or most of the pair galaxies in the sample are experiencing unbound encounters and undergo an occasional (perhaps unique) burst of stellar activity.
Acknowledgements.
ML acknowledges the kind hospitality of the Astronomical Observatories of Brera (Milan) and Padua during her PhD thesis and the support by the European Community under TMR grant ERBFMBI-CT97-2804. RR acknowledges the hospitality of the Asiago and Padua Astronomical Observatories where part of this study has been carried out. CC whishes to acknowledge the friendly hospitality and stimulating environment provided by MPA in Garching where this paper has been completed during leave of absence from the Astronomy department of the Padua University. ML, AB and CC acknowledge the support by the European Community under TMR grant ERBFMRX-CT96-0086.References
- (1) Barnes J., 1996, 26 Saas-Fee Advances Course.
- (2) Bertelli, G., Bressan, A., Chiosi, C., Fagotto, F., Nasi, E. 1994, A&A 106, 275
- (3) Bressan A., Chiosi C., Fagotto F., 1994, ApJS 94, 63
- (4) Bressan A., Chiosi C., Tantalo R., 1996, A&A 311, 425.
- (5) Buzzoni A. Gariboldi G., Mantegazza L., 1992, AJ 103, 1814
- (6) Buzzoni A. Mantegazza L., Gariboldi G., 1994, AJ 107, 513
- (7) Dupraz C., Combes F., 1986, A&A 166, 53
- (8) Dupraz C., Combes F., 1987, A&A 185, L1.
- (9) Garcia-Vargas M.L. 1991, PhD thesis
- (10) Gonzalez, J.J 1993, Ph.D. Thesis, University of California, Santa Cruz
- (11) Gorgas, J., Faber, S.M., Burstein, D., Gonzalez, J.J., Courteau, S., Prosser, C. 1993, ApJS 86, 153
- (12) Greggio L., 1996, MNRAS 285, 151
- (13) Hamilton D., 1985, ApJ 297, 371
- (14) Hernquist L., Quinn P.J., 1989, ApJ 342, 1
- (15) Huchra J., 1977 ApJ 217, 928
- (16) Idiart T.P., de Freitas Pacheco J.A., 1995, AJ 109, 2218
- (17) Jacoby G.H., Hunter D.A., Christian C.A., 1984, ApJS, 56, 257: J84
- (18) Junqueira S., de Freitas Pacheco J.A., 1994, AJ 108, 1627.
- (19) Kennicutt, R. 1992, ApJS 79,255
- (20) Kojima, M., Noguchi, M. 1997, ApJ 481, 132
- (21) Kurucz R.L., 1992, In Stellar Populations of Galaxies, eds. B. Barbuy and A. p. 225, Dordrecht: Kluwer Academic Publishers
- (22) Larson R.B., 1974, MNRAS 166, 585
- (23) Larson, R.B., Tinsley B.M., 1978, ApJ 219, 46
- (24) Leonardi A.J., Rose J.A., 1996, AJ, 111, 182
- (25) Longhetti M., Rampazzo R., Bressan A., Chiosi C., 1998a, A&AS 130, 251
- (26) Longhetti M., Rampazzo R., Bressan A., Chiosi C., 1998b, A&AS 130, 267
- (27) Longhetti M., Bressan A., Chiosi C., Rampazzo R., 1998c, A&A submitted
- (28) Malin D.F., Carter D., 1983, ApJ 274, 534
- (29) Mulchaey J.S., Davies D.S., Mushotzky R.F., Burstein, D., 1993, ApJ 404, L9
- (30) Mulchaey J.S., Davies D.S., Mushotzky R.F., Burstein D., 1996, ApJ 456, 80
- (31) Quinn P.J., 1984, ApJ 279, 596
- (32) Rampazzo R., Covino S., Trinchieri G., Reduzzi L., 1998a, A&A 330, 423
- (33) Rampazzo R., D’Onofrio, M., Bonfanti, P., Longhetti, M., Reduzzi, L. 1998b, A&A, 341, 357.
- (34) Reduzzi L., Longhetti M., Rampazzo R., 1996, MNRAS 282, 149
- (35) Rose J.A., 1984, AJ 89, 1238
- (36) Rose J.A., 1985, AJ 90, 1927
- (37) Schweizer F., 1992, In Structure, dynamics and chemical evolution of elliptical galaxies, eds. I. J. Danziger, W.W. Zeilinger, K. Kjar, p. 651 Dordrecht: Reidel
- (38) Tantalo R., Chiosi C., Bressan A., Fagotto F., 1996, A&A 311, 361
- (39) Tantalo R., Chiosi C., Bressan A., Marigo P., Portinari L., 1998, A&A 335, 823
- (40) Thomson R.C., 1991, MNRAS 253, 256
- (41) Thomson R.C., Wright, 1990, MNRAS 217, 122
- (42) Trinchieri G., Noris L., di Serego Alighieri S. 1997, A&A 326, 565
- (43) van den Bergh S., 1963, AJ 68, 413
- (44) van den Bergh S., Sackman J. 1965, AJ 70, 352
- (45) Weil, M.L., Hernquist, L. 1993, ApJ 405, 142
- (46) Worthey G., 1992, Ph.D. Thesis, University of California, Santa Cruz
- (47) Worthey G., Faber S.M., Gonzalez J.J., Burstein D., 1994, ApJS 94, 687