The Massive Stellar Content in Starburst Galaxies and its Impact on Galaxy Evolution
Abstract
Starburst galaxies are powered by massive stars. These stars dominate the heating and enrichment with heavy elements of the interstellar medium, gas out of which new stars form. Thus, high-mass stars, and in consequence starburst galaxies, are an important (in some cases the dominant) energy source for the evolution of galaxies and the universe. In this contribution I review techniques to derive the massive stellar content in starburst galaxies and their evolutionary state. They are based on the analysis of their integrated light with evolutionary synthesis models. The massive stellar population is derived in a self-consistent way using the continuum and stellar wind resonance lines in the ultraviolet, the photospheric H Balmer and HeI lines and the nebular emission lines at optical wavelengths. Comparison with observations provides constraints on the most recent star formation history in starburst galaxies and their evolutionary state.
Instituto de Astrofísica de Andalucía (CSIC), Apdo. 3004, 18080 Granada, Spain. rosa@iaa.csic.es
1. Starburst Galaxies and its Cosmological relevance
Massive stars are defined as having masses higher than 10 M when they are at the zero age main sequence (ZAMS). They are very luminous and dominate the heating of the interstellar medium (ISM), gas out of which new stars form. They emit photons that can ionize the surrounding interstellar gas and deposit mechanical energy both via stellar winds and supernovae. Most of the heavy elements are formed in massive stars, and these metals are dispersed in the ISM when these stars finally explode as supernova. Therefore, massive stars are an important source (sometimes the dominant one) for the evolution of a galaxy. Massive stars are formed in the arms of normal spiral galaxies. However, the star formation rate is low ( 1 M yr-1) and the gas available in these galaxies is enough to sustain the rate for many Gyr. On the contrary, much higher rate of star formation occurs in the galaxies know as starburst galaxies.
A starburst is defined as a brief episode of intense star formation that is taking place in small regions (100 to 1000 pc) of the galaxy and dominates the overall luminosity of the galaxy (Weedman 1983; Heckman 1998). The star formation rate is so high (10-100 M yr-1 and in some cases up to 1000 M yr-1) that galaxies can be in this phase only for a small fraction of the age of the universe (108 yr) because the gas available in these galaxies cannot sustain this rate for a longer time. This definition covers galaxies with a very wide range of properties, from blue compact dwarfs, nuclear starbursts to ultraluminous IRAS starbursts. Even giant HII regions as 30 Doradus can be considered as a mini starburst. Typical masses (bolometric luminosities) range from 106 to 1010 M (109 to 1014 L), corresponding the lowest limit to the mass of super-star-clusters and the highest limit to the mass of the infrared-luminous galaxies (Leitherer 1996). Starburst galaxies are ideal laboratories in which to explore fundamental questions about the local and global processes and effects of star formation. For example, is the initial mass function the same in starburst galaxies as in quiescent star formation in the Milky Way? Is there a connection between starburst activity and active galactic nuclei? What can starbursts teach us about the process by which the first galaxies formed?
Starbursts are a significant energy source of our local universe. The four most luminous circumnuclear starburst (M 82, NGC 253, M 83 and NGC 4395) can account about 25 of the high mass star formation rate in a volume of 10 Mpc radius from us (Heckman 1997). Starbursts play also an important role in the understanding of the formation and evolution of galaxies when the universe was very young. In the last three years, a significant population of normal star-forming galaxies have been discovered at redshift higher than 2. Most of these galaxies were discovered with the Lyman-break technique (Steidel et al 1996; Lowenthal et al 1997), and a few of them serendipitously (e.g. Yee et al 1996; Ebbels et al 1996). They are considered to be precursors of typical present-day galaxies in an early actively-star-forming phase. One of the best case studied until now is the galaxy MS 1512-cB58 (Yee et al 1996), a galaxy at z=2.723 which is gravitational lensed. Its ultraviolet (UV) spectrum shows high ionization absorption features (CIV 1540 and SiIV 1400) formed in the stellar winds of massive stars (Pettini et al 1997); these characteristics are very similar to local starbursts so that it can be classified as a starburst galaxy. Due to this similarity, local starburst galaxies can be considered as benchmark objects to understand the massive star formation in the early stage of the formation of the universe.
Therefore, to study in detail local starbursts can help to understand how the star formation proceeded in the early stages of the universe. In this paper, I review three techniques that can be used to estimate the evolutionary state of the starbursts and their massive stellar content. They are based on the spectral morphology of the integrated light of a starburst at ultraviolet and optical wavelengths, and on the concept of the evolutionary synthesis technique.
2. The Concept of Evolutionary Synthesis Technique.
Nearby starbursts are at distances that individual stars are not detected. One of the closer starburst is in the super star clusters in the irregular galaxy NGC 1569 (Arp & Sandage 1985). The typical size of these super star clusters is about 1 pc (O’Connell, Gallagher & Hunter 1994), that a distance of 2.5 Mpc has an angular size less than 0.1 arcsec. Therefore, the stellar content has to be determined through the analysis of the integrated light of the whole starburst.
One powerful tool for interpreting the integrated light of starbursts is the evolutionary synthesis, that was introduced by Tinsley (1968). This technique makes a prediction for the synthetic spectrum of a stellar population taking as a free parameter the star formation history of the starburst (age, initial mass function, star formation rate, etc). The basic ingredients are: (i) stellar evolutionary tracks; (ii) spectral libraries, either empirical spectra or theoretical model atmospheres. The way that the technique works is this: (i) initally the population of stars is distributed along the ZAMS according to an initial mass function (IMF); (ii) the evolution of the stars from the ZAMS until they become insignificant in their energy production is followed; (iii) the spectrum of each star is computed; (iv) the resulting spectrum is obtained adding for each epoc the contribution of each of the stars. Thus, the spectrum and other related observables (colors, luminosities, number of ionizing photons, supernova rate, etc) are predicted. If there is agreement between the observations and the predicted physical properties, constraints on the star formation history (in timescales between 1 Myr to several Gyr) can be determined (see e.g. Mas-Hesse & Kunth 1991; Bruzual & Charlot 1993; Leitherer & Heckman 1995). However, the solution obtained with this technique may not be unique, and only consistency between models and observations can be derived. The power of the technique is very dependent on the reliability of the stellar models used as ingredients.
One important question related with this technique is whether evolutionary synthesis models, and the stellar evolution models they incorporate, are actually up to the challenge of interpreting multi-wavelength data. To answer this, I will present a multi-wavelength study of the starburst galaxy NGC 7714.
3. The Spectral Morphology of a Starburst.
Starburst galaxies are characterized by showing a nebular emission line spectrum at optical and an absorption line spectrum at ultraviolet wavelengths. This is called ”the spectral dichotomy picture of a starburst galaxy” (Leitherer 1997). This picture reflects that starbursts are powered by massive stars. These stars emit photons with energies of a few tens of eV which are absorbed and re-emitted in their stellar winds, producing ultraviolet resonance transitions, and then, an ultraviolet absorption line spectrum (Figure 1a). However, most of the ionizing photons emitted by the stars can travel tens of pc from them and be absorbed by the surrounding interstellar gas. Then, this ionized gas cools down emitting a nebular emission line spectrum, mainly at optical wavelengths (Figure 1b).
However, at the Balmer jump the spectra can show absorption features formed in the photosphere of massive stars. O, B and A stars can dominate the optical continuum emission of the starburst galaxies. The spectra of the early-type stars is characterized by strong hydrogen Balmer and neutral helium absorption lines with only very weak metallic lines (Walborn & Fitzpatrick 1990). However, the detection of these stellar features at optical wavelengths in the spectra of starburst galaxies is a difficult business because H and HeI absorption features are coincident with the nebular emission lines that mask the absorption features. Even so, the higher order terms of the Balmer series and some of the HeI lines are detected in absorption in many starburst galaxies (Storchi-Bergmann, Kinney & Challis 1995; González-Delgado et al 1995), in Seyfert 2 galaxies with their ultraviolet and optical continuum dominated by a nuclear starburst (Shields & Filippenko 1990; González Delgado et al 1998b; Cid Fernandes, Storchi-Bergmann & Schmitt 1998) or even in the spectra of giant HII regions (e.g. NGC 604, Terlevich et al 1996).
In the following sections I will show how to obtain information about the massive stellar content of starburst galaxies and their evolutionary state, based on the spectral morphology of these objects and using evolutionary synthesis models.

4. The Optical Emission Line Spectrum of a Starburst.
The emission line spectrum of a starburst depends on the radiation field from the ionizing stellar cluster, the electron density and chemical composition of the gas. These parameters are taken as input to a photoionization code, that resolves the ionization-recombination and heating-cooling balances, and predicts the ionization structure of the nebula, the electron density and the intensity of the emission lines. The evolutionary state of the starburst and the massive stellar content can be derived using the spetral energy distribution generated by a stellar evolutionary synthesis code as the radiation field. This technique has been applied very successfully to constrain the star formation history and the evolutionary state of extragalactic HII regions, starbursts (García-Vargas, Bressan, & Díaz 1995; Stasińska & Leitherer 1996; García-Vargas et al 1997; González Delgado et al 1999) and active nuclei of galaxies (Terlevich & Melnick 1985; Cid-Fernandes et al 1992).
I show how this technique works by applying it to the prototypical nuclear starburst NGC 7714 (Weedman et al 1981). The spectral energy distribution is generated by the evolutionary synthesis code developed by Leitherer and collaborators (Leitherer et al 1999). The code uses the most recent stellar evolutionary models of the Geneva group (Schaller et al 1992; Maeder & Meynet 1994), and the stellar atmospheres grid compiled by Lejeune et al (1996). The spectral energy distribution was generated using the 0.4 Z metallicity tracks because the chemical abundance derived from the emission lines in NGC 7714 is close to half solar (González-Delgado et al 1995), and assuming two different star formation scenarios (instantaneous burst and continuous star formation). In both cases, a Salpeter IMF with an upper and lower mass limit cut-off of 80 M and 1 M, respectively, was assumed.
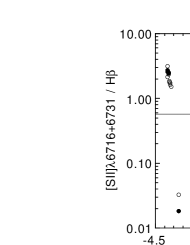
The spectral energy distribution is taken as input to the photoionization code CLOUDY (version 90.04, Ferland 1997). It is assumed that the nebular gas is ionization bounded and spherically distributed around the ionizing cluster with a constant density. The inner radius of the nebula is taken at 3 pc, but the outer radius is determined by the ionization front. The chemical composition of the gas is fixed to the values calculated from the optical emission lines, and the ionizing photon luminosity is fixed to log(Q)=52.9 ph s-1, as derived from the Balmer recombination lines. Models are computed taking the filling factor as a free parameter. The change in the filling factor is equivalent to changing the ionization parameter U, defined as Q/(4RsNec); where Q is the ionizing photon luminosity, Ne the electron density, c the speed of light and Rs the Strömgren radius. The average U is proportional to ( Ne Q)1/3, where is the filling factor. First, the ionization parameter is derived using the ratio [SII]6716+6731/H. This ratio is a good calibrator of U for continuous star formation and for burst models (Figure 2a). The observed ratio indicates an ionization parameter of -2.9, corresponding to a filling factor of 0.001. Then, the other emission lines can constrain the star formation scenario (burst or continuous star formation) and the age of the starburst (Figure 2b). Thus, photoionization models predict that the nuclear starburst in NGC 7714 was formed instantaneously 4.5 Myr ago.
5. The Ultraviolet Absorption Line Spectrum of a Starburst.
A second independent method that can be used to constrain the star formation history and the evolutionary state of a starburst is based on the profile of the ultraviolet wind resonance lines. Massive hot stars develop strong stellar winds due to radiation pressure in ultraviolet resonance lines (Morton 1967). Typical wind velocities in O stars are about 2000 km s-1 to 3000 km s-1 (Groenewegen, Lamers & Pauldrach 1989). As a result, all strong ultraviolet lines in the spectra of O stars originate predominantly in the outflow, and have blueshifted absorptions. The profile shapes reflect the stellar mass-loss rates, which are a strong function of the stellar luminosity (Castor, Abbott & Klein 1975). Since there exists a well-defined stellar mass-luminosity relation, the line profiles ultimately depend on the stellar mass, and, for a stellar population, on the IMF and SF history.
The strongest stellar wind resonance features are OVI 1034, NV 1240, SiIV 1400 and CIV 1550. In massive stars, these lines form above in the stellar wind, as a blueshifted absorption in stars with weak winds, or as a P Cygni profile if the wind density is sufficiently high. OVI and CIV are strong lines in O stars of all luminosity classes (Walborn, Bohlin & Panek 1985; González Delgado, Leitherer & Heckman 1997a). In contrast, SiIV is luminosity dependent, and only blue supergiant stars produce a strong P Cygni profile (Walborn et al 1985). The recombination line HeII 1640 can also be formed in very massive O and WR stars with very dense winds. Evolutionary synthesis models show that the profile of these lines depend on the IMF parameters and the evolutionary state of the starburst (Leitherer, Robert & Heckman 1995; González Delgado et al 1997a). This technique has been succesfully applied to starburst galaxies (Conti, Leitherer & Vacca 1996; Leitherer et al 1996; González Delgado et al 1998a; González Delgado et al 1999) and Seyfert galaxies (Heckman et al 1997; González Delgado et al 1998b). In all these cases, the method has constrained the age and the mass spectrum of the young population. In next section I apply this technique to the nuclear starburst of NGC 7714.
5.1. The nuclear starburst in NGC 7714.
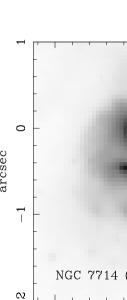
The nucleus of NGC 7714 was observed with HST+GHRS with square aperture of 1.741.74 arcsec2 and with a dispersion of 0.57 Å/pix. Figure 3a shows the nuclear morphology of the central 2 arcsec of the starburst. The spectrum shows resonance lines formed in the interestellar medium of the galaxy (e.g. SiII 1260, OI 1302, CII 1335, SiII 1527, FeII 1608 and AlII 1607) and in the winds of massive stars (NV 1240, SiIV 1400, CIV 1540 and HeII 1640). Fitting the profile of the SiIV and CIV lines with the evolutionary synthesis models, it is found that the profiles of these lines are compatible with an instantaneous burst 5 Myr old (Figure 3b). Thus, this technique can constrain the evolutionary state of the starburst giving the same result as the fit of the emission line spectrum.
The ultraviolet continuum luminosity can also be used to estimate the bolometric luminosity and the mass of the starburst, but first an estimation of the extinction is required. Evolutionary synthesis models also show that the ultraviolet energy distribution arising from a starburst has a spectral index, , in the range -2.6 to -2.2 (F ), if the burst is less than 10 Myr old (Leitherer & Heckman 1995). This spectral index is rather independent of the metallicity and IMF. Therefore, any deviation from the predicted spectral index can be attributed to reddening. The spectral index derived from the UV spectrum of NGC 7714 indicates that the internal extinction in the nuclear starburst of NGC 7714 is low (E(B-V)=0.03) and the luminosity derived at 1500 Å is 1039.9 erg s-1 Å-1. This luminosity is produced by a starburst of 5-10106 M and bolometric luminosity 5-10109 L. The HeII 1640 luminosity indicates a stellar population of 2000 Wolf-Rayet stars. Models predict a nuclear supernova rate of 0.001 yr-1, which is two orders of magnitud lower than the value estimated previously based in the X ray emission of the whole galaxy (Weedman et al 1981). That rate is about the same as the disk-integrated rate observed in normal spirals. However, what distinguishes NGC 7714 and other nuclear starbursts is the concentration of supernova events in the nucleus.
We conclude that evolutionary synthesis models are able to interpret multi-wavelength data of starbursts because the two techniques applied here to the nucleus of NGC 7714 give the same solution.
6. The Hydrogen Balmer and HeI absorption lines.
Signatures of massive stars are also detected in the near-ultraviolet spectra of starbursts (Figure 1b) and in the nuclear spectra of Seyfert 2 galaxies (Figure 4). These features can be seen in absorption because the strength of the Balmer serie in emission decreases rapidly with decreasing wavelength, whereas the equivalent width of the stellar absorption lines is constant or encreases with wavelength. Thus, the net effect is that H, H and H are mainly seen in emission, but the higher order terms of the Balmer series are seen in absorption. Very often, H, H, H and H show absorption wings over-imposed on the nebular emission and a similar effect can occur for the HeI lines. The strongest nebular emission occurs in the HeI 5876 and HeI 6678 whereas the stellar absorption features are very weak. Meanwhile, the equivalent width of the nebular emission of HeI 4471 and HeI 4026 ( 6 Å, Izotov, Thuan & Lipovetsky 1997) is similar or even smaller than He stellar absorption lines; thus, they can be easily detected in absorption.
Therefore, evolutionary synthesis models that predict the strength of the photospheric H Balmer and HeI lines can also be used to study the evolutionary state and star formation history of starburst galaxies.

6.1. The stellar library.
It is built with synthetic spectra covering five spectral ranges between 3700 and 5000 Å. The spectra include the profiles of the Balmer (H13, H12, H11, H10, H9, H8, H, H and H) and HeI (3819, 4009, 4026, 4120, 4144, 4387, 4471, 4922, and 5876) lines with a sampling of 0.3 Å. The grid spans a range of effective temperature 50000 K Teff 4000 K, and gravity 0.0 log g 5.0 at solar metallicity. For Teff 25000 K, NLTE stellar atmosphere models are computed using the code TLUSTY (Hubeny 1988). These models together with Kurucz (1993) LTE stellar atmosphere models (for T 25000 K) are used as input to SYNSPEC (Hubeny, Lanz & Jeffery 1995), the program that solves the radiative transfer equation. Finally, the synthetic spectrum is obtained after performing the rotational and instrumental convolution.
6.2. The Evolutionary Synthesis Models of the H and HeI lines.
This library is used as input to an evolutionary synthesis code (Starburst 99, Leitherer et al 1999). The models are optimized for galaxies with active star formation and they predict the strength of the H Balmer and He I lines for a burst with an age ranging from 106 to 109 yr, and different assumptions about the IMF. Continuous star formation models lasting for 100 Myr are also computed.
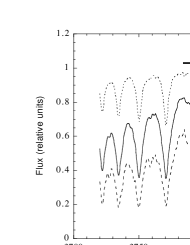
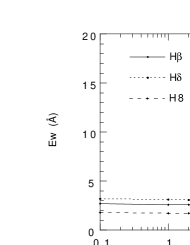
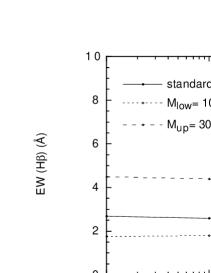
It is found that the Balmer and HeI line profiles are sensitive to the age (Figure 5), except during the first four Myr of the evolution, when the equivalent widths of these lines are constant (Figure 6). At these early stages of the evolution, the lines profiles are also sensitive to the IMF (Figure 7). However, strong H Balmer and HeI lines are predicted even when the low mass cut-off of the IMF is as high as 10 M. The equivalent width of the Balmer lines ranges from 2 to 16 Å and the HeI lines from 0.2 to 1.2 Å. During the nebular phase (cluster younger than about 10 Myr), H ranges from 2 to 5 Å and HeI 4471 between 0.5 and 1.2 Å. The strength of the lines is maximum when the cluster is a few hundred (for the Balmer lines) and a few ten (for the HeI lines) Myr old. In the continuous star formation scenario, the strength of the lines increases monotonically with time; however, the lines are weaker than in the burst models due to the dilution of the Balmer and HeI lines by the contribution from very massive stars.
These models can be used to date starburst and post-starburst galaxies until 1 Gyr. Due to the high spectral resolution of the profiles it is possible to reproduce the absorption wings observed in regions of recent star formation, to estimate the effect on the nebular emission lines by underlying absorption and the evolutionary state of the starburst.
6.3. Dating Super Stars Clusters.
In this section, I show how to date the evolutionary state of super star clusters (SSCs) using synthesis profiles of the H and HeI lines. SSCs are characterized to be very luminous and compact objects. There are suggestions that indicate SSCs represent the present-day analogs of young globular clusters because they have masses and luminosities comparable to those of evolved globular clusters in the Milky Way (Ho & Filippenko 1996; O’Connell, Gallagher & Hunter 1994). They represent the basic mode of star formation in starburst galaxies and are the building blocks of these objects. The clusters can be aproximated by a coeval and single metallicity stellar population.
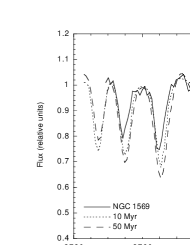
Two of the closest SSCs are in the dwarf irregular galaxy NGC 1569. HST images of NGC 1569, suggest that the SSC B has an age of 15-300 Myr (O’Connell et al 1994) and ground-based optical spectra suggest an age of 10 Myr (González Delgado et al 1997b). The last result is based on the analysis of the optical spectral energy distribution and on the strength of the CaII triplet (see also Prada et al 1994). To test these models, I have compared the synthetic profiles of the Balmer lines with the observations. The Balmer lines are partially filled with nebular emission; therefore the fitting has to be done based on the wings of the absorption features. This effect is less important for the higher terms of the Balmer series because the nebular emission drops quickly with decreasing wavelength. Figure 8 plots the observed lines and the synthetic models for a burst of 10 and 50 Myr at Z/4 metallicity (assuming Salpeter IMF, Mlow=1 M and Mup=80 M). The profiles indicate that the Balmer lines are more compatible with a burst of 10 Myr old than with the 50 Myr old. Ages older than 10 Myr produce profiles which are wider than the observed one. This comparison confirms the result of González Delgado et al (1997b) that the age of the SSC B is about 10 Myr and shows that this technique can discriminate well between a young and an intermediate age population, and to estimate the evolutionary state of SSCs.
7. Summary
A starbursts is a brief episode of intense star formation that is taking place in a small region of a galaxy and dominates its overall luminosity. Most of the radiative properties of the starburst galaxies are determined by their massive stellar content. High-mass stars are responsible for the spectral morphology of a starburst that shows a nebular emission line spectrum at optical and an absorption line spectrum at ultraviolet wavelengths. Nearby starburst galaxies are considered as local analogs of active star forming galaxies at high redshift. Thus, nearby starbursts are very good laboratories to explore spectroscopic techniques than can be later to apply in high redshift galaxies to derive their massive stellar content and their evolutionary state. I have reviewed several techniques based on evolutionary synthesis models that predict the stellar wind resonance lines at ultraviolet, the photospheric H Balmer and HeI lines and the nebular emission lines at optical wavelengths. The three techniques are able to constrain the star formation history in nearby starbursts and to predict their content in massive stars and their evolutionary state.
8. Acknowledgement
I would like to thank the organizers of this conference, in particular John Beckman and Mónica Murphy, for their financial support and for making this meeting enjoyable, and to my collaborators Marisa García Vargas and Claus Leitherer for their important contributions to the realization of several parts of this work. This work was supported by the Spanish DGICYT grant PB93-0139.
References
Arp, A., & Sandage, A. 1985, AJ, 90, 1163
Bruzual, A.G., & Charlot, S. 1993, ApJ, 405, 538
Castor, J.I., Abbot, D.C., & Klein, R.I. 1975, ApJ, 195, 157
Cid Fernandes, R., Dottori, H. A., Gruenwald, R. B., & Viegas, S.M. 1992, MNRAS, 255, 165
Cid Fernandes, R., Storchi-Bergmann, T., & Schmitt, H. 1998, MNRAS, 297, 579
Conti, P.S., Leitherer, C., & Vacca, W.D. 1996, ApJ, 461, L87
Ebbels, T.M.D., Le Borgne, J.-F., Pelló, R., Ellis, R.S., Kneib, J.-P., Smail, I., & Sanahuja, B., 1996, MNRAS, 281, L75
Ferland, G.J. 1997, Hazy, a Brief Introduction to CLOUDY, University of Kentucky, Deparment of Physiscs and Astronomy Internal Report
García-Vargas, M.L., González-Delgado, R.M., Pérez, E., Alloin, D., Díaz, A.I., & Terlevich, E. 1997, ApJ, 478, 112
García-Vargas, M.L., Bressan, A. & Díaz, A. 1995, A&AS, 112, 35
González Delgado, R.M., García-Vargas, M.L., Goldader, J., Leitherer, C., Pasquali, A. 1999, ApJ, 513, in press
González Delgado, R.M., Heckman, T., Leitherer, C., Meurer, G., Krolik, J, Wilson, A.S., Kinney, A.L., & Koratkar, A. 1998b, ApJ, 505, 174
González Delgado, R.M., Leitherer, C., & Heckman, T. 1997a, ApJ, 489, 601
González Delgado, R.M., Leitherer, C., Heckman, T., & Cerviño, M. 1997b, ApJ, 483, 705
González Delgado, R.M., Leitherer, C., Heckman, T., Ferguson, H.C., Lowenthal, J.D., & Robert, C. 1998a, ApJ, 495, 698
González-Delgado, R.M., Pérez, E., Díaz, A.I., García-Vargas, M.L., Terlevich, E., & Vílchez, J.M. 1995, ApJ, 439, 604
Groenewegen, M.A.T., Lamers, H.J.G.L.M., & Pauldrach, A.W.A. 1989, A&A, 221, 78
Heckman, T.M. 1998, in Star Formation Near and Far, ed. S.S. Holt & L.G. Mundy (San Francisco: ASP), in press
Heckman, T.M., González-Delgado, R.M., Leitherer, C., Meurer, G.R., Krolik, J., Wilson, A., Kinney, A.L., & Koratkar, A. 1997, ApJ, 482, 114
Ho, L. C., & Filippenko, A. V. 1996, ApJ, 466, L83
Hubeny, I. 1988, Compt. Phys. Commmm., 52, 103
Hubeny, I., Lanz, T.,& Jeffery, C.S. 1995, SYNSPEC-A User’s Guide
Izotov, Y. I., Thuan, T. X., & Lipovetsky, V. A. 1997, ApJS, 108, 1
Kurucz, R.L. 1993, CD-ROM 13, ATLAS9 Stellar Atmosphere Programs and 2 km/s Grid (Cambridge: Smithsoniam Astrophys. Obs.)
Leitherer, C. 1996, From stars to galaxies: the impact of stellar physics on galaxy evolution, ed. C. Leitherer, U. Fritze-von Alvensleben & J. Huchra (San Francisco: ASP), 373
Leitherer, C. 1997, The ultraviolet universe at low and high redshift: Probing the progress of galaxy evolution, ed. W. H. Waller, M. N. Fanelli, J.E. Hollis & A. C. Danks, AIP Conference proceedings 408, 119
Leitherer, C., & Heckman, T.M. 1995, ApJS, 96, 9
Leitherer, C., Robert, C., & Heckman, T. M. 1995, ApJS, 99, 173
Leitherer, C., Schaerer, D., Goldader, J. D., González Delgado, R.M., Robert, C., Foo Kune, D., de Mello, D. F., Devost, D., Heckman, T. M. 1999, APJS, in press
Leitherer, C., Vacca, W.D., Conti, P.S., Filippenko, A.V., Robert, C., & Sargent W.L.W. 1996, ApJ, 465, 717
Lejeune, T., Cuisinier, F., & Buser, R. 1996, in From stars to galaxies: the impact of stellar physics on galaxy evolution, ed. C. Leitherer, U. Fritze-von Alvensleben & J. Huchra, (San Francisco ASP), p. 94
Lowenthal, J. D., et al, 1997, ApJ, 481, 673
Mas-Hesse, J.M., & Kunth, D. 1991, A&AS, 88, 317
Maeder, A., & Meynet, G. 1994, A&A, 287, 803
Morton, D. C. 1967, ApJ, 147, 1017
O’Connell, R., Gallagher, J., & Hunter, D. 1994, ApJ, 433, 65
Pettini, M., Steidel, C. C., Dickinson, M., Kellogg, M., Giavalisco, M., & Adelberger, K. L. 1997, in The Ultraviolet Universe at Low and High Redshift, ed. W. H. Waller, M. N. Fanelli, J. E.. Hollis, & A. C. Danks (Woodbury: AIP), 279
Prada, F., Greve, A., & McKeith, C. 1994, A&A, 288, 396
Sanders, D.B., & Mirabel, I.F. 1997, ARAA, 34, 749
Schaller, G., Schaerer, D., Meynet, G., & Maeder, A. 1992, A&AS, 96, 269
Shields, J.C., & Filippenko, A.V. 1990, AJ, 100, 1034
Stasińska, G., & Leitherer, C. 1996, ApJS, 107, 661
Steidel, C., Giavalisco, M., Pettini, M., Dickinson, M., Adelberger, K.L., 1996, ApJ, 462, L17
Storchi-Bergmann, T., Kinney, A., & Challis, P. 1995, ApJ, 98, 103
Terlevich, E, Díaz, A.I., Terlevich, R., González Delgado, R.M., Pérez, E., & García-Vargas, M.L. 1996, MNRAS, 279, 1219
Terlevich, R., & Melnick, J. 1985, MNRAS, 213, 841
Tinsley, B. M. 1968, ApJ, 151, 547
Walborn, N. R., Bohlin, J. N., & Panek, R. J. 1985 International Ultraviolet Explorer Atlas of O-Type Spectra from 1200 to 1900 Å (NASA RP-1155)
Walborn, N. R. & Fitzpatrick, E. L. 1990, PASP, 102, 379
Weedman, D.W. 1983, ApJ, 266, 479
Weedman, D.W, Feldman, F.R., Balzano, F.R., Ramsey, L.W., Sramek, R.A., & Wu, C.C. 1981, ApJ, 248, 105
Yee, H.K., Ellingson, E., Bechtold, J., Carlberg, R.G., Cuillandre, J.-C., 1996, AJ, 111, 1783