The X-ray Transient XTE J2012+381
Abstract
We present optical and infrared observations of the soft X-ray transient (SXT) XTE J2012+381 and identify the optical counterpart with a faint red star heavily blended with a brighter foreground star. The fainter star is coincident with the radio counterpart and appears to show weak H emission and to have faded between observations. The RXTE/ASM lightcurve of XTE J2012+381 is unusual for an SXT in that after an extended linear decay, it settled into a plateau state for about 40 days before undergoing a weak mini-outburst. We discuss the nature of the object and suggest similarities to long orbital period SXTs.
keywords:
accretion, accretion discs – binaries: close – stars: individual: (XTE J2012+381)1 Introduction
The transient X-ray source XTE J2012+381 was discovered by the RXTE All Sky Monitor (ASM) on 1998 May 24 [Remillard, Levine & Wood 1998]. Its ASM light curve is shown in Fig. 1. ASCA observations (White et al. 1998) revealed the ultrasoft spectrum plus hard power-law tail signature of a black hole candidate. A radio counterpart was suggested by Hjellming & Rupen [Hjellming & Rupen 1998a] and found to be close to an 18th magnitude star (Castro-Tirado & Gorosabel 1998, Garcia et al. 1998), the USNO A1.0 star 1275.13846761 [Monet et al. 1996]. Spectroscopy of this star showed a nearly featureless spectrum with Balmer and Na D absorption, and no apparent emission lines (Garcia et al. 1998). Our images obtained with the Jacobus Kapteyn Telescope (JKT) on La Palma, however, showed the presence of a faint red companion star 1.1 arcsec away, closely coincident with the radio source (Hynes and Roche 1998, Hjellming and Rupen 1998b). Infrared images also showed this second star [Callanan et al. 1998].
In this paper, we report in detail on the JKT photometry of the faint red star, which we suggest to be the true optical counterpart of XTE J2012+381. A spectrum obtained with the William Herschel Telescope (WHT) reveals weak H emission in the fainter star supporting its identification with XTE J2012+381. The red star also appears somewhat fainter at the epoch of the WHT observations. Infrared imaging obtained with the United Kingdom Infrared Telescope (UKIRT) late in the X-ray decline clearly shows both stars and also suggests fading relative to the earlier observations of Callanan et al. (1998).

2 JKT Photometry
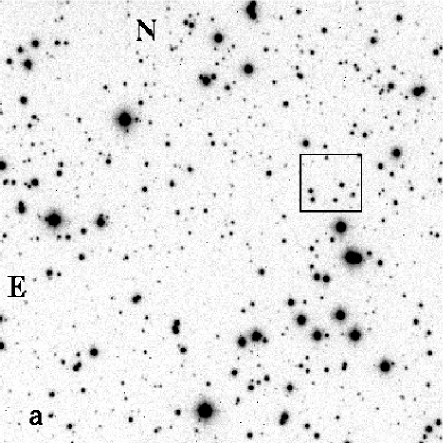
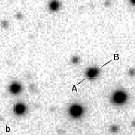
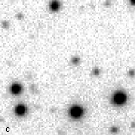
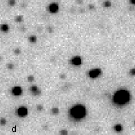
Multicolour photometry of the field of XTE J2012+381 was taken on 1998 June 3 through the JKT service programme. The JKT CCD camera was used with the TEK4 CCD and a standard UBVRI filter set. De-biasing and flat-fielding were performed with standard iraf tasks. A V band image of the field is shown in Fig. 2a. As the field is crowded, the daophot task was used to deblend point spread functions. I band images before and after subtraction of the PSF of USNO A1.0 star 1275.13846761 (Monet et al. 1996; hereafter the USNO star) are shown in Fig. 2b and 2c. A residual stellar image is clearly present after subtraction. Its offset relative to the USNO star was measured using V, R and I images; the results are consistent to 0.1 arcsec. Hence we determine the position of the star (Table 1). The position of the radio source (Hjellming & Rupen 1998b) is consistent with the fainter star to within uncertainties, but is difficult to reconcile with the USNO star. The fainter star is therefore a strong candidate for the optical counterpart of the radio source (and hence the X-ray source).
Absolute flux calibration was obtained from a colour-dependent fit to five stars from Landolt standard field 110 [Landolt 1992]. The fainter star could only be distinguished in V, R and I band images and its magnitudes (Table 2) indicate that it is very red, with . Our only quantitative estimate of the interstellar reddening comes from White et al. [White et al. 1998] who estimate a column density cm-2. Gas-to-dust scalings are at best approximate. Using the relations of Ryter, Cesarsky & Audouze (1975), Bohlin, Savage & Drake (1978) and Predehl & Schmitt (1995) we obtain , 2.2 and 2.4 respectively, so we adopt this range as a reasonable estimate of reddening. Assuming the extinction curve of Cardelli, Clayton & Mathis (1989) this implies and hence an intrinsic colour of . This is consistent with other SXTs; the optical emission is likely dominated by a hot accretion disc. This colour would also be consistent with an early type star, but the lack of H absorption (Sect. 3) would not, unless it were almost exactly filled in by emission.
| Error | |||
|---|---|---|---|
| USNO star | |||
| Fainter star | |||
| Radio source |
| V | R | I | |
|---|---|---|---|
| USNO star | |||
| Red companion | |||
| Comparison |
3 WHT Spectroscopy
XTE J2012+381 was observed with the WHT on 1998 July 20, when the object had faded to approximately half its peak X-ray brightness. The ISIS dual-beam spectrograph was used in single red arm mode to maximise throughput with the low-resolution R158R grating (2.9 Å pixel-1) and the TEK2 CCD. A 1 arcsec slit was used giving an instrumental resolution of 5.5 Å. Based on positions derived from the JKT photometry, the slit was aligned to pass through the line of centres of the USNO star and an isolated comparison star used to define the spatial profile as a function of wavelength. This comparison star was chosen to lie along the line of centres of the two blended stars. The three stars are co-linear to within the accuracy of our astrometry, i.e. the derived V, R and I positions of the red star scatter evenly to either side of the line of centres of the USNO star and comparison star. We estimate that the offset of the red star from the line of centres of the other two stars is therefore less than 0.1 arcsec, the scatter in the astrometry. The positioning of the slit was judged by eye using reflections off the slit jaws. There is therefore some uncertainty in centring the stars within the slit, but as the stars are co-linear to within a fraction of the slit width, this should not affect their relative brightness significantly. Standard iraf procedures were used to de-bias and flat-field the spectrum. Sky subtraction was performed by fitting fourth order polynomials to the sky background with the stellar profiles masked out. The subtracted image showed no significant residuals in the sky regions. Wavelength calibration was achieved using a fit to a copper-neon arc spectrum obtained immediately before the object spectrum and checked against the night sky emission lines.
Although the seeing was good (spatial FWHM 0.9 arcsec) the stars are still heavily blended; a sample binned spatial cut is shown in Fig. 3. The third star on the slit was therefore used to define the spatial profile as a function of wavelength, by means of a Voigt profile fit. The profile parameters are smoothed in wavelength using a fourth-order polynomial fit and then fixed. The centre position of the profile varies by less than one pixel over the whole spectrum. The Gaussian core width and the Voigt damping parameter both vary by about 5 per cent. No smaller scale patterns in the residuals to this fit are apparent. The Voigt model was found to give a very good fit over most of the profile. It does somewhat overestimate the extreme wings of the profile, so we approximately correct this by defining a wavelength independent correction term as a function only of distance from profile centre. With this correction, no significant deviations between model and data can be discerned (see Fig. 3). The positions of the other two stars relative to the isolated comparison are taken as fixed, leaving only the amplitudes of two blended profiles to be fitted. This was done by minimisation and is effectively a generalisation of the optimal extraction method [Horne 1986] to the multiple profile case. This method for separating the spectra of blended stars will be described in more detail in a subsequent paper in preparation.

A Telluric correction spectrum was formed by normalising the spectrum of the spectrophotometric standard BD+40 4032 [Stone 1977] observed later in the night. This has spectral type B2 III so H and He i absorption lines were masked out. The correction spectrum was shifted slightly to compensate for spectrograph flexure between this exposure and that of our target. It was also rescaled to give a least-squares fit to the normalised sum of the three spectra on the slit. A short exposure of our target was made immediately before observing BD+40 4032 so we also use this to obtain absolute flux calibration. Both these calibration observations used a wide slit (4 arcsec) to ensure photometric accuracy.
The final calibrated spectra of both stars are shown in Fig. 4, binned in wavelength. As can be seen, the Telluric corrections are good, though slight distortion of the spectrum remains, e.g. near 7250 Å. The only prominent non-atmospheric feature in either spectrum is H, in absorption in the USNO star (believed to be an early F-type star, Garcia et al. 1998), with an equivalent width of Å, and apparent weak emission in its red companion, equivalent width Å. The errors in equivalent width are statistical errors derived from the residuals of a low-order fit to the surrounding continuum. Assuming these errors are correct, our detection of H is significant at the level.
The emission feature appears roughly square, with full width km s-1. It is broader than the absorption in the USNO star (FWHM Å) and so does not look like a simple reflection of the absorption line. It is also much wider than the night sky H emission. We have repeated the extraction process without the correction to the profile wings. While this noticeably degrades the profile fit, it does not affect the H emission feature. As a final test, we have used the derived spatial profile (including profile correction) to synthesise a new fake image in which the spectrum of the fainter star was left unchanged, but the H line profile of the USNO star was used as a template to add artificial absorption lines (of the same strength and width) at 6100, 6425 and 6725 Å. We then repeated the extraction process on this fake image without allowing the profile correction to the line wings, i.e. using a model for the spatial profile which is known to be inadequate. This was done as a check that a combination of misfitting the spatial profile and a strong absorption line does not produce spurious emission. No emission features are seen in the spectrum of the fainter star at the position of the fake absorption lines. After subtraction of a low-order fit to the continuum, we measure the total residual counts in 15-pixel (44 Å) bins centred on each of the line positions. From the noise in the surrounding continuum, we estimate that the error on the total counts from such a bin is 130 counts. At 6100, 6425 and 6725 Å respectively we measure 150, 76 and counts, a distribution (mean 14, rms 140) consistent with zero to within the error estimate. For the bin centred on H, however, we measure 550 counts, significantly larger than the estimated error.
We therefore conclude that the H emission is unlikely to be an artifact of the de-blending process but represents real emission from the optical counterpart of the X-ray source, detected with confidence.

4 UKIRT Photometry
UKIRT observations were obtained on 1998 August 14. The weather was clear, winds were light and the humidity was low. The images were obtained using the IRCAM3 detector. The detector array has a scale of 0.286 arcsec pixel-1. The data on our target were collected between 12.51 and 13.57 UT, during which the airmass varied from 1.49 to 2.02. Initial data reduction was performed using ircamdr software. As for the JKT observations, point spread function fitting was done using daophot in iraf. Flux calibration was performed with respect to the UKIRT standard FS4. The primary data on the standard were taken between the J and K band observations of the source. These were compared with other standard observations taken at the beginning of the sequence as a check of consistency; the scatter in standard measurements is mag. Our magnitudes for the two stars are summarised in Table 3 together with the magnitude equivalent to the sum of their fluxes. Error estimates are derived from a combination of the consistency of standard measurements (as an indicator of the reliability of the calibration) and statistical errors determined by daophot.
| J | K | |
|---|---|---|
| USNO star | ||
| Red companion | ||
| Combined |
5 Is the Optical/IR Counterpart Fading?
In order to assess whether the optical counterpart had faded between the JKT and WHT observations, we formed a model bandpass (based on filter transmission, CCD response and the extinction curve for the same airmass as the JKT observations). This was applied to our spectra of the three stars on the slit to produce synthetic R band magnitudes for comparison with the photometry. We estimate for the USNO star, for the faint optical counterpart to the X-ray source and for the isolated star. Our spectra do not quite cover the full R bandpass, but the loss is a very small amount at both short and long wavelengths. We estimate that the effect of this, together with errors in the model bandpass introduces an uncertainty of no more than 0.05 magnitude when combined with the colour differences between the stars. The JKT and WHT observations of the USNO star and the slit comparison star are then approximately consistent, with perhaps a small systematic calibration error of less than 0.10 magnitudes. The much larger difference in the magnitudes for the X-ray source (0.33 magnitudes fainter at the second observation) then suggests that it has indeed faded optically between days 9 and 53.
The infrared counterpart also appears fainter than earlier in outburst. Callanan et al. (1998) estimated , near the peak of outburst for the two blended stars. The comparable combined magnitudes from our UKIRT observation are given in Table 3. Our observations are significantly different from those of Callanan et al. To produce this difference by fading of the fainter star would require a decline of 1.2 magnitudes in J and 1.0 magnitudes in K between days 9 and 82.
6 Discussion
The X-ray light curve of XTE J2012+381 (Fig. 1) shows many similarities to those of other soft X-ray transients [Chen, Shrader & Livio 1997], but there are some important differences. The secondary maximum peaks around day 29, only 22 days after the first peak. This is earlier in the outburst than in most systems (45–75 days, Chen, Livio & Gehrels 1993), but is not unprecedented (Shahbaz, Charles & King 1998). The decline from secondary maximum is clearly linear. In the paradigm of King & Ritter [King & Ritter 1998], this would imply that the disc is too large to be held in a high state by X-ray irradiation. A large disc would then imply a long orbital period. Such an interpretation is supported by observations of other SXTs (Shahbaz et al. 1998), in which extended linear decays are only seen in long-period systems.
A long orbital period in turn implies that XTE J2012+381 probably contains an evolved companion, similar to V404 Cyg. There are differences in the optical spectrum: for example, V404 Cyg showed very strong emission lines of hydrogen, helium and other species (Casares et al. 1991, Wagner et al. 1998), whereas XTE J2012+381 shows only weak H emission. This may not be significant; V404 Cyg was unusual in this respect, and most SXTs show few emission lines during outburst. Another long period system, GRO J1655–40, has exhibited outbursts both with H emission [Bailyn et al. 1995] and without [Hynes et al. 1998].
More puzzling is the apparent plateau in the X-ray brightness after day 95 at a level of mCrab. In this period, the flux is gradually rising and culminates in a mini-outburst around day 145, approximately 120 days after the secondary maximum. This is an intriguing timescale as both GRO J1655–40 (Harmon et al. 1995, Zhang et al. 1997) and GRO J0422+32 (Augusteijn, Kuulkers & Shaham 1993, Chevalier & Ilovaisky 1995) have also shown mini-outbursts separated by days. The lightcurves of these three systems are otherwise very different, and it is not clear that their mini-outbursts are caused by the same mechanism; see Chen, Shrader & Livio (1997) for a discussion of the models proposed for SXT rebrightenings.
We conclude that XTE J2012+381 shows similarities to other SXTs, especially long-period systems. The extended plateau state is, however, unusual. Continued monitoring is important to elucidate its nature. In particular it will be of interest to see if further mini-outbursts occur.
Acknowledgements
The Jacobus Kapteyn and William Herschel Telescopes are operated on the island of La Palma by the Isaac Newton Group in the Spanish Observatorio del Roque de los Muchachos of the Instituto de Astrofisica de Canarias. The United Kingdom Infrared Telescope is operated by the Joint Astronomy Centre on behalf of the U.K. Particle Physics and Astronomy Research Council. The JKT observations were provided by Nic Walton as part of the JKT Service Programme and UKIRT data was obtained through the UKIRT Service Programme. RXTE results provided by the ASM/RXTE teams at MIT and at the RXTE SOF and GOF at NASA’s GSFC. RIH is supported by a PPARC Research Studentship and would like to acknowledge helpful discussion with Carole Haswell and others at Sussex, as well as constructive criticism from our referee, Michael Garcia. This research has made use of the SIMBAD database, operated at CDS, Strasbourg, France.
References
- [Augusteijn, Kuulkers & Shaham 1993] Augusteijn T., Kuulkers E., Shaham J., 1993, A&A, 279, L13
- [Bailyn et al. 1995] Bailyn C. D., et al., 1998, Nat., 374, 701
- [Bohlin, Savage & Drake 1978] Bohlin R. C., Savage B. D., Drake J. F., 1978, ApJ, 224, 132
- [Callanan et al. 1998] Callanan P., McCarthy J., Garcia M., McClintock J., 1998, IAU Circ. 6933
- [Cardelli, Clayton & Mathis 1989] Cardelli J. A., Clayton G. C., Mathis J. C., 1989, ApJ, 345, 245
- [Casares et al. 1991] Casares J., Charles P. A., Jones D. H. P., Rutten R. G. M., Callanan P. J., 1991, MNRAS, 250, 712
- [Garcia et al. 1998] Castro-Tirado A., Gorosabel J., 1998, IAU Circ. 6931
- [Chen, Livio & Gehrels 1993] Chen W., Livio M., Gehrels N., 1993, ApJ, 408, L5
- [Chen, Shrader & Livio 1997] Chen W., Shrader C. R., Livio M., 1997, ApJ, 491, 312
- [Chevalier & Ilovaisky 1995] Chevalier C., Ilovaisky S. A., 1995, A&A, 297, 103
- [Garcia et al. 1998] Garcia M. R., McClintock J. E., Barton E., Callanan P., 1998, IAU Circ. 6931
- [Harmon et al. 1995] Harmon B. A., 1995, Nat, 374, 703
- [Hjellming & Rupen 1998a] Hjellming R. M., Rupen M. P., 1998a, IAU Circ. 6924
- [Hjellming & Rupen 1998b] Hjellming R. M., Rupen M. P., 1998b, IAU Circ. 6932
- [Horne 1986] Horne K., 1986, PASP, 98, 609
- [Hynes & Roche 1998] Hynes R. I., Roche P., 1998, IAU Circ. 6932
- [Hynes et al. 1998] Hynes R. I. et al., 1998, MNRAS, 300, 64
- [King & Ritter 1998] King A. R., Ritter H., 1998, MNRAS, 293, L42
- [Landolt 1992] Landolt A. U., 1992, AJ, 104, 340
- [Monet et al. 1996] Monet D., et al., 1996, USNO-A1.0, U.S. Naval Observatory, Washington DC
- [Predehl & Schmitt 1995] Predehl P., Schmitt J. H. M. M., 1995, A&A, 293, 889
- [Remillard, Levine & Wood 1998] Remillard R., Levine A., Wood A., 1998, IAU Circ. 6920
- [Ryter, Cesarsky & Audouze 1975] Ryter C., Cesarsky C. J., Audouze J., 1975, ApJ, 198, 103
- [Shahbaz, Charles & King 1998] Shahbaz T., Charles P. A., King A. R., 1998, MNRAS accepted
- [Stone 1977] Stone R. P. S., 1977, ApJ, 218, 767
- [Wagner et al. 1991] Wagner R. M., Starrfield S. G., Howell S. B., Kreidl T. J., Bus S. J., Cassatella A., Bertram R., Fried R., 1991, ApJ, 378, 293
- [White et al. 1998] White N. E., Ueda Y., Dotani T., Nagase F., 1998, IAU Circ. 6927
- [Zhang et al. 1995] Zhang S. N., Mirabel I. F., Harmon B. A., Kroeger R. A., Rodriguez L. F., Hjellming R. M., Rupen M. P., 1997, in proc. 4th Compton Symposium, Eds. C. D. Dermer, M. S. Strickman, J. D. Kurfess, AIP Conference Proceedings 410, p141