The abundance of nitrogen in starburst nucleus galaxies ††thanks: Based on observations obtained at the 193cm telescope of Observatoire de Haute-Provence, operated by INSU (CNRS)
Abstract
We show that the excess of nitrogen emission observed in a large sample of Starburst Nucleus Galaxies (SBNGs) can only be explained at a given metallicity by an overabundance of nitrogen with respect to normal H ii regions in the disks of late–type spirals. The N/O ratios in the SBNGs are comparable to the values found in the bulges of normal early–type spirals, which suggests that what we observe could be the main production of nitrogen in the bulges of these galaxies.
The variation of the N/O ratio as a function of metallicity in SBNGs follows a relation, but the increase of nitrogen does not appear as a continuous process. In SBNGs, nitrogen is probably produced by different populations of intermediate-mass stars, which were formed during past sequences of bursts of star formation. This assumption pushes the origin of the main bursts 2–3 Gyrs back in the past. On a cosmological scale, this time interval corresponds to redshifts , where a significant increase of star formation activity occurred. The origin of the SBNG phenomenon would thus have cosmological implications, it would be related to a more active phase of star formation in the Universe sometime in its recent past.
Key Words.:
galaxies: abundances – galaxies: starburst – galaxies: evolution – galaxies: formation1 Introduction
Starburst galaxies can be grouped in two main families: the H ii galaxies and the Starburst Nucleus Galaxies (SBNGs). The former are small-mass and metal-poor galaxies, while the latter are more massive and metal-rich (for a complete definition of starburst galaxies, see Coziol et al. 1998a). The astronomical community recognized quite early the peculiar nature of H ii galaxies and many studies have been undertaken to determine their characteristics. The origin of SBNGs, on the other hand, was thought to be more straightforward to understand. As a consequence, the basic characteristics of these galaxies are not as well determined and their nature is still in debate.
For example, it was believed some twenty years ago that SBNGs were “old” galaxies which were rejuvenated by inflow of matter resulting from interactions with other galaxies (Huchra 1977; Tinsley & Larson 1978). But subsequent studies have shown that starbursts generally do not reside in high galaxy density regions (Salzer et al. 1989; Hashimoto et al. 1998; Coziol et al. 1998b, 1999), where conditions for interaction should be more favorable, and that only a fraction (between 25% and 30%) of the massive SBNGs have obvious luminous companions (Keel & van Soest 1992; Gallimore & Keel 1993; Coziol et al. 1995; Coziol et al. 1997a, 1999; Contini et al. 1998).
The frequency of interacting galaxies among SBNGs may be higher however, if we assume that the morphological peculiarities often observed in these galaxies, are weak traces of past interactions (Keel & van Soest 1992; Coziol et al. 1995, Barth et al. 1995) and that, consequently, many SBNGs are the remnants of merging galaxies (Coziol et al. 1998c). The assumption that SBNGs result from accretions of smaller galaxies is supported by several facts : they are less chemically evolved than normal galaxies with similar morphologies and comparable luminosities (Coziol et al. 1997b), they are predominantly early–type spiral galaxies (Coziol et al. 1997a; 1998a) and follow a luminosity–metallicity relation similar to that of elliptical galaxies (Coziol et al. 1998c).
The merger hypothesis, on the other hand, does not completely explain the starburst phenomenon and it is probably also necessary to assume internal regulating star formation mechanisms, in order to extend the total lifetime of the starburst over a longer period than is usually assumed based on the dynamical time scale of a gravitational interaction between galaxies (Searle & Sargent 1972; Gerola et al. 1980; Krügel & Tutukov 1993). Such mechanisms would explain why SBNGs experienced more than one burst over the last few Gyrs (González Delgado et al. 1995; Coziol 1996). They would also explain why these galaxies do not produce supernovae at higher rates than normal ones (Turatto et al. 1989; Richmond et al. 1998; González Delgado et al. 1999)
In principle, one could gain a better understanding of the nature and origin of SBNGs by drawing a more complete picture of their chemical evolution. But this is a difficult task, which is further complicated by our relative ignorance of how the chemical evolution of normal spiral galaxies proceeds. The main difficulty is observational: building a reasonable scenario of the chemical evolution of galaxies generally requires observations of H ii regions over a large range of wavelengths. For local galaxies, for example, UV observations are required for determining the abundance of carbon (Kobulnicky & Skillman 1998), while observations in the near infrared are needed for estimating the abundance of sulphur (Garnett 1989). In metal-rich spiral galaxies, an additional difficulty resides in the non observability of important nebular lines, like [O iii] at 4363 Å, without which the electron temperature of the gas cannot be determined directly.
Many efforts have been devoted over the years to develop functional empirical techniques to circumvent the problems related to the determination of chemical abundances in galaxies (Pagel et al. 1979; Edmunds & Pagel 1984; Edmunds 1989; Skillman 1989). Recently, Thurston et al. (1996; hereafter TEH) have extended these techniques and devised a new method for estimating nitrogen abundances in metal-rich galaxies. In this paper, we take advantage of this recent advance to determine the abundance of nitrogen in SBNGs.
The organization of our paper is as follows. In Section 2, we identify the main source of excitation in our sample of SBNGs, based on their location in three standard diagnostic diagrams. We then discuss, in Section 3, the legitimacy of applying to SBNGs the empirical method designed for “normal” H ii regions to determine their chemical abundances. In the SBNGs, we took great care in verifying that no other sources of excitation like a hidden AGN is present, which could complicate or even impede the abundance determination in these galaxies. Having verified these points, we proceed in Section 4 to estimate the oxygen and nitrogen abundances in a large sample of SBNGs, comparing these abundances with those of normal H ii regions in spiral galaxies. In Section 5, we discuss two different scenarios for producing nitrogen in SBNGs and examine their consequences for the origin of the bursts in these galaxies. A summary of our most salient results is presented in Section 6.
2 The location of SBNGs in standard diagnostic diagrams
The optical spectrum of a starburst galaxy is usually quite distinct from that of an AGN111 We use the word AGN as it means, namely Active Galactic Nucleus. We do not presuppose anything as to the origin of this activity, only that it involves something more than what is usually observed in normal H ii regions: either a black hole or shocks.. It resembles that of an H ii region in our Galaxy, where, as we know, the gas is photoionized by young O and B stars (Searle & Sargent 1972; Sargent 1972; Huchra 1977; French 1980). This conclusion applies to all the types of starburst galaxies known today (Salzer et al. 1989; Kim et al. 1998; Coziol 1996; Coziol et al. 1998a), including those where the burst is located mostly in the central regions (Weedman et al. 1981; Balzano 1983).
But, because the physical conditions in the nuclei of galaxies are still poorly understood, one may wonder what kind of pathological phenomena the evolution of a powerful starburst in the center of a galaxy could develop (Weedman 1983; Terlevich et al. 1991). This concern may partly be justified by observations. For example, the presence of low-intensity non-stellar activity in the center of normal galaxies is frequently suggested (Heckman 1980; Peimbert & Torres-Peimbert 1981; Véron et al. 1981; Rose & Cecil 1983; Filippenko & Sargent 1985) and, in AGNs, traces of star formation occurring simultaneously with an active nucleus are sometimes noted (Shields & Filippenko 1990; Lonsdale et al. 1993; Véron et al. 1997; González Delgado et al. 1997). However, none of these observations constitutes definite evidence that an evolutionary connection between starburst and AGN exists, and, even less so, explains how this evolution may proceed.
Obviously, if a source of excitation other than star formation is active in SBNGs, this will greatly complicate abundance determinations. It is thus essential to first establish the dominant excitation source (O and B stars or an AGN) present in these galaxies. This is usually done empirically: one constructs diagnostic diagrams using several ratios of emission lines present in the optical spectra (Baldwin et al. 1981; Veilleux & Osterbrock 1987, hereafter BPT and VO). Over the years, the use of diagnostic diagrams has been recognized as the most efficient method for classifying the different types of activity encountered in emission-line galaxies (Veilleux et al. 1995; Véron et al. 1997; Gonçalves et al. 1999). This is the method that we applied to identify the main source of excitation in our different samples of galaxies.
Our sample of UV-bright SBNGs was composed originally of 208 H ii regions observed along the bars of 75 Markarian barred galaxies (see Contini 1996, Contini et al. 1998 and Considère et al. 1999 for details). From this sample, we rejected 48 H ii regions because of their ambiguous classification in the three diagnostic diagrams. This same criterion was used by Veilleux et al. (1995) to build their sample of FIR-bright SBNGs. This criterion allows one to eliminate the so called “transition” galaxies, whose nature is not well determined (Véron et al. 1997; Gonçalves et al. 1999; Hill et al. 1999; Doyon et al. 1999) 222These “transition” types are probably not a new kind of emission–line galaxies, but cases of misclassified Seyfert or LINER galaxies with circumnuclear star formation (see Gonçalves et al. 1999)..
For comparison, we used the sample of 83 FIR-bright SBNGs of Veilleux et al. (1995). We also used the 70 H ii regions observed by McCall et al. (1985; hereafter MRS) to represent normal H ii regions. In all the samples, the line ratios were corrected for internal reddening using Balmer decrements.
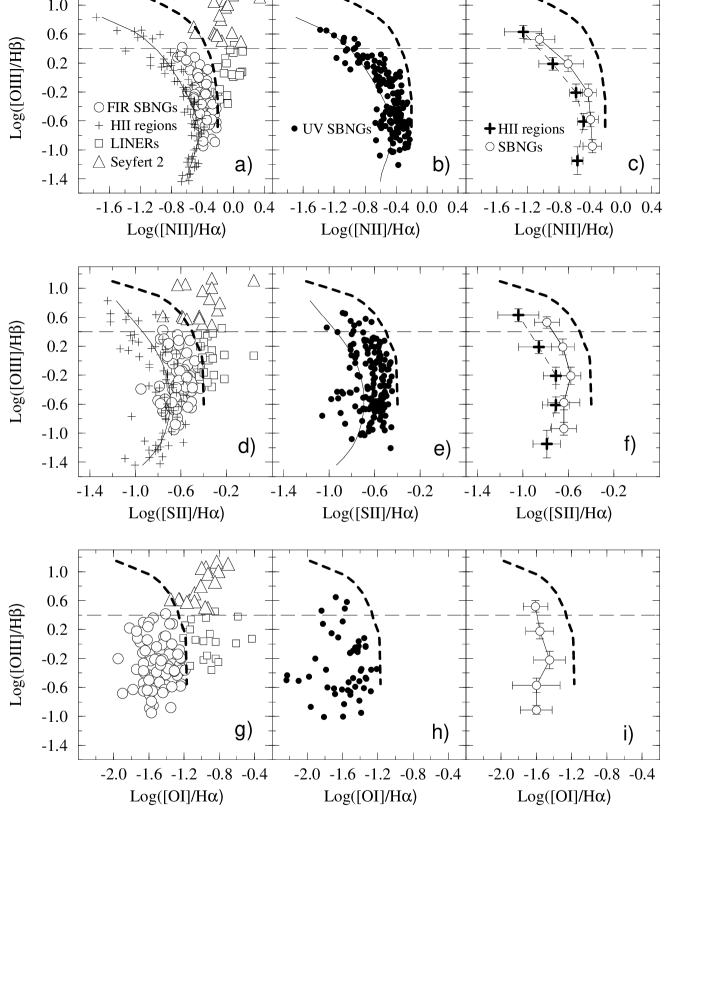
The three classical diagrams of [O iii]/H (the excitation level) as a function of [N ii]/H, [S ii]/H and [O i]/H for the various samples are shown in Fig. 1. Note that, for the sake of clarity, these line ratios will hereafter be written without the wavelengths. AGNs (Seyfert 2s and LINERs) are clearly separated from H ii regions and SBNGs (Fig. 1a, d and g). In these diagrams, the H ii regions trace a sequence where the decreasing excitation is due to the increasing oxygen abundance (MRS; Dopita & Evans 1986). In general, the SBNGs trace a similar sequence, but slightly displaced towards higher emission-line ratios (Coziol et al. 1997a).
Despite being slightly more luminous in the infrared, the FIR-bright SBNGs show optical spectral characteristics similar to those of the UV-bright SBNGs. This is consistent with the similarities observed between these two types of SBNGs in the FIR and suggests that the two selection criteria (UV- or FIR-bright) define mostly the same kind of galaxies (Coziol et al. 1998a). A Kolmogorov–Smirnoff test performed on [N ii] suggests, with a confidence limit greater than 99%, that the FIR- and UV–bright SBNGs come from the same population. The same test yields similar conclusions for [O i] and [S ii], but only with confidence limits greater than 90% and 80% respectively.
The [O i] line is rarely observed in normal H ii regions (BPT), and it was not measured in the MRS sample. When it is measurable in starburst, its intensity is always weaker than in AGNs. This is because the [O i] line is produced only in regions of partial ionization which are much more extended in AGNs (VO). In our sample of UV–bright SBNGs, only a small fraction ( 30%) of the galaxies presents this line. We compare the few [O i]/H ratios observed in the SBNGs of our sample in Fig. 1h and i. Log([O i]/H) is on average , comparable to what is observed in the sample of FIR-bright SBNGs of Veilleux et al. (1995) and consistent with values found in normal H ii regions (BPT, VO).
We conclude, on the basis of the three standard diagnostic diagrams, that the main source of excitation of the gas in SBNGs is O and B stars, like in normal H ii regions (BPT; VO; Gonçalvez et al. 1998; Kim et al. 1998).
As can be seen in Fig. 1, even if the gas in SBNGs is ionized by O and B stars, the spectra of these galaxies do show, however, an excess of nitrogen and sulphur emissions with respect to H ii regions in the disk of normal spirals (the MRS sample). Before proceeding with the determination of abundances in SBNGs, we will now discuss the possible causes of this phenomenon. Note that because we do not have enough information to estimate the abundance of sulphur in our samples, our discussion will focus on nitrogen.
3 The origin of the excess of nitrogen emission in SBNGs
An excess of nitrogen emission in the spectra of galaxies (usually normal ones) has been observed before (see Stauffer 1982, and references therein) and various hypotheses have been proposed to explain it (e.g. Kennicutt et al. 1989). The simplest hypothesis, which can apply to SBNGs, is that these galaxies possess an overabundance of nitrogen with respect to normal disk H ii regions (Stauffer 1982). Such an overabundance has already been observed in the prototypical SBNG NGC 7714 (González Delgado et al. 1995) and some have suggested that it also happens in AGNs (Storchi–Bergmann 1991; Storchi-Bergmann & Wilson 1996; Ohyama et al. 1997).
Another possibility is that SBNGs have an extra source of excitation. This, in fact, was the solution preferred by Kennicutt et al. (1989), who suggested a hidden AGN as the extra source. As proposed by Lehnert & Heckman (1994), shocks produced by supernovae or starburst winds could probably also do the trick. However, the extra excitation hypothesis is in contradiction with the use of emission–line diagnostic diagrams to classify activity types in galaxies. Indeed, we remind the reader that we already eliminated from our sample all the cases which appeared ambiguous in these diagnostic diagrams. Therefore, if the excess emission observed in these galaxies is still due to a residual excitation effect, it would seriously question the use of these diagnostic diagrams for distinguishing between the different activity types in emission–line galaxies. At the present time however, there is no evidence that diagnostic diagrams can give a wrong classification (BPT; VO; Gonçalvez et al. 1998; Kim et al. 1998).
As an alternative, Shields & Kennicutt (1995) have suggested that metal depletion occurring during dust formation could produce a slight extra excitation. At first, this seems perfectly applicable to the FIR-bright SBNGs. However, the fact that we do not observe any difference in the diagnostic diagrams between these dusty galaxies and their UV-bright counterparts suggests that dust does not play a significant role in producing the excess of emission in these galaxies. This interpretation is consistent with the original analysis made by VO on the null effect of dust on the different line ratios used in the diagnostic diagrams. It is also consistent with the fact that the two types of SBNGs have similar properties in the far-infrared (Coziol et al. 1998a).
If the excess emission in the SBNGs with respect to normal disk H ii regions is due to a residual excitation effect, we cannot use the empirical method devised by TEH to determine the abundance of nitrogen in SBNGs. In fact, we would even caution against using this method to determine the nitrogen abundance, as TEH have done, in early-type spirals and the nuclei of normal galaxies. It is therefore important to test thoroughly the different hypotheses for the origin of the excess emission.
3.1 Excitation effects other than O and B stars
If the excess emission observed in SBNGs is caused by a surplus of excitation, the intensities of the emission lines should be correlated; they should all increase simultaneously. To look for such a correlation, we have computed the mean values of [N ii], [S ii] and [O i] (relative to H) in excitation bins of 0.4 dex. These mean values are given in Table 1 and plotted in Fig 1c, f and i. Because we did not find any difference between the spectral characteristics of the FIR- and UV-bright SBNGs, we merged the two samples together for this analysis.
The mean excess of emission with respect to normal disk H ii regions is about the same for nitrogen and sulphur, dex and dex respectively. However, the difference in [N ii]/H stays almost constant while the difference in [S ii]/H increases with the level of excitation (last column of Table 1).
It also appears that [N ii]/H increases as the level of excitation decreases (or as the oxygen abundance increases), while [S ii]/H and [O i]/H stay constant. In Fig 1c, f and i, it can be seen that [N ii]/H is correlated with [O iii]/H, while [S ii]/H and [O i]/H are not. This is confirmed with a confidence limit higher than 99% using a Generalized Kendall’s tau correlation coefficient test.
These different behaviors of the emission-line ratios with the level of excitation are inconsistent with the hypothesis that the excess of emission in SBNGs is produced by an additional excitation effect. On the other hand, they are partly consistent with what is expected if these line ratios are sensitive to a variation of abundance. If nitrogen is produced by intermediate-mass stars while sulphur is produced by massive stars, the intensities of these two lines should not be correlated. The different behaviors of these two lines also suggest that, in SBNGs, the abundance of nitrogen will increase with that of oxygen while the abundance of sulphur will stay constant, as is observed in normal disk H II regions (Torres–Peimbert et al. 1989). We will show later (Sect.5.1) that these behaviors are consistent with a scenario of successive bursts for the chemical evolution of SBNGs.
To better understand the difference between SBNGs and AGNs, we compare [N ii]/H with [S ii]/H in our different samples. The two line ratios are significantly higher in the LINERs and Seyfert 2s than in the SBNGs (see Fig. 2a and b). Note that we cannot distinguish between the two AGN types in this diagram. The SBNGs, on the other hand, are clearly separated from LINERs. Some Seyfert 2s have [S ii]/H ratios comparable to those of SBNGs, but this is not a problem because Seyfert 2s can be clearly distinguished from SBNGs based on their higher excitation level in Fig. 1.
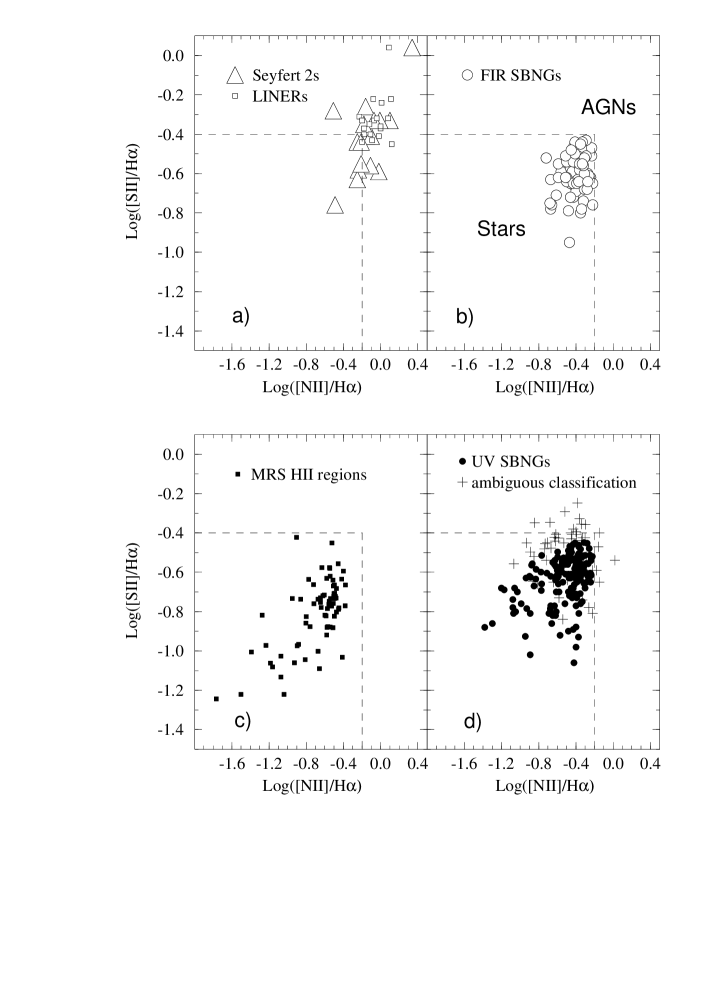
Using the positions of the SBNGs and Seyfert 2s/LINERs in Fig. 2, we establish two regions in this diagram where the gas is excited by different mechanisms: AGN vs photoionization by O and B stars. This separation is also consistent with the lower limits proposed by Lehnert & Heckman (1996) for the presence of diffuse ionized gas in the halos of edge-on starbursts. We test our separation criterion on the UV-bright SBNGs and on the MRS sample of disk H ii regions in Fig. 2c and d. As expected, all the H ii regions in the MRS sample and the UV-bright SBNGs are located in the region where excitation by O and B stars is predominant.
We also show in Fig. 2d the position of the H ii regions in our sample of SBNGs which were rejected on the basis of an ambiguous classification in the three diagnostic diagrams. Most of these ambiguous cases are either in the AGN regions or at the border of these regions. This supports our conclusion that the main source of excitation of the gas in SBNGs is O and B stars.
3.2 Possible spurious effects
For our analysis to be complete, we now verify that no other factors influence the line ratios under investigation. The sulphur lines, for example, are sensitive indicators of electronic density, and one could imagine that a variation of this density over the line of sight introduces spurious effects. However, as shown in Fig. 3a, the three line ratios are independent of electronic density.
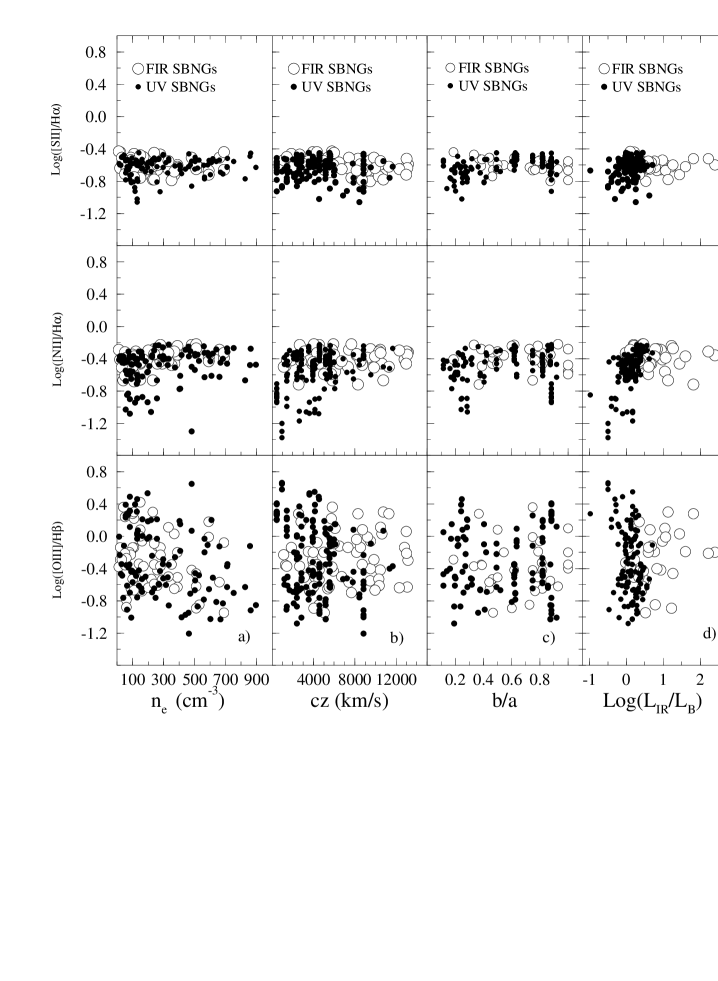
Another spurious effect will arise if the slit of the spectrograph covers regions with different physical properties, e.g. a central AGN and a circumnuclear starburst region, producing intermediate values for the line ratios. The presence of such an effect can be tested by its dependence on redshift. If the physical conditions (different sources of excitation or density layers) change with radial distance, while the slit aperture remains constant, the line ratios will change with redshift. For example, an AGN in the nucleus of each SBNG would produce higher line ratios at low redshifts, because of the increasing contribution of the AGN over that of circumnuclear H ii regions (Storchi-Bergmann 1991). The contrary is expected for diffuse gas (Lehnert & Heckman 1994, 1996); the ratios would then increase with redshift due to the enhanced contribution of diffuse gas in the aperture. None of these effects is observed in Fig. 3b.
We also checked if the line ratios vary with the inclination of the galaxies (as estimated by their axis ratio b/a); this is shown in Fig. 3c. Lehnert & Heckman (1996) found different variations of the line ratios along the two axes, which they attributed to the presence of diffuse ionized gas in the halos of some FIR-bright starbursts. Again, no significant effect is present in the two samples of SBNGs.
-
a
Unreddened line intensities using the curve for LMC of Pei (1992)
Finally, we looked for a relation between the emission-line ratios and the intensity of the burst, as measured by the ratio LIR/LB. Following Lehnert & Heckman (1996), the most straightforward prediction of the superwind theory is a relation between the emission-line ratios and the star formation rates. No relation exists between the three line ratios and the intensities of the bursts in the FIR-bright SBNGs; this is shown in Fig. 3d. The [N ii]/H ratio increases slightly with LIR/LB in the UV-bright SBNGs, but this is because [N ii]/H is lower in the SBNGs with high excitation, which also happen to have the lowest star formation rates.
All these negative results indicate that no spurious effects invalidate the results of our analysis of the emission-line ratios in SBNGs. We thus conclude that there is no extra excitation effect in these galaxies. We are therefore left with only one possible explanation for the origin of the excess of nitrogen emission in SBNGs, namely that they have different abundances than H ii regions in normal spiral galaxies (Stauffer 1982). This is what we will now verify.
3.3 The excess of nitrogen emission as an abundance effect
In their analysis of photoionized models of H ii regions, Evans & Dopita (1985) pointed out that the position occupied by a galaxy in the diagnostic diagram [O iii]/H vs [N ii]/H should also depend on the ratio N/O. It seems therefore reasonable to think that the higher [N ii]/H ratios in the SBNGs are due to an abundance effect. Indeed, a higher dispersion in N/O for a given metallicity will automatically translate into a higher dispersion of [N ii]/H for a given level of excitation, that is for a fixed [O iii]/H. To test this hypothesis we constructed two different H ii region sequences using the photoionization code CLOUDY (Ferland 1997). For temperature K, we used Kurucz atmospheres, while for higher temperature, the non–LTE model of Rauch (1997) was adopted. The resulting sequences are shown in Fig.4.
Our first sequence (Seq. 1) was built to reproduce the spectral sequence for normal H ii regions represented by the MRS sample. To constrain the sequence at the low-metallicity end, we used the parameters (Table 2) and abundances (Table 3) of the LMC H ii region N159 (observed by Dufour et al. 1982), deduced from a previous model also based on CLOUDY (Carlos Reyes et al. 1998). This reference point is crucial because the models of MRS and Dopita & Evans (1986) do not reproduce the observations in this part of the diagnostic diagram. At a low metallicity level, we assumed that H ii regions are photoionized by very young and hot stars.
-
a
Carlos Reyes et al. (1998)
-
b
Grevesse & Noels (1993)
Starting from this point, we reproduced the spectral sequence for normal H ii regions by varying the physical parameters and chemical abundances. For each abundance value, we searched for the combination of luminosity and ionization temperature that best reproduces the spectral sequence of H ii regions. Except for He, C and N, the abundances changed linearly. The abundance of He was kept constant, while the ratios C/O and N/O varied following Eqs. (1) and (2).
| (1) | |||||
| (2) | |||||
These two parametric relations were obtained from a regression on data from the LMC, SMC and solar values (Table 4). Our Eq. (2) yields a N/O ratio for the LMC which is consistent with the value given by the relation proposed by Vila–Costas & Edmunds (1993; hereafter VC&E). In the diagnostic diagram, the position of the galaxies with solar abundance was determined using the metallicity calibration curve of Coziol et al. (1994).
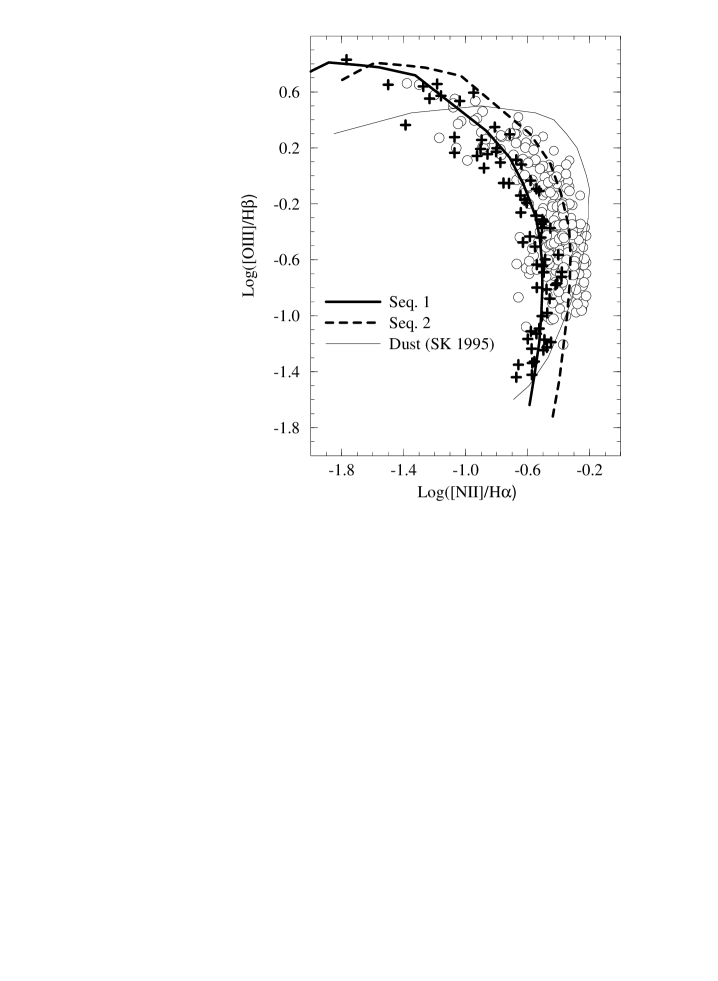
Sequence 2 was derived from Sequence 1 by increasing by a factor 2 the abundance of nitrogen predicted by Eq. (2). As can be seen in Fig.4, Sequence 2 reproduces the distribution in SBNGs relatively well. Note that the metallicities are comparable to those found in Sequence 1. Therefore, for a given metallicity, this sequence predicts an overabundance of nitrogen in SBNGs with respect to normal disk H ii regions. For comparison, we have also drawn in Fig.4 the predictions made by the model of Shields & Kennicutt (1995) which takes into account the depletion of metals in dust. This model generally overpredicts the excess of nitrogen emission in SBNGs. Considering the relatively good fit of Sequence 2, we conclude that the excess of nitrogen emission in SBNGs can easily be reproduced by a slight overabundance of this element.
4 Empirical estimates of the oxygen and nitrogen abundances
In the previous section, we performed several tests to verify the legitimacy of applying to the SBNGs the method for determining the nebular abundance in normal H ii regions. First, we identified the main source of excitation of the gas in SBNGs with O and B stars. Then by constructing a simple sequence of H ii regions, we showed that the simplest hypothesis for explaining the excess of nitrogen emission observed in these galaxies is a slight overabundance of this element with respect to normal disk H ii regions. We now feel justified to determine the oxygen and nitrogen abundances in our sample of SBNGs with the empirical techniques developed for normal H ii regions. In doing so, we should also verify the predictions of our photoionized model, by comparing the abundances in the SBNGs with those of normal disk H ii regions.
4.1 Abundances determination
The oxygen abundances are determined following the relation (Vacca & Conti 1992):
| (3) |
where R([O iii].
To determine the N/O ratios, we use the TEH method, adopting their empirical equation to estimate the electron temperature in the [N ii] emission region. Using simple algorithms based on the three-level-atom solutions of McCall (1984), the abundance ratio N/O, assumed to be equal to N+/O+, is determined following the relation:
| (4) | |||||
where is in units of K.
For some of the galaxies in our sample, [O ii] was estimated using the empirical relation between [O ii]H and [O iii]H proposed by MRS. Using their sample of galaxies, we verified that the N/O ratios obtained using the observed and estimated values of [O ii] are the same. We also tested this relation for the SBNGs using the galaxies in our sample where [O ii] was directly measured.
4.2 The N/O ratio in normal H II regions
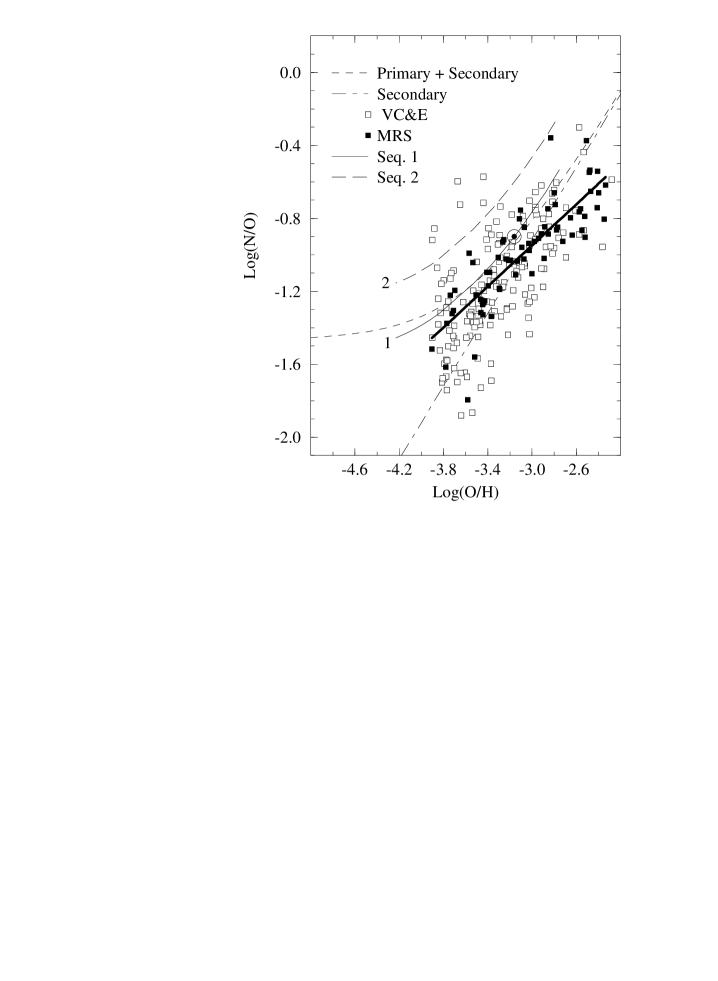
We compare in Fig. 5 the predictions of Sequences 1 and 2 with the N/O estimates for the MRS sample of normal H ii regions as well as for a subset of H ii regions from the compilation of VC&E. The N/O estimates for the MRS sample of galaxies are dex lower, on average, than the values predicted by Sequence 1. In Fig. 5, we also plotted the fits of the different models ( and production of nitrogen) proposed by VC&E to explain the values observed in different normal H ii regions. In general, the model for production seems to better describe the behavior of normal H ii regions, but it underestimates the N/O ratio at solar oxygen abundance.
We verified that the offset of 0.15 dex between the data and Sequence 1 does not depend on the relation adopted for estimating the oxygen abundance. If we use the empirical equation proposed by Zaritsky et al. (1994) for example (or a similar relation deduced from our model) the oxygen abundances of the most metal-rich H ii regions are slightly reduced, changing the slope of the MRS distribution and rendering it more similar to the relation. We could also add a term in the equation giving the N/O ratio. Indeed, the complete equation (see Pagel et al. 1992, their eq. 9) contains another term which depends on density and temperature. But this additional term is two orders too low to explain the offset, even if we assume extreme physical conditions (temperatures lower than K and densities well over 1000 cm-3).
Although 0.15 dex is probably smaller than the uncertainties on our estimates, we believe that the offset of the MRS sample with respect to sequence 1 is real. In fact, MRS already observed such a difference with their own models333Instead of lowering the nitrogen abundance, they raised the oxygen abundance to 2.3 times solar to solve the problem. This is of the order of the offset observed in our model.. In support of this hypothesis, we note that the 158 disk H ii regions from the compilation of VC&E in general follow the relation in Fig. 5. The same result was found recently by van Zee et al. (1998). It seems, therefore, that normal H ii regions usually have lower than solar N/O values at solar metallicity. Consequently, the behavior of the H ii regions in the MRS sample is normal.
4.3 The N/O ratio in SBNGs
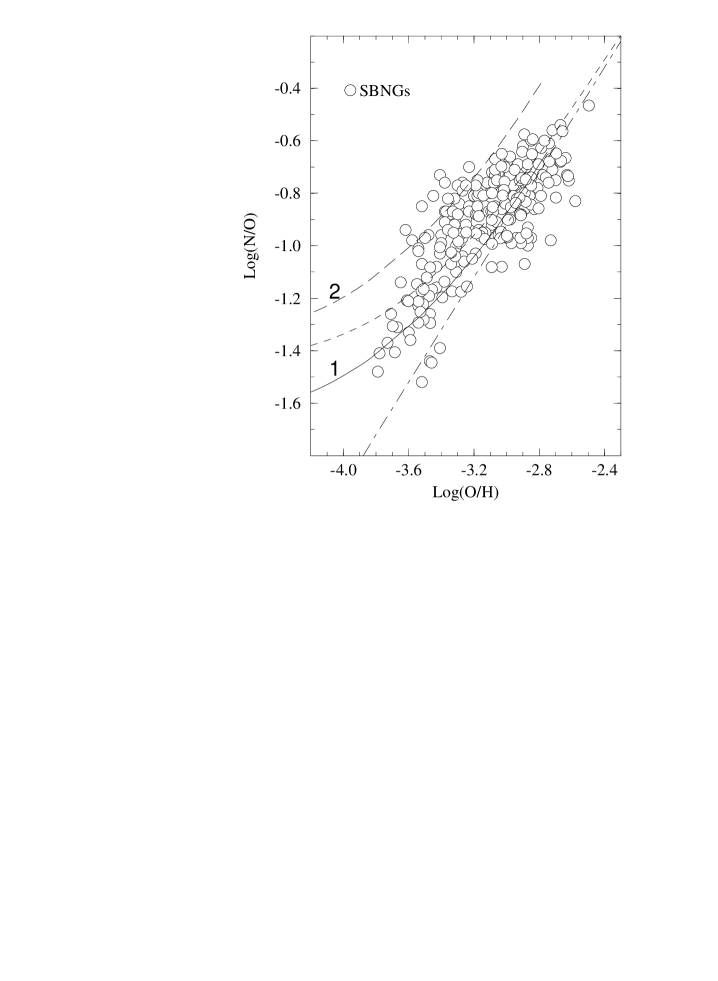
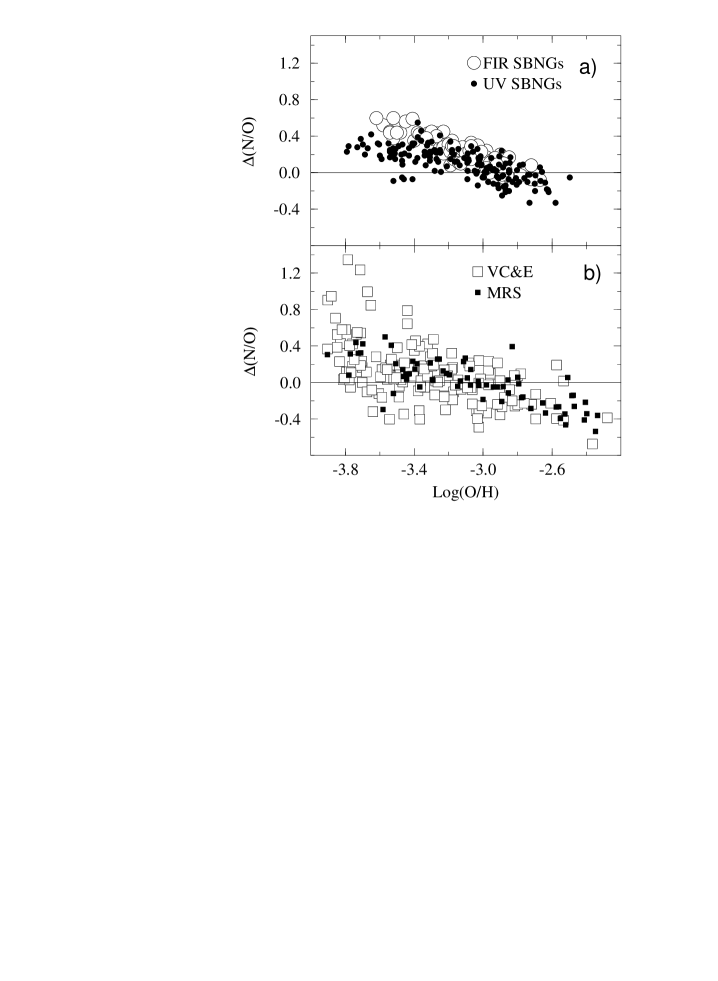
Our estimates of the N/O ratios in SBNGs are shown in Fig. 6. In these galaxies, a clear excess of nitrogen with respect to normal H ii regions is observed. For the sake of comparison, the predictions of our Sequences 1 and 2 were plotted in Fig. 6 with an offset of dex in N/O. From this, we deduce that the abundance of nitrogen in the SBNGs is at most a factor two higher than in normal disk H ii regions.
Examining how the abundance of nitrogen varies with that of oxygen, we find that the SBNGs do not follow the relation. This is shown in Fig. 6. A linear fit yields (with a correlation coefficient of 76%) N/OO/H, which is consistent with a mixture of mode of production (McGaugh 1991). But the increase of the N/O ratio with metallicity does not look like a continuous process. The N/O ratio rises sharply by about 0.3 dex at an oxygen abundance of and stays almost constant in the range log(O/H). It is important to remember that there are 243 points in this figure, therefore the lack of values on the relation over this particular range of metallicities cannot be attributed to an incompleteness of the data (compare also with Fig. 5 where we have a similar number of normal H ii regions).
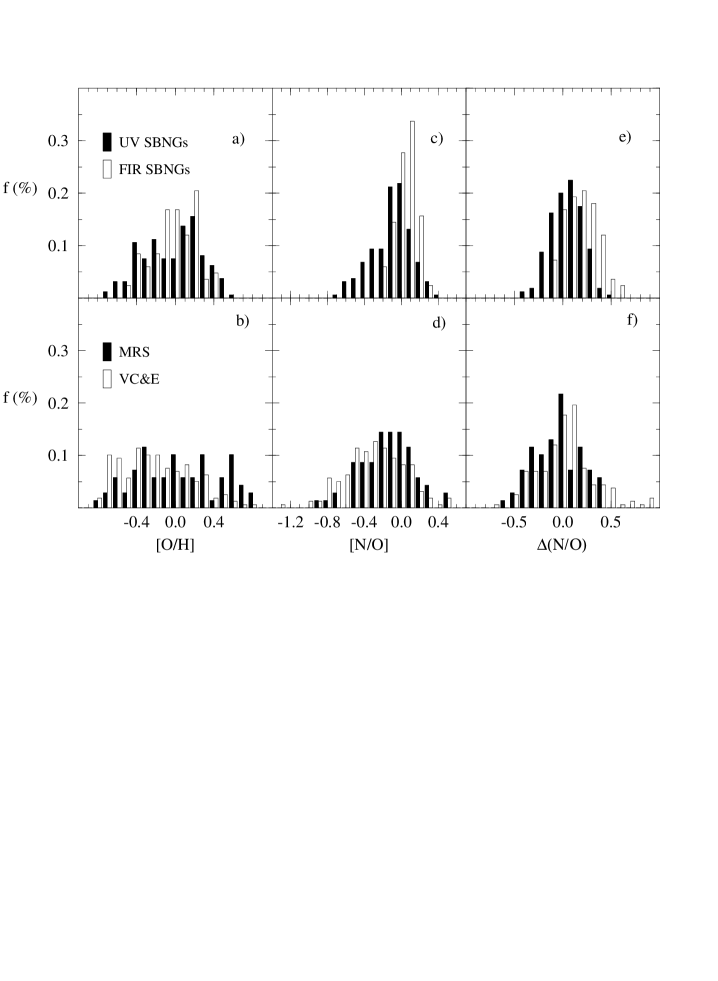
In order to better understand what the excess of nitrogen abundance in SBNGs means, we compare the distributions of oxygen and nitrogen abundances (in percentages), both relative to their solar value. The distributions of oxygen abundances for the different samples, shown in Fig. 7, are similar. The samples cover almost uniformly a metallicity range between and dex. The FIR-bright SBNGs seem slightly more metal-rich than all the other galaxies in our sample.
The distributions of nitrogen abundances, on the other hand, are significantly different in SBNGs and in disk H ii regions: a higher fraction of SBNGs have solar abundances. The dispersion is relatively high for normal disk H ii regions and their distributions peak at a value dex. This is shown in Fig. 7c and d. The dispersion of nitrogen abundances in the FIR-bright SBNGs is remarkably small. This constancy of N/O (around log(N/O) = -0.8) translates into the pseudo plateau seen in Fig. 6.
Next, we investigate the deviation (N/O) which is the difference between the observed nitrogen abundance and that predicted by the relation at the corresponding oxygen abundance. As shown in Fig. 7e and f, a high number of SBNGs have a positive deviation from the relation. This confirms the peculiar structures observed in our data in Fig. 6.
At first, it may seem surprising to find that what we define as “normal” H ii regions have slightly lower N/O ratios than solar. But there is nothing which assures us that the solar value should be the standard in these objects. This result goes in the same sense as those based on studies of the metallicities of stars in the solar neighborhood: the most frequent metallicity (estimated here by [Fe/H]) is around dex (Cayrel et al. 1997) and the Sun seems to have a higher metallicity than the majority of stars (Eggen 1978).
The fact that the N/O distribution for SBNGs peaks at the solar value implies a slight overabundance of nitrogen with respect to normal disk H ii regions. But the range of N/O values found in the SBNGs is comparable to that observed in the bulges of normal early-type spiral galaxies (TEH; van Zee et al. 1998). This is consistent with the recent discovery made by TEH. These authors found that H ii regions in early-type spirals have slightly higher N/O ratios than H ii regions in late-type spirals. Because the H ii regions in late-type spirals are generally more numerous and luminous than in early-type spirals, samples of H ii regions in normal galaxies are naturally biased towards those in late-type spirals, as can be easily verified for the MRS, VC&E and van Zee et al. (1998) samples. The SBNGs, on the other hand, are more numerous among early-type spirals (see Coziol et al. 1998a), explaining the observed higher abundance ratio in this sample.
We conclude that our observations on the nitrogen abundance of SBNGs are consistent with the chemical evolution of early-type spiral galaxies. It suggests that what we see could be the main production of nitrogen in the bulges of these galaxies.
5 Discussion
5.1 The origin of nitrogen in SBNGs
It is usually assumed that nitrogen is the product of the evolution of intermediate-mass (M MM⊙) stars. Consequently, the expected behavior of N/O as a function of O/H could be , or a mixture of both (van den Hoek & Groenewegen 1997). But a mixture of mode of production could also imply a contribution by massive stars. These two possibilities have very different consequences for the nature of SBNGs.
In the literature, we find some cases where a temporary contamination of nitrogen by massive stars is suspected (Pagel et al. 1992). The contamination is supposed to come from massive Wolf-Rayet stars. But evidence in favor of a significant contribution of nitrogen by massive stars is still weak (Esteban & Peimbert 1995). In a recent paper, Kobulnicky & Skillman (1998) showed that, even in H ii galaxies, which can be considered younger than SBNGs, the nitrogen abundance seems to be correlated to the carbon abundance, which is inconsistent with a contribution by massive stars.
For the more massive and evolved SBNGs, a significant contribution of nitrogen by massive stars would imply major bursts of star formation, not much older than a few Myrs. But, with the exception of the ultra-luminous infrared galaxies, observations of SBNGs do not support such a scenario. Their relatively low H equivalent widths, reddish colors, L(H)/L(IR) and L(B)/L(IR) luminosity ratios are more consistent with low-level bursts occurring on a long or recurrent mode (Coziol 1996). In general, SBNGs also have relatively low rates of supernovae (Turatto et al. 1989; Richmond et al. 1998; González Delgado et al. 1999), which is inconsistent with very young and massive bursts.
Another difficulty with the major burst scenario for SBNGs is to identify the origin of such sudden and energetic events. The only mean we know of is interaction (or merger) between two massive spiral galaxies, like the ultra-luminous infrared galaxies for example. But most SBNGs are relatively isolated and the origin of the bursts cannot be blamed on a recent interaction with a nearby massive companion (Coziol et al. 1997a, 1997b; Contini et al. 1998).
The production of nitrogen by intermediate-mass stars is better documented and a more likely event. According to van den Hoek & Groenewegen (1997), the bulk of nitrogen in galaxies is produced by AGB stars during their thermal pulsing phase, when the stars lose most of their mass to the ISM ( M⊙ for a 1 M⊙ star and M⊙ for a 6 M⊙ star). The low mass (M M⊙) AGBs contribute to He and C, while the high mass AGBs contribute to He and N. The typical lifetime of a 4 M⊙ star is yrs, while that of a 8 M⊙ star is yrs (Charlot & Bruzual 1991). These time scales are much longer than the typical lifetimes of massive O and B stars. Therefore, following this scenario, the bursts originate much further back in time, which solves the problem of the relative isolation.
According to the model of Charlot and Bruzual (1991), the early phase of a burst is dominated by massive stars of types O to B5. The AGB branch turns on after about 0.1 Gyr. Between 0.4 and 1.6 Gyrs, the AGB population accounts for % of the bolometric luminosity, while massive stars of type B5 to A7 contribute %. Between 1.6 and 8 Gyrs, the AGB contribution drops to %, and stars of type A7 to G0 dominate the main sequence. From this, we conclude that the main phase of production of nitrogen in a starburst should occur between 0.4 and 1.6 Gyrs after the beginning of the burst (this implies the evolution of stars from 8 to 3 M⊙). Now Coziol (1996) found that the star formation in SBNGs was nearly constant over the last 2-3 Gyr period. Thus, if we assume a median age of 1 Gyr for the bursts, 2 or 3 bursts (or more if the bursts have shorter durations) could be sufficient to produce the number of co-evolved intermediate-mass stars needed for the abundance of nitrogen observed today.
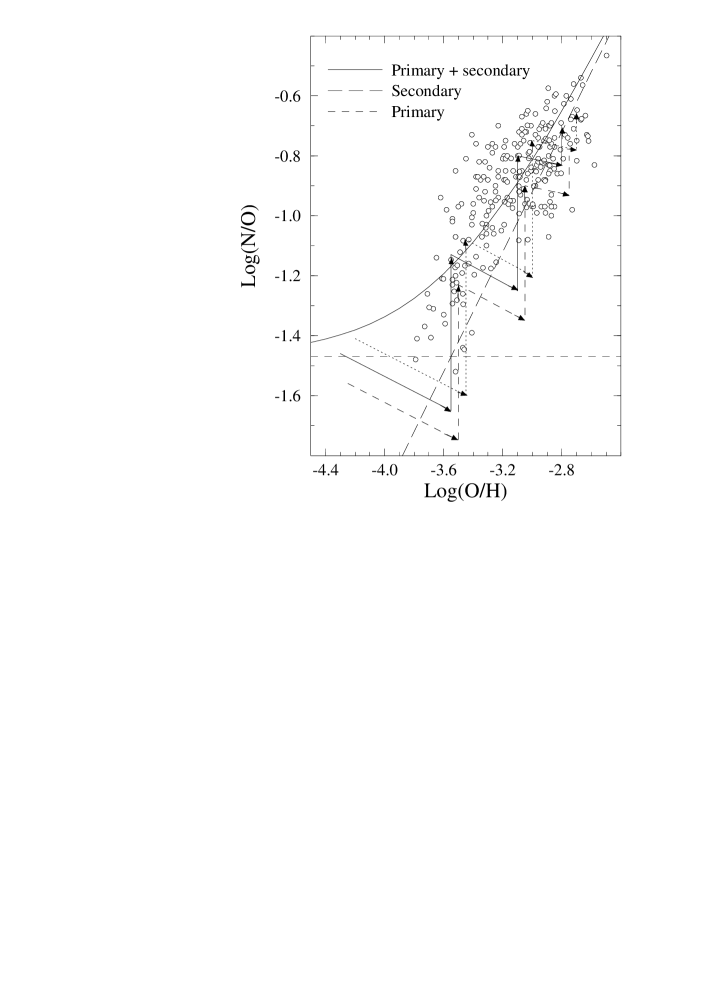
In Fig. 8, we show schematically how a sequence of bursts could explain the production of nitrogen in the SBNGs. Our scenario is based on the analytical model presented in Garnett (1990). We assume that SBNGs begin their chemical evolution with N/O and O/H ratios typical of H ii galaxies. The first phase in their chemical evolution corresponds to an increase of O/H due to the evolution of massive stars. At the same time N/O decreases (Garnett 1990; Olofsson 1995). The second phase begins Gyrs after the onset of the burst with the evolution of intermediate–mass stars. Because these stars produce mostly nitrogen, only N/O increases during this phase.
The second burst begins with an increase in O/H, but with a lower amplitude than in the first burst. Indeed, models of sequential bursts in galaxies usually assume that the successive bursts will have decreasing intensities (Gerola et al. 1980; Krügel & Tutukov 1993; Marconi et al. 1994: Köppen et al. 1995). The decrease in N/O during oxygen enrichment (the slope of the vector) is also smaller as it becomes more difficult to lower this ratio as the oxygen abundance increases (Garnett 1990). Again, about 0.4 Gyr after the beginning of the second burst, the intermediate stars evolve and N/O increases, although not as much as in the first burst.
The norms of the vectors in Fig. 8 are related to the intensity of the bursts; the stronger the burst, the higher the increase in O/H and N/O. The difference between the norm of the oxygen and nitrogen enrichment vectors should depend on the IMF and on some other parameters related to the yields of the different stars.
If we increase the number of bursts and assume that successive bursts are weaker and weaker, the sum of the vectors converges towards a line whose slope represents the mean increase of O/H and N/O in time, or in other words towards the relation. Following this scenario, a constant star formation can be viewed as an infinite sum of very low-intensity bursts of star formation, explaining why normal disk H ii regions follow the relation.
One prediction of this model is that the deviation of the observed N/O ratio from the relation ((N/O)) will decrease with the age of starburst galaxies, or, equivalently, with the increase in metallicity. In Fig. 9a, we see that this prediction is satisfied in the SBNGs. We have verified that there are no relations between the deviation (N/O) and the ratios [N ii]/H and [S ii]/H, which rules out a possible explanation of this behavior in terms of an excitation effect (indeed, following the excitation hypothesis the points with higher (N/O) would also have higher excess of emission in nitrogen and sulphur, which is not observed).
The fact that the deviation in Fig. 9a is mostly positive could be explained by the different durations of the chemical evolutionary phases. Because massive stars have very short lifetimes, the oxygen enrichment phase is almost instantaneous, and O/H rapidly reaches a maximum (the tip of each horizontal vectors in Fig. 8). The lifetime of the stars producing nitrogen, on the other hand, spans a much larger range of values. The nitrogen enrichment probably increases rapidly at the beginning, but is prolongated over a longer period of time, as the lower-mass stars evolve. As a result, the top of each vertical vector in Fig. 8 will always be much more populated, this phase representing a natural stable mode in the starburst’s evolution.
The above scenario for the formation of nitrogen in SBNGs has some interesting implications that can be further tested. Assuming that, in SBNGs, carbon is mainly produced by intermediate–mass stars, we should observe a deficiency of C with respect to N, because the AGB stars that produce the carbon have longer main sequence lifetimes than those producing the nitrogen. Then, by comparing the abundance of C with that of N we could determine the age of the sequence of bursts, while by comparing the abundance of N to that of S, we could determine the intensity and IMF of the bursts. Of course, none of this will be observed if carbon is mainly produced by massive stars (Maeder 1992), its abundance increasing with metallicity, which is indeed observed in irregular galaxies (Garnett et al. 1995) and in the disks of normal spiral galaxies (Garnett et al. 1999).
5.2 The origin of starbursts as a cosmological event
We have shown in previous papers (Coziol et al. 1997b, 1998c), that the most plausible hypothesis for explaining the nearby SBNGs is that they are the result of mergers of small-mass and gas-rich systems, probably similar to the nearby H ii galaxies, which took place sometime in the recent past. The nearly constant star formation rate over a few Gyr period (Coziol 1996) and now the time delay implied for the production of nitrogen by intermediate-mass stars both suggest merger ages of the order of 2 to 3 Gyrs. On a cosmological time scale, this corresponds roughly to redshifts z to 0.3 (using H km s-1 Mpc-1 and assuming ) in the past. Our hypothesis for explaining the nearby SBNGs predicts a population of merging galaxies at intermediate redshifts. Therefore, it is probably not a coincidence that we do find a substantial increase in the number of irregular blue star forming galaxies (Broadhurst et al. 1992; Cowie et al. 1996; Fioc & Rocca–Volmerange 1997; Lilly et al. 1998) at these redshifts. Some of these galaxies have characteristics which are consistent with our interpretation for the SBNGs, either in terms of star formation (Guzman et al. 1997; Glazebrook et al. 1998; Fioc & Rocca–Volmerange 1997) or in terms of morphology (Colless et al. 1994; Abraham et al. 1996; van den Bergh et al. 1996; Teplitz et al. 1998).
It is clear, on the other hand, that these pieces of evidence are not sufficient for identifying all the Faint Blue Galaxies as the merging progenitors of the SBNGs. There are still substantial problems to solve before understanding what the relation between these two phenomena could be. One of these problems, for instance, is the elapsed time between the two events. If some of the Faint Blue Galaxies merged to form the nearby SBNGs, they merged sometime between 2 or 3 Gyrs ago. These time scales are much too long compared to the predictions of the best models of interacting-merging galaxies that we can find in the literature (Mihos & Hernquist 1994, 1996 for example). How could these galaxies sustain high rates of star formation over such long time scales? We already proposed one solution, which is that the merging phase produces more than one burst of star formation. This could probably be achieved by introducing in the interacting-merging models different initial conditions, which would better suit the characteristics of proto-galaxies (the merging galaxies are not massive spirals but small-mass, irregular, metal-poor and gas-rich galaxies), and by regulating the bursts of star formation with a mechanism like the feedback of supernovae (Gerola et al. 1980; Krügel & Tutukov 1993) or by repeating them in a sequence of mergers (Tinsley & Larson 1979).
6 Summary and Conclusions
Using the same empirical methods as for normal H ii regions, we have estimated the N/O and O/H ratios of a sample of 243 H ii regions observed in different SBNGs. We have found clear evidence for an overabundance of nitrogen with respect to normal disk H ii regions with comparable metallicities. The range of N/O values found in the SBNGs is comparable to that observed in the bulges of early-type spiral galaxies. Our observations are consistent with the discovery made by TEH that the N/O ratios of H ii regions in the bulges of early-type spiral galaxies are higher than in late-type spirals. For the SBNGs, this suggests that what we see could be the main production of nitrogen in their bulges.
The most plausible hypothesis for the origin of nitrogen in SBNGs is that it is the product of the evolution of intermediate-mass stars. These stars would have formed during a sequence of bursts extending over a few Gyr period. Following this scenario, the origin of the bursts is located 2 to 3 Gyrs in the past. On a cosmological time scale these time intervals correspond to redshifts z to 0.3, where one observes a substantial increase in the number of star forming galaxies whose characteristics are consistent with our hypothesis. This implies that some of the Faint Blue Galaxies observed at intermediate redshifts may have merged to produce the SBNGs observed today.
The possible affiliation of the nearby SBNGs with the excess of blue galaxies in the field at intermediate redshifts suggests that the SBNGs are not a peculiar phase in the evolution of galaxies, but the result of a process which was much more common in the recent past of the Universe. This process we tentatively identify with hierarchical formation of galaxies.
Acknowledgements.
We would like to thank Dr. C. Batalha who instructed us about the stellar abundance anomalies observed in the solar neighborhood and Dr. R. R. de Carvalho for very stimulating discussions on galaxies formation and cosmology. We thank the referee, Dr. M. Peimbert, for a critical reading and judicious suggestions. We are also thankful to Dr. G. J. Ferland for kindly providing the code CLOUDY and to the technical staff of Observatoire de Haute-Provence for assistance at the telescope. Carlos Reyes acknowledges with thanks the receipt of research fellowships from the CNPq.References
- (1) Abraham R.G., Tanvir N.R., Santiago B.X., Ellis,R.S., Glazebrook K., van den Bergh S., 1996, MNRAS 279, L47
- (2) Baldwin J.A., Phillips M.M., Terlevich R., 1981, PASP 93, 5
- (3) Balzano V.A., 1983, ApJ 268, 602
- (4) Barth C.S., Coziol R., Demers S., 1995, MNRAS 276, 1224
- (5) Broadhurst T.J., Ellis R.S., Glazebrook K., 1992, Nature 355, 2
- (6) Carlos Reyes R.E., Steiner J., Elizalde F., 1998, Proceedings of the Workshop Science with Gemini, Florianopolis, Santa Catarina, Brazil, in press
- (7) Cayrel de Strobel G., Soubiran C., Friel E.D., Ralite N., François P., 1997, A&AS 124, 299
- (8) Charlot S., Bruzual A.G., 1991, ApJ 367, 126
- (9) Colless M., 1994, MNRAS 267, 1108;
- (10) Considère S., Contini T., Davoust E., Coziol R., 1999, in preparation
- (11) Contini T., 1996, Ph. D. Thesis, Université Paul Sabatier, Toulouse, France
- (12) Contini T., Considère S., Davoust E., 1998, A&AS 130, 285
- (13) Cowie L.L., Songaila A., Hu E.M., Cohen J.G., 1996, AJ 112, 839
- (14) Coziol R., 1996, A&A 309, 345
- (15) Coziol R., Demers S., Peña M., Barnéoud R., 1994, AJ 108, 405
- (16) Coziol R., Barth C.S., Demers S., 1995, MNRAS 276, 2245
- (17) Coziol R., Demers S., Barneoud R., Peña M., 1997a, AJ 113, 1548
- (18) Coziol R., Contini T., Davoust E., Considère S., 1997b, ApJ 481, L67
- (19) Coziol R., Torres C.A.O., Quast G.R., Contini T., Davoust E., 1998a, ApJS 119, 239
- (20) Coziol R., Ribeiro A.L.B., de Carvalho R., Capelato H.V., 1998b, ApJ, 493, 563
- (21) Coziol R., Contini T., Davoust E., Considère S., 1998c, in Abundance Profiles: Diagnostic Tools for Galaxy History, Eds. D. Friedli, M. Edmunds, C. Robert, and L. Drissen, San Francisco, ASP Conf. Ser. Vol. 147, p. 219
- (22) Coziol R., Demers S., Huisacayna Soto J., 1999, in preparation
- (23) Dopita M.A., Evans I.N., 1986, ApJ 307, 431
- (24) Doyon R., Coziol R., Demers S., 1999, in preparation
- (25) Dufour R.J., Shields G.A., Talbot R.J., 1982, ApJ 252, 461
- (26) Edmunds M.G., 1989, in Evolutionary Phenomena in Galaxies, J.E. Beckman, B.E.J. Pagel, eds, Cambridge University Press, Cambridge, p. 356
- (27) Edmunds M.G., Pagel B.E.J., 1984, MNRAS 211, 507
- (28) Eggen O.J., 1978, ApJ 222, 191
- (29) Esteban C., Peimbert E., 1995, A&A 300, 78
- (30) Evans I.N., Dopita M.A., 1985, ApJS 58, 125
- (31) Ferland G.J., 1997, University of Kentucky Department of Physics and Astronomy Internal Report
- (32) Filippenko A.V., Sargent W.L.W., 1985, ApJS 57, 503
- (33) Fioc M., Rocca–Volmerange B., 1997, MNRAS in press (astro-ph/9709064)
- (34) French H.B., 1980, ApJ 240, 41
- (35) Gallimore J.F., Keel W.C., 1993, AJ 106, 1337
- (36) Garnett D.R., 1989, ApJ 345, 282
- (37) Garnett D.R., 1990, ApJ 363, 142
- (38) Garnett D.R., Skillman E.D., Dufour R.J., Peimbert M., Torres-Peimbert S., Terlevich R, Terlevich E., Shields G.A., 1995, ApJ, 443, 64
- (39) Garnett D.R., Shields G.A., Peimbert M., Torres-Peimbert S., Skillman E.D., Dufour R.J., Terlevich E, Terlevich R.J., 1999, ApJ, in press (astro-ph/9810026)
- (40) Gerola H., Seiden P.E., Schulman L.S., 1980, ApJ 242, 517
- (41) Glazebrook K., Abraham R., Santiago B., Ellis R., Griffiths R., 1998, MNRAS 297, 885
- (42) Gonçalvez A.C., Véron–Cetty M.-P., Véron P., 1998, A&A 333, 877
- (43) Gonçalvez A.C., Véron–Cetty M.-P., Véron P., 1999, A&AS, 135, 437
- (44) González Delgado R.M., Perez E., Diaz, A.I., Garcia-Vargas M.L., Terlevich E., Vilchez J.M., 1995, ApJ 439, 604
- (45) González Delgado R.M., Perez E., Tadhunter C., Vilchez J.M., Rodriguez-Espinosa J.M., 1997, ApJS 108, 155
- (46) González Delgado R.M., Garcia-Vargas M.L., Goldader J., Leitherer C., Pasquali A., 1999, ApJ, in press (astro-ph/9810331)
- (47) Grevesse N., Noels A., 1993, in Origin and Evolution of the Elements, eds. N. Prantzos, E. Vangioni-Flam, M. Cassé (Cambridge: Cambridge Univ. Press), p.15
- (48) Guzman R., Gallego J., Koo D.C., Phillips A.C., Lowenthal J.D., Faber S.M., Illingworth G.D., Vogt N.P., 1997, ApJ 489, 559
- (49) Hashimoto Y, Oemler A., Huan Lin, Tucker D.L., 1998, ApJ, 499, 589
- (50) Heckman T.M., 1980, A&A 87, 152
- (51) Hill T.L., Heisler C.A., Sutherland R., Hunstead, R. W., 1999, AJ, 117, 111
- (52) Huchra J.J.P., 1977, ApJS 35, 171
- (53) Keel W.C., van Soest E.T.M., 1992, A&A 94, 553
- (54) Kennicutt R.C., Keel W.C., Blaha C.A., 1989, AJ 97, 1022
- (55) Kim D.-C., Veilleux S., Sanders D.B. 1998, ApJ, 508, 627
- (56) Kobulnicky H.A., Skillman E.D., 1998, ApJ 497, 601
- (57) Köppen J., Theis Ch., Hensler G., 1995, A&A 296, 99
- (58) Krügel E., Tutukov A.V., 1993, A&A 275, 416
- Lehnert & Heckman (1994) Lehnert M.D., Heckman T.M., 1994, ApJ 426, L27
- Lehnert & Heckman (1996) Lehnert M.D., Heckman T.M., 1996, ApJ 462, 651
- (61) Lilly S.J., Schade D., Ellis R.S., Le Fevre O., Brinchmann J., Abraham R., Tresse L., Hammer F., Crampton D., Colless M., Glazebrook K., Mallen-Ornelas G., Broadhurst T., 1998, ApJ, 500, 75
- (62) Lonsdale C.J., Smith H.J., Lonsdale E., Carol J., 1993, ApJ 405, 9
- (63) Maeder A., 1992, A&A, 264, 105
- (64) Marconi G., Matteuci F., Tosi M., 1994, MNRAS 270, 35
- (65) McCall M.L., 1984, MNRAS 208, 253
- (66) McCall M.L., Rybski P.M., Shields G.A., 1985, ApJS 57, 1
- (67) McGaugh S., 1991, ApJ 380, 140
- (68) Mihos J.C., Hernquist L., 1994, ApJ 425, L13
- (69) Mihos J.C., Hernquist L., 1996, ApJ 464, 641
- (70) Ohyama Y. Taniguchi Y. Terlevich R., 1997, ApJ, 480, L9
- (71) Olofsson K., 1995, A&A 293, 652
- (72) Pagel B.E.J., Edmunds M.G., Blackwell D.E., Chun M.S., Smith G., 1979, MNRAS 189, 95
- (73) Pagel B.E.J., Simonson E.A., Terlevich R.J., Edmunds M.G., 1992, MNRAS 255, 325
- (74) Pei Y.C., 1992, ApJ 395, 130
- (75) Peimbert M., Torres–Peimbert S., 1981, ApJ 245, 845
- (76) Rauch T., 1997, A&A, 320, 237
- (77) Richmond M.W., Filippenko A.V., Galisky J., 1998, PASP 110, 553
- (78) Rose J.A., Cecil G., 1983, ApJ 266, 531
- (79) Salzer J.J., MacAlpine G.M. & Boroson T.A., 1989, ApJS 70, 447
- (80) Sargent W.L.W., 1972, ApJ 173, 7
- (81) Searle L., Sargent W.L.W., 1972, ApJ 173, 25
- (82) Shields J.C., Filippenko A.V., 1990, AJ 100, 1034
- (83) Shields J.C., Kennicutt R.C., 1995, ApJ 454, 807
- (84) Skillman E.D., 1989, ApJ 347, 883
- (85) Stauffer J.P., 1982, ApJS 50, 517
- (86) Storchi–Bergmann T.S., 1991, MNRAS 249, 404
- (87) Storchi–Bergmann T.S., Wilson A.S. 1996, in The interplay between massive star formation, the ISM and galaxy evolution, D. Kunth, B. Guiderdoni, N. Heydari–Malayeri, T.X. Thuan, eds, éditions Frontières, Gif–sur–Yvette (France), p. 613
- (88) Terlevich R.J., Tenorio-Tagle G., Franco J., Boyle B.J., 1991, in The nature of compact objects in Active Galactic Nuclei. Proceedings of the 33rd Herstmonceux conference. Eds. A. Robinson, R. Terlevich, Cambridge University Press, p. 209
- (89) Teplitz H.I., Gardner J.P., Malumuth, E. M., Heap, S.R., 1998, ApJ, 507, L17
- (90) Thurston T.R., Edmunds M.G., Henry R.B.C., 1996, MNRAS 283, 990
- (91) Tinsley B.M., Larson R.B., 1978, ApJ 219, 46
- (92) Tinsley B.M., Larson R.B., 1979, MNRAS 186, 503
- (93) Torres-Peimbert S., Peimbert M., Fierro J., 1989, ApJ, 345, 186
- (94) Turatto M., Cappelaro E., Petrosian A.R., 1989, A&A 217, 79
- (95) Vacca W.D., Conti P.S., 1992, ApJ 410, 543
- (96) van den Bergh S., Abraham R.G., Ellis R.S., Tanvir N.R., Santiago B.X., Glazebrook K.G., 1996, AJ 112, 359
- (97) van den Hoek B., Groenewegen M.A.T., 1997, A&AS 123, 305
- (98) van Zee L., Salzer J.J., Haynes M.P., 1998, ApJ L1
- (99) Veilleux S., Osterbrock D.E., 1987, ApJS 63, 295
- (100) Veilleux S., Kim D.-C., Sanders, D.B., Mazzarella J.M, Soifer B.T., 1995, ApJ 98, 171
- (101) Véron P., Véron M.-P., Bergeron J., Zuidervijk E.J., 1981, A&A 97, 71
- (102) Véron P., Gonçalvez A.C., Véron–Cetty M.-P., 1997, A&A 319, 52
- (103) Vila–Costas M.B., Edmunds M.G., 1993, MNRAS 265, 199
- (104) Weedman D.W., 1983, ApJ 266, 479
- (105) Weedman D.W., Feldman F.R., Balzano V.A., Ramsey L.W., Sramek R.A., Wu C.-C., 1981, ApJ 248, 105
- (106) Zaritsky D., Kennicutt R.C., Huchra J.P., 1994, ApJ 420, 87