Hot stellar population synthesis from the UV spectrum: the globular cluster M79 (NGC 1904)
Abstract
We have analyzed the far UV-spectrum of the globular cluster M79. We show that the nearly Gaussian mass distribution of zero-age horizontal-branch stars, as derived by Dixon et al. (1996), is able to reproduce the far-UV Hopkins Utraviolet Telescope (HUT) spectrum, if there is a luminous UV-bright star of about = 9,500 K within the HUT entrance slit, or, more likely, if the horizontal branch morphology becomes considerably redder in the core of M79, as observed in some other centrally condensed globular clusters. Agreement between the synthetic and observed far-UV spectra for M79 would also be improved if the surface abundances of the heavy elements in the hot horizontal-branch stars were enhanced by radiative diffusion. Contrary to Dixon et al. (1996) we do not need extremely low gravities to reproduce the width of Ly .
Key Words.:
Globular clusters: individual: M79 – Stars: horizontal-branch – Hertzsprung-Rusell (HR) and C-M diagrams – Stars: evolution – Ultraviolet: General – Ultraviolet: stars1 Introduction
Spectra of globular clusters, elliptical galaxies, and spiral-galaxy bulges reveal an excess of ultraviolet flux (UVX), indicating a hot stellar component in these old systems. The source of the UV flux excess has been identified as hot horizontal branch (HB) stars (Greggio & Renzini 1990; Dorman et al. 1995; Yi et al. 1995). Now that this interpretation of the UVX appears to be secure, the focus of attention has shifted from simply detecting a UV flux excess in old stellar systems to using the observed UV flux excess as a diagnostic to determine the morphology of the underlying HB population. If the metallicity is known, one can infer the mass distribution of the HB stars from the HB morphology which, in turn, provides information on the amount of mass loss along the red giant branch (RGB) in these old, and generally metal-rich, systems.
The observational goal then is to determine the HB morphology from the integrated spectra. The far-ultraviolet spectral region ( Å) is especially helpful for this purpose in that it nicely isolates HB stars, which are often among the hottest stars in an old stellar system. Before the technique of far-UV spectroscopy can be exploited however, several important questions must be answered. Is the HB morphology derived from the integrated far-UV spectrum unique? And, most importantly, is it consistent with that given by the color-magnitude diagram (CMD)? These are the questions that we address in this study.
Our approach in attempting to answer these questions is to study a test case– the intermediate-metallicity globular cluster, M79. The far-UV spectrum of this cluster, obtained by the Hopkins Ultraviolet Telescope (HUT) during the Astro-1 space shuttle mission in December 1990, shows a pronounced far-UV flux excess (Dixon et al. 1996, hereafter DDDF). Because of its relative proximity [distance modulus (m - M) = 1545, Ferraro et al. 1992], individual stars in this cluster can be resolved and the UV-bright sources identified. Color-magnitude diagrams of M79 constructed in the optical (Ferraro et al. 1992) and ultra-violet (Hill et al. 1996) confirm that the cluster has a very blue horizontal branch, and that most of the far-UV flux (van Albada et al. 1981, DDDF) comes from individual blue HB and post-HB stars.
After a thorough study, DDDF found that the observed far-UV spectrum of M79 could not be reproduced by summing the model spectra of the HB stars inferred from the CMD. Their model that best fit the continuous flux distribution produced too broad a profile of the gravity-sensitive feature, Ly . They therefore concluded that ”it is not yet possible to combine the UV and optical data to provide meaningful constraints on the HB mass distributions in globular clusters.” DDDF speculated that the source of the discrepancy lies not in the stellar evolutionary models, but in the UV spectral synthesis, specifically, the treatment of line broadening of the HI Lyman absorption lines. This discrepancy between the observed HB morphology from the CMD and that inferred from the far-UV spectrum is important because it raises doubts about the use of population synthesis techniques to determine the properties of the hot population in other stellar systems.
In this paper, we re-analyze the far-UV HUT spectrum of M79 using the most reliable modeling techniques currently available. We begin in Sect. 2 with a discussion of the observational data. As described in Sect. 3, our analysis is based on new stellar evolutionary tracks and high-resolution synthetic spectra computed with the stellar-atmosphere code, SYNSPEC (Hubeny et al. 1994). In Sect. 4, we show that the observed far-UV spectrum can be reproduced if there are UV-bright post-HB stars as well as HB stars in the entrance aperture to the HUT spectrograph, or, more likely, if the relative proportion of red HB stars increases in the core of M79. In addition, we discuss how an enrichment in the surface abundance of the metals due to radiative diffusion would affect the far-UV spectrum. We find no evidence for errors in the model atmospheres for these types of stars.
2 Observations
The ultraviolet spectrum of M79 obtained by HUT covers the wavelength range from 900 to 1700 Å at a resolution of 3 Å. For more details about the HUT spectrograph and telescope, see Davidsen et al. (1992). The spectrum was reduced by DDDF and placed in the public archives. The reduction included a subtraction of airglow emission and absolute flux calibration. Following DDDF, we corrected for interstellar extinction assuming E(B–V)=0.01 and using a standard extinction curve from Savage & Matthis (1979). We did not correct for interstellar absorption in the Lyman lines, since this absorption affects only the cores of the lines, which are unusable because of imperfect airglow-subtraction. Because of these uncertainties, we did not try to fit the line cores of Ly , Ly , or Ly or the O I lines at 1304, 1356 Å.
According to DDDF, the HUT entrance aperture, which measures 9” 116”, crossed the center of the cluster. Optical (Ferraro et al. 1992) and ultraviolet (Hill et al. 1996) CMD’s have been constructed for M79. However, neither one includes stars in the cluster core, because of crowding problems. The optical CMD reaches in to 15” from the center, while the UV CMD goes in only to 45” from the center. Consequently, we have no direct knowledge about the stars in the cluster core, which provide the bulk of the observed flux measured by HUT. We therefore make a preliminary working assumption that the outer parts of the cluster are representative of the core. In Sect. 4, we will show that the UV spectrum of M79 can be reproduced if this assumption is relaxed in the way suggested by the observed radial trends of the HB population in other centrally condensed globular clusters.
The total number of HB stars in M79 is estimated by Ferraro et al. (1992) at 220 10; of which 20 – 40 should be present in the HUT slit (DDDF). Individual UV photometry for M79 has been obtained by the Ultraviolet Imaging Telescope (UIT) and the International Ultraviolet Explorer (IUE). UIT discovered two UV bright stars (UIT 1 and UIT 2) which are not relevant to our work, because they do not lie in the HUT slit. Star Hill 116 (Hill et al. 1996), at a distance of 3″ from the cluster center, however, is present in the HUT slit. This star lies in the center of the cluster and because of the crowding, it is likely to be a blend (Hill et al. 1996). Through decomposition of IUE data, Altner & Matilsky (1993) have also inferred the presence of a UV bright star, Source 3 , close to the center of light of M79. At this point, we cannot convincingly conclude if Source 3 and Hill 116 are the same source (Hill et al. 1996), or if Source 3 is another star (or group of stars) lying at the edge of the HUT aperture. Altner & Matilsky (1993) derived the following parameters for Source 3: = 13,000 K, and . Following DDDF we will include Source 3 in the synthetic spectra presented in Sect. 4.
3 Method
3.1 Stellar Evolutionary Tracks
We make use of new canonical stellar evolutionary tracks computed with the input physics described by Sweigart (1997). These tracks assume a scaled-solar metallicity of , which is consistent with the mean metallicity of M79, [Fe/H] (Ferraro et al. 1992). Fig. 1 shows these tracks in the HR diagram for 10 different masses between 0.500 (blue HB (BHB) stars which lost M 0.3 on the RGB) and 0.693 (red HB (RHB) stars which lost M 0.1 on the RGB).
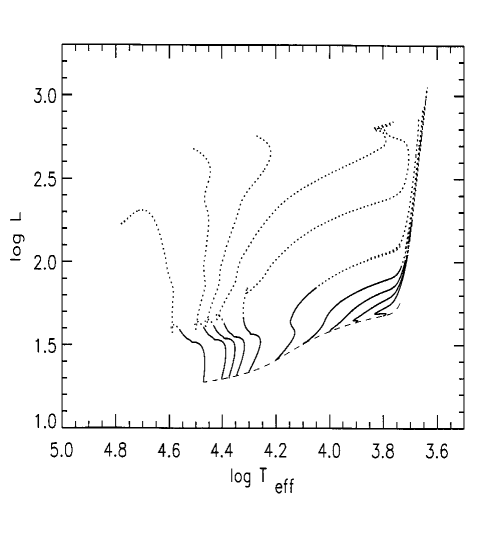
In order to compute the integrated far-UV spectrum, we must know the stellar mass distribution along the HB. We base our assumed mass distribution on the one derived by DDDF from the Ferraro et al. (1992) CMD of M79. This distribution is approximately Gaussian with a peak at M = 0.6(ZAHB = 10,000K) and a standard deviation = 0.05 . DDDF define their mass distribution at an increment of 0.01 in the HB mass MHB (see their Fig. 4a).
We have slightly modified the DDDF mass distribution to make it consistent with our updated evolutionary models, as follows. For each of their values of MHB we determine the mass M of the corresponding model from our computations which has the same ZAHB effective temperature. A new HB track for M = M is then interpolated from the computed tracks shown in Fig. 1. This procedure yields the set of 14 HB tracks that we have used to compute the integrated spectra. The masses of these interpolated tracks together with their corresponding ZAHB effective temperatures are given in columns (2) and (4) of Table 1. The relative number of HB stars at each mass, as taken from the mass distribution in Fig. 4a of DDDF, is indicated by the quantity in column (3).
Since the location of a star along its HB track is not known a priori, we have decided to represent the contribution of the HB stars of a particular mass to the integrated spectrum by averaging their spectra over the HB phase. To do this, we first convert each HB track into a probability diagram by dividing the HR diagram into cells of ( , ) in the surface gravity and effective temperature. Each cell is assigned a weight equal to the time spent in that particular cell multiplied by the corresponding bolometric luminosity . The weight thus provides the contribution of each cell to the total flux emitted by stars on that track. If the track is subdivided into cells, the average light, L at the wavelength , emitted by a star of mass in the HB phase is given by:
| (1) |
where is the monochromatic flux, and is the bolometric flux of cell . The integrated light ( ) from a stellar system with a mass distribution is then the weighted sum of these contributions:
| (2) |
where is the number of HB stars with mass , and is the total number of HB stars in the HUT slit. The summation is taken over the range from 0.5001 (ZAHB 29,500 K) to 0.6639 (ZAHB 8,000 K), as listed in Table 1. Table 1 also gives the time averaged values of , , and along each track.
The probability diagrams cover the range in from 3.0 to 5.5 in steps of 0.5 dex and the range in from 8,000 to 35,000 K. The step size in depended on the temperature as follows: = 500 K for 8,000 K 13,000 K; 1,000 K for 13,000 K 20,000 K; 2,500 K for 20,000 K 30,000 K; and 5,000 K for 30,000 K 35,000 K . Stars with 8,000 K do not emit a significant amount of UV flux and therefore are not included in the summation of Eq. (2). There are no HB stars with 35,000 K (see later).
This predictive approach will not work for the post-HB stars because there are so few of them. The HB lifetime is 100 Myr compared to a post-HB lifetime of 15-20 Myr , so by time-scale arguments, there should be only 3-6 post-HB stars present in the HUT slit. Even though the post-HB stars may be few in number, they cannot be ignored because of their high luminosities - up to an order of magnitude brighter than the HB stars (Fig. 1). Compounding the problem is the fact that the post-HB phase is a tumultuous time, in which a star traverses a large area of the HR diagram as it undergoes numerous He flashes. Since it is impossible to predict the most probable locations of the post-HB stars, we let the observed HUT spectrum itself guide our selection of candidate post-HB stars. That is, we first model the contribution of the HB stars, which are numerous enough that they can be treated in a statistical fashion. We then use the residual between the observed spectrum and the HB component to ascertain the properties of the remaining stars.
3.2 Model Spectra
We used Kurucz’ (1993) LTE model atmospheres for = -1.5 and the spectrum synthesis code, SYNSPEC (Hubeny et al. 1994) to generate the theoretical spectra, . In the spectrum synthesis, the metal abundances were scaled to a with a 0.4 dex enhancement of process elements (O, Ne, Mg, Si, S, Ca, and Ti) . A microturbulent velocity, km/s was adopted, consistent with the model atmosphere. The line list includes all lines between measured energy levels as well as all Fe II to Fe VII and Ni II to Ni VII lines between predicted energy levels (Kurucz 1994) - in all, about 3.4 million lines in total between 900 Å and 1700 Å. Natural, Stark and Van der Waals broadening were taken into account for metal lines. For hydrogen, we used Schoening’s (priv. comm.) most recent Stark broadening tables. The flux distribution was calculated every 0.01 Å, and was later degraded to 3 Å for comparison with HUT data, and to 10 Å for comparison with the work of DDDF who used Kurucz flux distributions.
DDDF suggest that there may be errors in the line-broadening theory of the H Lyman lines. We investigated this possibility by comparing profiles of Lyman lines computed by Kurucz (1993), who used an outdated theory, with our models which make use of more modern line-broadening theory (Schoening, priv. comm.) and which have been tested against observations of white dwarfs (c.f. Lanz & Hubeny 1995).We find no significant differences between the two profiles, so we conclude that line-broadening theory is not a likely source of error.
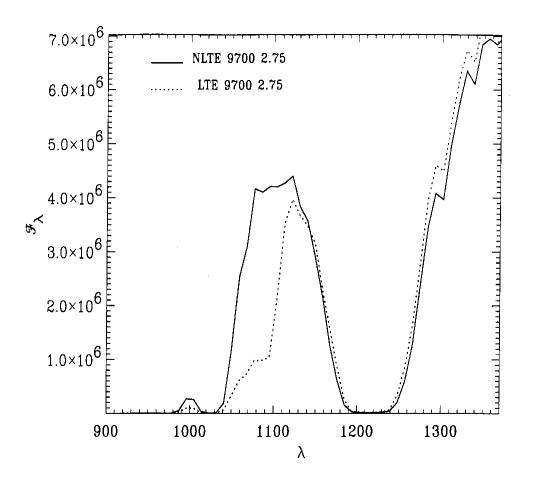
Another potential error is the assumption of local thermodynamic equilibrium (LTE) for the model atmosphere and spectrum. We investigated this possibility for the case of a post-HB star with the atmospheric parameters, = 9,700 K and = 2.75. Fig. 2 compares the flux distribution of a LTE model (as would be computed by Kurucz) and a model in which hydrogen and carbon are allowed to be in NLTE in the spectrum synthesis. In the NLTE model, Ly is only slightly stronger than the LTE model, but the C I 1100 ionization edge is erased due to NLTE over-ionization of C I. Similar effects are expected for higher-gravity stars with similar effective temperatures (Hubeny 1981), so that the computed spectrum may seriously underestimate the flux of HB stars in M79 in the wavelength interval below 1100 Å . Other NLTE effects are expected at very high temperatures ( 35,000 K), which might be attained by some post-HB stars. However, we find no evidence of stars hotter than the bluest HB stars identified in the CMD of M79. The assumptions of hydrostatic equilibrium and a plane-parallel geometry are quite appropriate for HB stars, since mass-loss is unimportant in these stars.
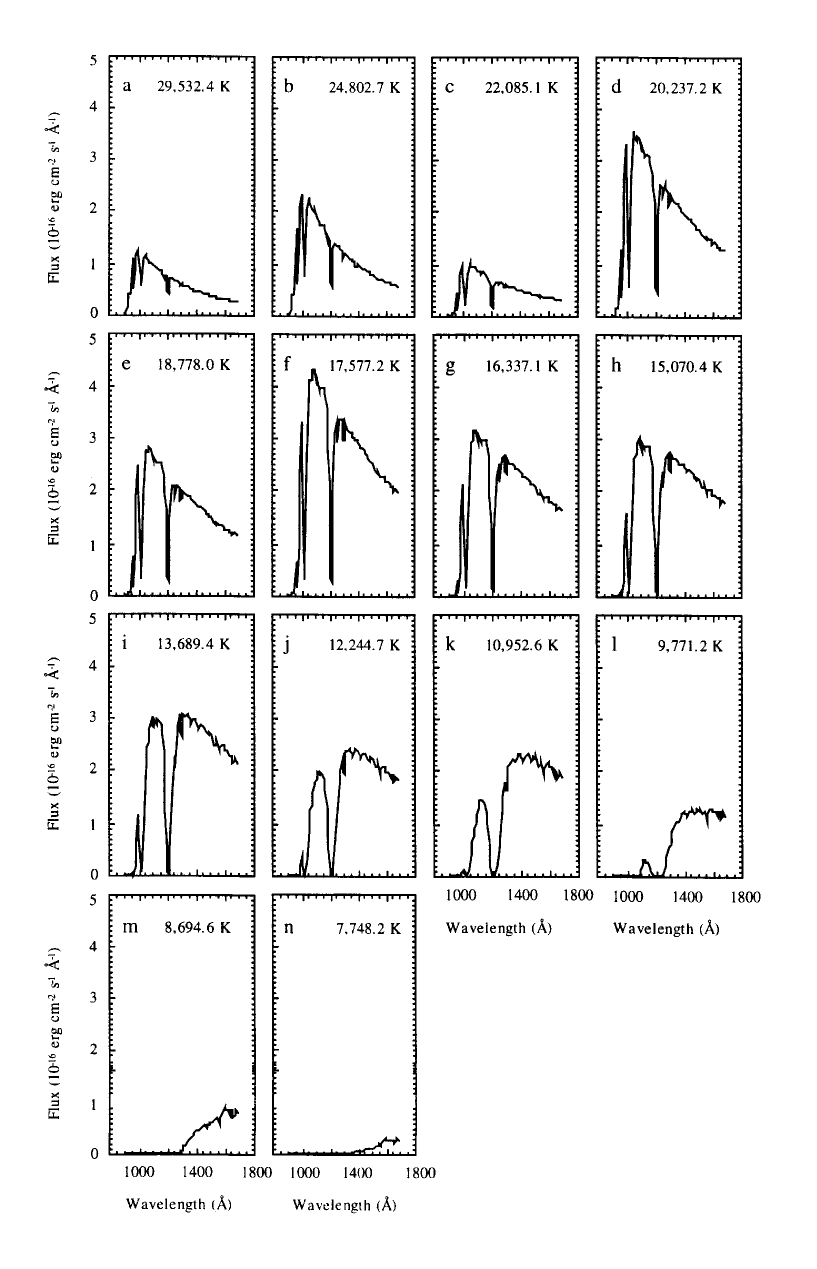
| Panel | Mass | ZAHB | ||||
|---|---|---|---|---|---|---|
| 0.5001 | 2 | 29532 | 29641 | 5.57 | 25.59 | |
| 0.5093 | 4 | 24803 | 24246 | 5.21 | 26.64 | |
| 0.5196 | 2 | 22085 | 21181 | 4,97 | 27.61 | |
| 0.5295 | 8 | 20237 | 19109 | 4.79 | 28.48 | |
| 0.5395 | 7 | 18778 | 17489 | 4.63 | 29.35 | |
| 0.5493 | 12 | 17577 | 16188 | 4.49 | 30.25 | |
| 0.5608 | 10 | 16337 | 14905 | 4.34 | 31.45 | |
| 0.5735 | 11 | 15070 | 13680 | 4.17 | 33.04 | |
| 0.5880 | 14 | 13689 | 12436 | 3.99 | 35.23 | |
| 0.6037 | 13 | 12245 | 11209 | 3.79 | 37.93 | |
| 0.6186 | 16 | 10953 | 10128 | 3.59 | 40.65 | |
| 0.6334 | 13 | 9771 | 9153 | 3.40 | 43.30 | |
| 0.6486 | 14 | 8695 | 8267 | 3.21 | 45.80 | |
| 0.6639 | 14 | 7748 | 7502 | 3.03 | 48.05 |
Fig. 3 shows the flux contributed by HB stars of each of the 14 different masses listed in Table 1. The scales of the plots are the same for each stellar mass. The contribution of mass 0.6334 with a ZAHB of about 10,000 K (which is close to the maximum of the mass distribution) is relatively small (panel ). Since this is the range of effective temperatures most prone to NLTE effects in C I, this shows that our neglecting of NLTE effects should not lead to significant errors in the total integrated flux in the vicinity of Ly . In the spectral region near Ly , roughly 97% of the total integrated flux is produced by models with a ZAHB 10,000 K; about 75% from models with = 14,000 - 20,000 K; and 60% from models with = 16,000 - 25,000 K. As expected, Ly in the cooler (more massive) HB models is stronger than in the hotter (less massive) models. At longer wavelengths in the HUT spectrum, the contribution of cooler HB stars becomes more important: e.g., stars with ZAHB 10,000 K contribute about 14% of the flux at 1600 Å as compared to 3% at 1200 Å.
4 Results
4.1 The HB component
Fig. 4 compares the observed spectrum of M79 with the synthetic spectrum representing the contributions from 25 HB stars having the mass distribution given in Table 1 plus the UV-bright star Source 3 (Sect. 2). The model spectrum gives a good fit to the observed flux level shortward of Ly (1216 Å ), but it seriously underestimates the flux at longer wavelengths - a problem that will be discussed in the next subsection. On the other hand, there is generally good agreement between the simulated and observed wings of Ly line profiles. (We neglect the Lyman line cores, since they are affected by airglow emission; we also exclude Ly (972 Å) from comparison, since it is blended with a strong C III line (977 Å). At longer wavelengths, we note that the C II 1335 line is too strong, which suggests that the assumed Carbon abundance (scaled to ) is too high. Quite possibly, carbon has been depleted in favor of nitrogen if CNO-cycle processed material has been brought to the stellar surface during the RGB phase (see, e.g., Kraft 1994). In addition, the predicted Silicon resonance lines (Si I 1560, 1562, Si II 1260, 1265, 1304, 1309, 1526, 1533, and Si III 1301, 1303) are also more prominent in our synthesis than the observations, suggesting that the assumed -element enhancement of 0.4 dex is too high or that diffusion in the hotter HB stars is affecting the surface Si abundance.

4.2 Contributions to the long-wavelength flux
The outstanding discrepancy between our synthetic spectrum and the HUT spectrum is at longer wavelengths ( Å). This discrepancy could have a variety of causes.
We investigate three possibilities: (1) the high flux at longer wavelengths is due to one or more cool post-HB stars, which have not yet been accounted for in our synthesis, (2) the high flux at longer wavelengths is due to a higher fraction of cool HB stars than is given in Table 1, and/or (3) the flux distribution is altered by high surface abundances of iron and nickel, which preferentially suppresses the short-wavelength flux.
4.2.1 Post-HB Stars
Since the post-HB lifetime is 15-20% of the HB lifetime, we would expect about 5 post-HB stars to contribute to the observed flux. Since they are up to an order of magnitude brighter (Fig. 1) than stars on the HB, they can contribute a larger share of the observed flux than their numbers would suggest. We do know about one post-HB star in the HUT slit: the Altner & Matilsky (1993) UV-bright star located only 3” from the center of the cluster. However, its temperature ( 13,000 K) is so similar to those of HB stars contributing a large fraction of the far-UV flux (panel in Fig. 3), that it does not help to resolve the low predicted flux at longer wavelengths. If it were omitted in the synthesis, more HB stars would be needed, but it would produce no net changes in the flux distribution, as can be seen from Figs. 4 and 5.

Taken at face value, the residual (observed – simulated) spectrum shown in Fig. 4b (or Fig. 5b) resembles a cool ( 9,500 K) , luminous ( = 450 ) star. Such a star would correspond to a luminous post-HB star. As shown in Fig. 6 , adding such a star works to resolve the long-wavelength flux discrepancy. And since this post-HB star has a low surface gravity () , it does not affect the wings of Ly , for which there already was good agreement. HST observations of the core of M79 would test for the existence of such a luminous, post-HB star.

4.2.2 Cool, massive HB Stars
The mass distribution listed in Table 1 was derived from the CMD of stars at least 15″ from the cluster center, because of crowding problems. Therefore we have no direct knowledge of the stars located close to the center which make a substantial contribution to the observed spectrum. Until now, we have assumed that the mass distribution near the cluster center is the same as that in the outer parts. However, there is observational evidence indicating that the HB morphology may become redder within the cores of such centrally condensed clusters as M79.
Battistini et al. (1985) have obtained observations on the relative number of HB stars lying blueward and redward of the gap at 10,000 K in M15 (see also Buonnano et al. 1985). Their results suggest a radial trend with the fraction of HB stars redder than the gap increasing from 0.3 for 3′.5 r 8.0′ to 0.5 for 1′.9 r 3′.5. Stetson (1991) has also found possible evidence for a deficiency of the extended BHB stars in the core of M15. Among the stars redward of the gap in M15, he also finds that the ratio of stars redward of the instability strip compared to those blueward of the instability strip increases significantly towards the center. In the case of NGC6752 Buonanno et al. (1986) have reported that the relative number of stars redward of the gap in this cluster compared to those blueward of the gap increases from 1:1 for r 4′.5 to 2:1 for r 4′.5. We also mention the results of Rose et al. (1987), who suggest that the HB is significantly redder within the inner 10″ of M30 based in part on the integrated spectrum of the core of this cluster and in part on the photometry of Cordoni & Auriere (1984). Evidence for a radial gradient in the HB morphology has also been found in the less centrally condensed cluster NGC6229, where the red HB stars seem to be significantly more centrally concentrated than the blue HB stars (Borissova et al. 1997). We note that Ferraro et al. (1992) reported an opposite trend for M79, i.e., a decrease in the number of faint blue stars with increasing radius. However, these results only apply to radii 60″ which is outside the region covered by the HUT entrance slit.
In view of these observational results, we have recomputed the integrated spectra for M79 with the number of redder HB stars increased. We find that adding the following stars produces a good fit to the flux distribution: 1 star at ZAHB 14,000 K (M = 0.5880 ) plus 2 stars at 12,000 K (0.6037 ) plus 3 stars at 11,000 K (0.6186 ) plus 6 stars at 10,000 K (0.6334 ). The total number of average HB stars required to reproduce the HUT spectrum now decreases to 18. The resulting synthetic spectrum is presented in Fig. 7. Again, it does not affect the wings of Ly , for which there already was good agreement. These twelve extra ’cool’ HB stars imply a substantial change in the HB mass distribution within the core of M79. Nevertheless, such a large population of cooler HB stars within the core of M79 may be the most likely explanation of the HUT far-UV spectrum.

4.2.3 Effect of Enhanced Metallicity
We also consider the effects of an enhanced metallicity at the surface of the hot HB stars in M79. Recent abundance analyses of HB stars have found evidence for enhanced metals suggestive of radiative diffusion (Glaspey et al. 1989). Since there are many more metal lines between 900 Å and 1200 Å than between 1300 and 1700 Å, a higher metallicity would depress the short-wavelength flux more than the long-wavelength flux – in effect, changing the spectrum slope. To investigate this possibility, we calculated a composite of 6 equally weighted spectra in the range 15,000 - 20,000 K for a metallicity and compared it to one with . As displayed in Fig. 8, the spectrum for the model with has a flux level lower than the one with the original metallicity, ). There is indeed a differential metallicity effect, but the effect is small enough that it cannot be the sole explanation for the discrepancy between the long-wavelength flux of the synthetic and observed spectra of M79. A much larger metallicity would be required to resolve this discrepancy. We note in this regard that Glaspey et al. (1989) found Fe to be overabundant by a factor of at least 50 in a hot HB star in NGC6752.

To summarize, we can conclude that there are two possibilities to resolve the discrepancy from 1280 Å to 1700 Å in the synthetic spectrum. The option of extra ‘cool’ HB stars is certainly possible, but it would imply that the mass distribution of HB stars in the center of M79 is quite different from that further out. On the other hand, an additional UV-bright star (= 9,500 K) provides a simple solution to resolve the discrepancy but such a star may not exist. A combination of these two options is, of course, a possibility. In this case, the required luminosity of the UV-bright star would be decreased with =450 then being an upper limit. Finally, we mention that effects of radiative diffusion may change the photosheric abundance pattern, and may help to obtain a closer agreement with observations in either of the above suggested options.
5 Discussion
The procedures described previously improve notably the agreement at short and long wavelengths with the HUT spectrum. A similar study was undertaken by DDDF. We stress that our synthesis achieves a good fit to Ly contrary to the DDDF results. DDDF found that model stellar spectra fit directly to the HUT data would indicate that the surface gravities of the HB stars in M79 were much lower than predicted by canonical HB evolutionary theory. They also referred to the work of Moehler et al. (1995) who found that individual HB stars in M15 with values of lower than 20,000 K have values of slightly lower (0.2 – 0.4 dex) than predicted by canonical HB evolutionary theory. We point out that the resolution of our synthetic spectra in is 0.5. Consequently, our synthetic spectra are not sensitive to the shift towards lower gravities observed among the BHB stars in a number of globular clusters and therefore do not conflict with these observations. What is then the reason DDDF predict a Ly profile significantly broader than observed by HUT?
We suggest that the reason for this mismatch lies in their synthesis method rather than in the HB evolutionary theory. Let us consider their Fig. 7, where open circles are stars from the Gaussian model that best reproduce the HUT spectrum, albeit a too broad Ly profile. We notice that there are no models present in the range between 16,000 and 28,000 K in this figure. However, the Gaussian mass distribution that reproduces the observed optical CMD does show masses distributed over the range corresponding to stars with ZAHB between 16,000 and 28,000 K! This means that there is an inconsistency between the Gaussian distribution that reproduces the CMD and the distribution in ZAHB that is actually used in calculating the best-fitting Gaussian far-UV synthetic spectrum. As mentioned in Sect. 3.2, about 60% of the contribution to the total integrated flux in our calculations is emitted by models between about 16,000 and about 25,000 K. A synthesis in which models from this essential range are not included will provide a broader Ly profile by overestimating the number of required cooler HB stars.
We conclude that the Gaussian model that reproduces the optical CMD is consistent with the far-UV spectrum, if there is a UV bright star or extra ‘cool’ HB stars in the central region of the cluster. Extremely low gravities or unreasonable metallicities are not required to reproduce the far-UV spectrum, but a smaller amount of -element enhancement than is usually assumed seems necessary to reproduce the observed far-UV Si lines. There is also an indication for the presence of extreme BHB stars in the center of M79, which agrees with the presence of some extreme BHB stars that DDDF required to reproduce the wavelength region shortward of Ly .
Matching the far-UV spectrum of the globular cluster M79 with a model that is consistent with the observed optical CMD increases our confidence in our current understanding of the late stages of low-mass star evolution, as well as in our future ability to understand the integrated spectra of distant stellar systems.
Acknowledgements.
We would like to thank Van Dixon for kindly providing the HUT observations; Alex de Koter, Wayne Landsman, Ben Dorman, and Marcio Catelan for helpful discussions and constructive comments; and Robert Kurucz for providing a computer-readable tape of his stellar atmospheres. This work was carried out by one of us (JV) in partial fulfillment of a Masters degree at the University of Utrecht, under the supervision of Henny Lamers. The work was supported by student traineeship made possible by the STIS science team.References
- (1) Altner B., Matilsky T.A., 1993, ApJ 410, 116
- (2) Battistini P., Bregoli G., Fusi Pecci F., Lolli M., 1985, A&AS 61, 487
- (3) Borissova J., Catelan M., Spassova N., Sweigart A.V., 1997, AJ 113, 692
- (4) Buonanno R., Corsi C.E., Fusi Pecci F., 1985, A&A 145, 97
- (5) Buonanno R., Caloi V., Castellani V., et al., 1986, A&A 66, 79
- (6) Cordoni J.-P., Auriere M., 1984, A&AS 58, 559
- (7) Davidsen A.F., Long K.S., Durrance S.T., et al., 1992, ApJ 392, 264
- (8) Dixon W.V., Davidsen A.F., Dorman B., Ferguson H.C., 1996, AJ 111, 1936
- (9) Dorman B., O’Connell R.W., Rood R.T., 1995, ApJ 442, 105
- (10) Ferraro F.R., Clementini G., Fusi Pecci F., Sortino, R., Buonanno, R., 1992, MNRAS 256, 391
- (11) Glaspey J.W., Michaud G., Moffat A.F.J., Demers S., 1989, ApJ 339, 926
- (12) Greggio L., Renzini A., 1990, ApJ 364, 35
- (13) Hill R.S., Cheng K.P., Smith E.P., et al., 1996, AJ 112, 601
- (14) Hubeny I., 1981, A&A 98, 96
- (15) Hubeny I., Lanz T., Jeffery C.S., 1994, in Newsletter on Analysis of Astronomical Spectra No .20; ed. C.S. Jeffery (St. Andrews University), 30
- (16) Kraft R.P., 1994, PASP 106, 553
- (17) Kurucz R.L., 1993, “ATLAS9 Stellar Atmosphere Programs and 2 km/s grid”, Kurucz CD-ROM No.13, Smithsonian Astrophysical Observatory
- (18) Kurucz R.L., 1994, CD-ROM No. 22, Smithsonian Astrophysical Observatory
- (19) Lanz T., Hubeny I., 1995, ApJ 439, 905
- (20) Moehler S., Heber U., de Boer K.S., 1995, A&A 294, 65
- (21) Rose J.A., Stetson P.B., Tripicco M.J., 1987, AJ 94, 1202
- (22) Savage B.D., Matthis J.S., 1979, ARA&A 17, 73
- (23) Stetson P.B., 1991, Precision Photometry: Astrophysics of the Galaxy, ed. A.G. Davis Philip, A.R. Upgren, & K.A. Janes (Schenectady: L. Davis Press), 69
- (24) Sweigart A.V. 1997, ApJ 474, L23
- (25) van Albeda T.S., de Boer K.S., Dickers R.J. 1981, MNRAS 195, 591
- (26) Yi S., Afshari E., Demarque P., Oemler A.Jr., 1995, ApJ 453, L69