MAXIMA: an experiment to measure temperature
anisotropy
in the cosmic microwave background
Abstract
We describe the MAXIMA experiment, a balloon-borne measurement designed to map temperature anisotropy in the Cosmic Microwave Background (CMB) from to . The experiment consists of a 1.3 m diameter off-axis Gregorian telescope and a receiver with a 16 element array of bolometers cooled to 100 mK. The frequency bands are centered at 150, 240, and 410 GHz. The 10′ FWHM beam sizes are well matched to the scale of acoustic peaks expected in the angular power spectrum of the CMB. The first flight of the experiment in its full configuration was launched in August 1998. A 122 deg2 map of the sky was made near the Draco constellation during the 7 hour flight in a region of extremely low galactic dust contamination. This map covers 0.3% of the sky and has 3200 independent beamsize pixels. We describe the MAXIMA instrument and its performance during the recent flight.
Introduction
Observations of the cosmic microwave background (CMB) temperature anisotropy are providing strong constraints on theories of cosmological structure formation. These measurements discriminate between competing cosmological models and, if the standard inflationary model is correct, will determine each many of the fundamental cosmological parameters to high precision.
In this paper we describe the MAXIMA experiment, a balloon-borne telescope designed to measure the angular power spectrum of CMB anisotropy over a wide range of angular scales. The experiment consists of a 1.3 m diameter off-axis Gregorian telescope and a receiver with a 16 element array of bolometers cooled to 100 mK. The high sensitivity of this receiver allows accurate measurements of the CMB power spectrum in a single overnight balloon flight. Each of the pixels in the array are sensitive to a single frequency band centered at 150, 240, or 410 GHz. The 150 GHz band is the most sensitive to the CMB and is close in frequency to the predicted minimum in galactic foregrounds. The higher frequency channels monitor emission from the atmosphere and galactic foregrounds such as dust. The combination of a small beam size (10′ FWHM) and long scans (4∘ p-p) result in sensitivity from angular scales of 4∘ to 10′ (, where is the spherical harmonic multipole number.) This range is well matched to the expected acoustic peaks in the CMB angular power spectrum.
The scan strategy for MAXIMA has been carefully designed to be efficient and to minimize and measure systematic effects. The observation is done in a total power rather than chopped mode. The sky is scanned with three modulations: a primary mirror scan, a gondola scan, and the same patch of sky is scanned twice during the flight. These modulations allow interference on any one time scale to be isolated. The two scans of the sky are performed at different angles due to sky rotation to “cross link” the scans and reduce striping due to 1/f noise in the detector. This cross-linking results in a more sensitive measurement of the angular power spectrum.
The first science flight MAXIMA-1 was launched in August 1998. All systems worked well and bolometer loading and sensitivity were consistent with those estimated with ground-based measurements. A 122 deg2 map of the sky was made near the Draco constellation during the 7 hour flight in a region of extremely low galactic dust contamination. This map covers 0.3% of the sky and has 3200 independent beamsize pixels.
MAXIMA is part of the MAXIMA/BOOMERanG collaboration (see papers by P. De Bernardis and S. Masi in these proceedings). MAXIMA and BOOMERanG share a common base of technologies, including bolometric detectors, optical filters, and attitude control systems. MAXIMA is optimized for multiple single-day flights whereas BOOMERanG is designed for a long duration flight around the antarctic continent.
MAXIMA is a valuable testbed for the technologies planned for the High-Frequency Instrument (HFI) of the Planck Explorer. The 100 mK “spiderweb” bolometers built at JPL are similar to those planned for the HFI.bock98 MAXIMA has a similar beamsize to the HFI at 150 GHz and also uses single-color feedhorns in the focal plane.
In the following sections, we will describe the optical system, receiver design, detector system, gondola, attitude control system, scan strategy, calibration strategy, and performance during the recent flight.
I Optical system
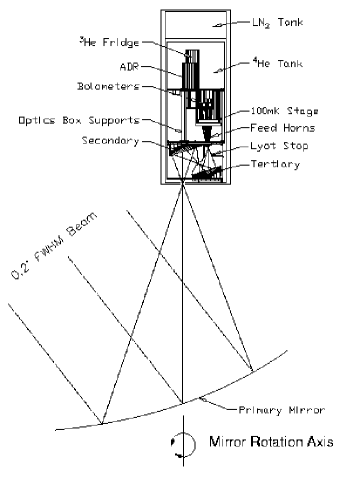
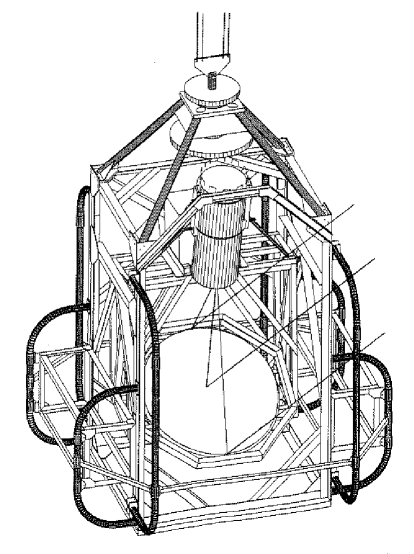
The MAXIMA telescope is an underfilled f/1 off-axis Gregorian design with two cold reimaging mirrors as shown in Fig. 1. The primary mirror is a 1.3 m diameter off-axis section of a paraboloid. The secondary and tertiary mirrors (21 cm and 18 cm in diameter respectively) are off-axis ellipsoids with aspheric components which compensate the part of the aberrations introduced by the primary mirror. This optical system provides a 1∘ x 1∘ diffraction-limited field-of-view at 150 GHz. A baffle between the two reimaging mirrors and a Lyot stop provide excellent telescope sidelobe performance. The overall design has many elements in common with the DIRBE telescope for the same reasons. The reimaging optics and all baffles are maintained at LHe temperature to reduce the optical power loading on the bolometers, thereby improving sensitivity. The non-optical interior surfaces of the box are covered with a mm-wave absorbing material bock97 . A 1% neutral-density filter can be inserted in the optical path at the intermediate focus for tests using 300K loads. The neutral-density filter is inserted and removed using a bellows-sealed screw on the outside of the cryostat.
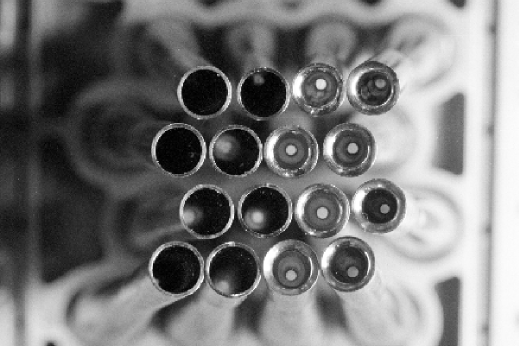
The focal plane contains 16 single-color feedhorns designed for 10′ FWHM beamsize as shown in Figs. 2-4. The focal plane is organized into four equal elevation rows each containing two 150 GHz feeds, a 240 GHz feed, and a 410 GHz feed. Two types of feedhorn are used in the focal plane. For the 150 GHz channels conical horns are used, since these channels are at the diffraction limit. The conical horns are smooth walled for ease of fabrication. The sidelobe performance of the horn is not critical given the use of a Lyot stop. For the 240 and 410 GHz channels, Winston horns are used since these channels detect multiple optical modes.
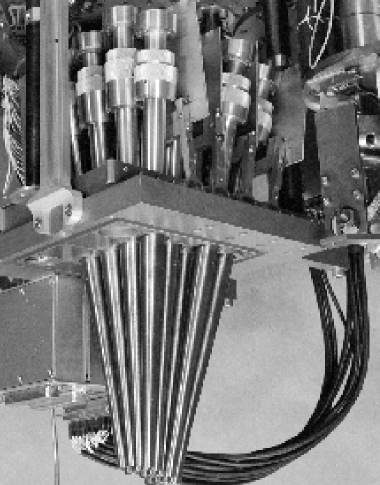
The frequency bands are defined by metal-mesh filters built by the QMWC group. These are positioned inside light pipes between the feedhorns and the bolometers as shown in Fig. 4. For the 150 GHz channels a high-pass filter is formed by a small circular waveguide at the back of the feedhorn. Spectra measured before the flight are shown in Fig. 5. High-frequency out-of-band leaks are dangerous due to the rapidly rising spectrum of the atmosphere. Three low-pass filters (two metal mesh and one made from alkali-halide powder in polyethylene) are used to block resonant leaks in the band-defining filters and to reduce optical loading on the cryogens. We tested for leaks above the passband for each channel by comparing bolometer response with and without a thick-grill high-pass filter blocking a chopped source. The cutoff frequency of the thick-grill filter was chosen to be just above the upper edge of the passband. Leak performance was found to be greatly improved in channels with two metal mesh filters (see Fig. 4) by introducing an absorbing section of lightpipe made from G-10 in between the two filters. The inner diameter of this lightpipe was chosen to be the same as that of the adjacent lightpipe. This technique, which may suppress multiple reflections between the filters, did not adversely affect in-band efficiency.
The feedhorns are supported by an aluminum plate at LHe temperature. Another plate, at 100 mK, supports the filter and bolometer assemblies. The two plates are separated by a 0.5 mm gap. The 100 mK side of the gap is covered with absorber to prevent stray light from entering bock97 .
The bolometers are housed in integrating cavities fed by conical horns. Several different backshort geometries were evaluated including a flat plate from the bolometer, a spherical cavity, and a sloping flat backshort. System optical efficiencies of most channels were 25-35%, with no significant differences between the different backshort geometries.


The beams are scanned on the sky by rotating the primary mirror about an axis defined by the center of the primary mirror and the prime focus. We use a lightweight (11 kg) mirror constructed with an aluminum honeycomb core, graphite facesheets, and a sputtered aluminum optical surface. The mirror is rotated by a large dc servo motor. The position is sensed by a Linear-variable-differential transformer (LVDT), and the position is controlled by an analog proportional-differential feedback system. The reference scan is a 0.45 Hz 4∘ p-p sawtooth with smoothed transitions. Data from the flight is shown in Fig. 6.

Beam patterns were measured using Jupiter as a source during the MAXIMA-1 flight. Single azimuthal scans are shown in Fig. 7. for four channels. The beam sizes are consistent with the design goal of 10′ FWHM. Scans were performed at multiple elevations to measure the beam patterns in two dimensions.

The sidelobe performance was measured on the ground for the 150 GHz band as shown in Fig. 8. A 50 mW 150 GHz Gunn oscillator source was placed on the roof of the NSBF highbay (height m) with the gondola in the parking lot in flight configuration. One telescope beam was pointed at the source and then the telescope was rotated first in elevation and then in azimuth to measure the sidelobe response. A variable attenuator was used on the source to keep the signal in the linear regime of the bolometers. In addition to the scans in elevation and azimuth the source was directed at all parts of the gondola from ground level.

II Receiver Design
The MAXIMA cryostat houses the secondary optics, the bolometers, and the sub-Kelvin coolers.irlabs These are all mounted to a “cold plate” which forms one side of the LHe tank, and are surrounded by radiation shields at LHe and LN temperatures. The liquid nitrogen (liquid helium) tanks have a 13 (21) liter capacity, and the unpumped hold times are hours for both cryogens.
The bolometers are cooled to 100 mK by an Adiabatic Demagnetization Refrigerator. A detailed description of this device can be found in Hagmann et al.hagmann The salt pill is made from Ferric Ammonium Alum (FAA). The superconducting magnet uses a NbTi coil and generates 2.5 T for a peak current of 6.2 A. The magnet current is carried from the LN temperature stage to the LHe temperature stage by commercial leads made from High- superconductor, which give a heat leak of only mW.hightc The use of these leads gives a 15% decrease in total heat leak to the LHe compared to using normal metal leads. The cycle time of the ADR is 2 hours, and the hold time at 100 mK is hours. The heat of magnetization is absorbed by a 300 mK closed-cycle single-shot charcoal-pumped refrigerator, which also provides a heat intercept to the 100 mK stage. The refrigerator contains 40 STP liters of and uses an external tank to reduce the internal pressure when the system is at room temperature. The refrigerator takes 4 hours to cycle and has a hold time of 40 hours.
The heat leak to the 100 mK stage has been minimized through the choice of materials and geometry of the supports and wires. The bolometer platform is mounted to the liquid helium cold plate with three tubes (0.84 cm diameter, 17.8 cm long, and 0.5 mm wall thickness) made from Vespel SP-22 plastic which is strong but gives low heat leak at sub-Kelvin temperatures. The tubes are heat sunk to 300 mK at 1/3 of their length from the LHe temperature end. The 120 Pt-W bolometer wires are 5 cm long and have a 51 micron diameter. The signal wires are twisted with a ground wire and are attached to G-10 tubes (wrapped and varnished) to reduce microphonic response. The G-10 tubes are 10.2 cm long, 0.5 cm in diameter, have 130 micron wall thickness, and the heat flow is intercepted in a similar manner to the Vespel support legs.
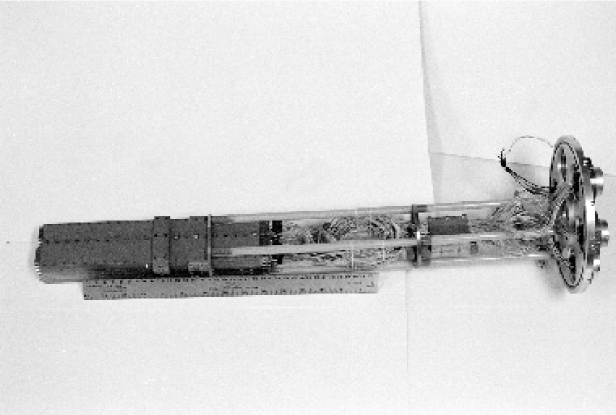
We use a modular “wire insert” to carry all wires from the top of the cryostat at 300 K to the cold plate at LHe temperature. This insert, shown in Fig. 9, provides easy access to the wires. It is inserted through holes in the cryostat shell and the LN and the LHe tanks and is then mechanically attached at each temperature stage. It contains the 300 K connectors and essentially all of the cryostat wiring. It also includes cold RF filter modules made from striplines encased in lossy Eccosorb CR-124.
III Detector System
We use spiderweb-absorber bolometers fabricated at JPL with Neutron-Transmutation Doped (NTD) Ge thermistors, which give high sensitivity with a fast response time, low cosmic-ray cross section, and low microphonic response.bock98 The NTD Germanium material is produced at LBNL. Time constants of ms have been measured which are essential for our rapid primary mirror modulation. For our total power mode scan, the speed at which the beam can be modulated on the sky is limited to , where FWHM refers to the full-width half-maximum beamsize.hanany98
The bolometer signals are buffered using differential JFET amplifiers. We use commercial devices from Infrared Laboratories that are internally thermally isolated with polyamide legs.irlabs These devices dissipate mW and have a white noise level of .
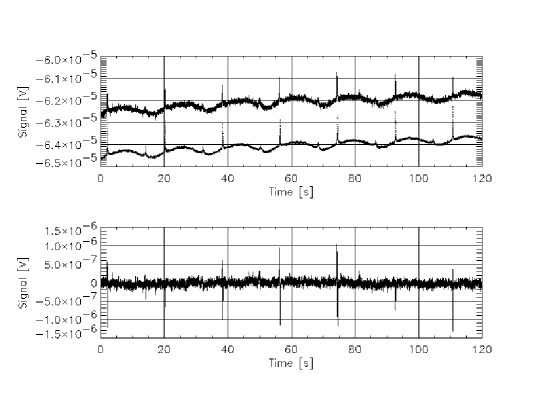
The bolometers are ac-biased at 220 Hz using a sinusoidal bias and the signals are band-pass filtered and then lock-in detected. This ac-bias scheme circumvents 1/f noise in the front-end amplification and results in excellent low-frequency stability.wilbanks90 ; devlin93 A noise spectral density from the flight is shown in Fig. 10. The noise below 0.1 Hz is largely attributable to temperature fluctuations in the unregulated 100 mK stage.
A 4.2K temperature optical load was used in ground tests to check the optical loading without the neutral-density filter. The optical loading on the bolometers in flight was consistent with that predicted from these measurements. During the MAXIMA-1 flight four of the eight 150 GHz channels had a Noise Equivalent Temperature (NET-CMB) of 90-100 . Two others had NET , and the last two had significantly higher noise. The variability in sensitivity reflects a variation in noise more than in responsivity. Some excess noise came from the ac-bias readout system. The sensitivity of all 150 GHz channels taken together in quadrature, which is the effective receiver sensitivity at 150 GHz, was 41 .
We employ an optical “stimulator” located adjacent to the Lyot stop to provide a periodic calibration reference for the bolometers. This stimulator is similar to a bolometer in construction and uses a resistive heater to heat it to several tens of degrees Kelvin. It is turned on for 10 seconds every 25 minutes. We use three monitor channels in addition to the 16 optical bolometers. These include an optically blanked bolometer and a 4 MOhm resistor, which are used to monitor electro-magnetic interference. We also use a well heat sunk NTD thermistor to monitor temperature fluctuations of the 100 mK stage.

IV Gondola and attitude control system
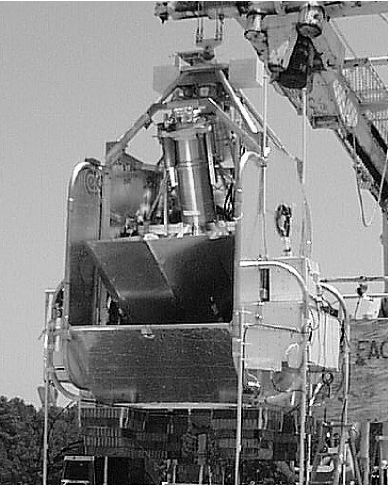
The gondola, shown in Fig. 11, is designed to be strong enough for multiple flights. It incurred little damage in the MAXIMA-0 test flight in 1995 or in MAXIMA-1. The design is based on the ACME gondola used with the MAX experiment and is largely constructed with bolted aluminum. The gondola has a sturdy outer frame made from members with an “L” shaped cross-section, with tubular roll bars mounted at the corners. The receiver and primary mirror are mounted on an inner frame supported on trunion bearings to change the beam elevation. The elevation range is to . The attitude control electronics, data acquisition, and command electronics are housed in boxes with aluminum honeycomb sides on the either side of the gondola. The bottom of the gondola is covered in aluminum honeycomb. The flight ready gondola weights 3600 lbs without ballast.
The attitude control system (ACS) controls the position of the telescope beams on the sky. The ACS consists of attitude sensors, a central feedback loop computer, and actuator motors. The ACS can be divided into one system that controls the azimuthal angle of the gondola and another that controls the elevation of the inner frame. For both systems, only some attitude sensors are used in the actuator control loop, while all are used for post-flight pointing reconstruction.
The azimuthal control portion of the ACS employs a pivot unit which contains two dc motors. One motor drives a reaction wheel and the other drives directly against the flight line. All scans are done with constant gondola azimuthal velocity. The feedback for the reaction wheel is proportional to azimuthal velocity as measured by an azimuthal rate gyroscope. The feedback for the direct drive motor is proportional to the reaction wheel velocity as measured by a tachometer. This loop prevents the reaction wheel velocity from reaching saturation.
For the CMB anisotropy scan, the velocity is reversed periodically to produce a sawtooth scan. A two-axis magnetometer is used to determine the turnaround locations. During the MAXIMA-1 flight azimuthal velocity error was typically with velocities during the anisotropy scans of . This performance is more than adequate since small errors in gondola velocity only affect the uniformity of sky coverage.
The telescope elevation is changed using a ballscrew and a small dc servo motor. The position is sensed using a 16-bit optical encoder. A digital feedback loop similar to the azimuth loop is used for control. The telescope elevation is not actively controlled during CMB scans. The telescope has a range in elevation of 20∘ to 55∘.
For post-flight pointing reconstruction of the CMB scans, the azimuth and elevation of the beam are detected with two CCD cameras. The boresight camera has a 7∘ field of view in azimuth, and can lock on stars as faint as 6th magnitude. The other camera is attached to the outer frame, has a 14∘ field of view, and is offset in azimuth to lock on Polaris during the CMB scans. The two-axis magnetometer is used for pointing reconstruction during azimuthal rotations which were used to calibrate from the CMB dipole. Roll and pitch rate gyroscopes are also used in the pointing reconstruction.
Gondola pendulations give signals in the bolometers due to the change in optical path length through the atmosphere with beam elevation. The most troublesome mode observed during the 1995 MAXIMA-0 test flight was the one in which the gondola rotates about its center of mass.msam For our gondola, the frequency of this mode is 0.6 Hz, which is in our signal bandwidth. The lower frequency modes are not important during the CMB scans, since they occur at frequencies much lower than our 0.45 Hz mirror scan. Four approaches were used to reduce the 0.6 Hz pendulation. First, the reaction wheel was made as symmetric as possible by using well measured weights at the end of lightweight spokes. Second, the axis of the reaction wheel was aligned to the gravity vector to an accuracy of before flight. Third, the azimuth feedback loop uses a sensor (gyroscope) that has no sensitivity to pitch or roll. Finally, we use a passive pendulation damper built by Geneva Observatory, which consists of a damped harmonic oscillator whose resonance frequency is set to the 0.6 Hz pendulation frequency.genevaobs This device is constructed from a spherical weight rolling on a spherical cup in an oil filled vessel. We calculate that this damper should reduce pendulation amplitude by a factor of . During the MAXIMA-1 flight the amplitude of the 0.6 Hz pendulation mode was an acceptable rms.
V flight
The MAXIMA-1 science flight was launched on August 2, 1998 at 00:58 UT (7:58 PM local) from the NSBF facility at Palestine Texas (see Fig. 12.). We reached a float altitude of 37.5 km at 4:35 UT and remained above 36.6 km for 3 hours and 47 minutes until the flight was terminated. The time at float was somewhat short due to the fast high-altitude winds during mid-summer. At 32 km we started rotating the gondola with a period of 18 s to measure the CMB dipole. Data from this calibration are shown in Fig 13. The dipole measurement lasted 30 minutes which included rotations. The data are well fit by a model that includes the CMB dipole, thermal emission from galactic dust, and a fraction of the signal from the 410 GHz channel in the same row of the array. This component of the signal is attributed to emission from the atmosphere. This component decreased with time during the dipole measurement as the gondola rose from 32 to 36 km in altitude. It only makes a significant contribution to the first quarter of the data.
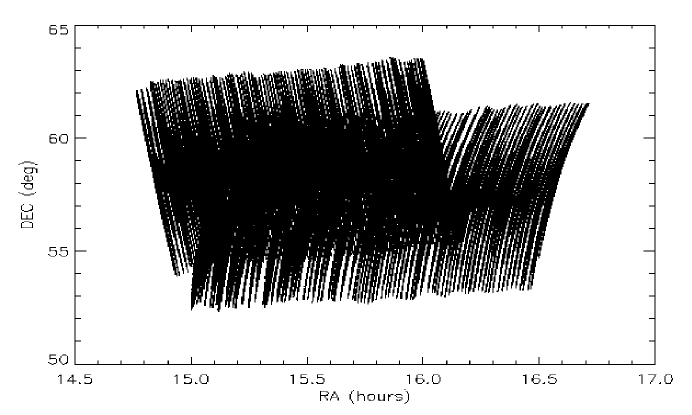
After the CMB dipole measurement, we carried out two CMB anisotropy scans which lasted a total of 3 hours. The position of one beam during this period is shown in Fig. 14. We perform three temporal modulations. First, the mirror scans p-p at 0.45 Hz. Second, the gondola is scanned slowly in azimuth with a period of minute with the elevation of the telescope held constant. During the first and second segments the azimuth angle of the gondola scanned and p-p respectively. Finally, the telescope azimuth and elevation are changed roughly at the midpoint of the observation to rescan the same region. This second scan on the sky occurs at an angle to the first due to sky rotation producing a cross-linked pattern as shown in Fig. 14. This cross-linking of pixels allows a two dimensional map of the sky to be reconstructed from one dimensional scans in the presence of inevitable low-frequency noise in the detectors. The two-dimensional information that can be obtained from such a map gives a more sensitive measurement of the power spectrum than can be obtained from one-dimensional information.theory The total area covered by the observation is 122 deg2 (0.3% of the sky). This region is one of the lowest dust contrast regions of the sky based on calculations using the IRAS/DIRBE map of Schlegel et al.schlegel98 .
During the last part of the flight we observed Jupiter to measure our beam patterns and obtain an independent calibration. We held the elevation of the telescope constant while Jupiter slowly moved through the elevation of the beams due to sky rotation. The mirror modulation provided azimuthal scans of Jupiter at many elevations. One such scan is shown in Fig. 7. We made several hundred such scans for each channel. It should be possible to form a two-dimensional map of the beam from these scans to accurately characterize the beam shapes.
The experiment was recovered after flight with little damage and is being prepared for up to two flights from Palestine during the summer of 1999. Data analysis from MAXIMA-1 is in progress and results will be presented in future publications.
acknowledgements
We are grateful to R. Plambeck, R.F. Silverberg, and P. Timbie for supplying the RF sources used for the sidelobe measurements. We thank S. Church, D. Finkbeiner, E. Hivon, D. Huguenin, and S. Meyer for useful discussions. D. Horsley and J. Wu made important contributions to the attitude control system. We are very grateful to the National Scientific Balloon Facility in Palestine, Texas for their support during the MAXIMA-0 and MAXIMA-1 campaigns. This work was funded in part by NSF cooperative agreement AST-9120005 and NASA grant NAG5-4454.
References
- (1) J. Bock, Ph.D. Thesis, University of California, (1997).
- (2) Infrared Laboratories, inc., Tucson, AZ, USA.
- (3) C. Hagmann and P.L. Richards, “Adiabatic Demagnetization Refrigerators for Small Laboratory Experiments and Space Astronomy,” Cryogenics, Vol. 35, No. 5, pgs 303-309 (1995).
- (4) Eurus Monoco, inc., Minneapolis, MN, USA.
- (5) J.J. Bock, D. Chen, P.D. Mauskopf, and A.E. Lange, ”A Novel Bolometer for Infrared and Millimeter-Wave Astrophysics,” Space Science Reviews, 74, Kluwer Academic Publishers, 229 (1995)
- (6) S. Hanany, A.H. Jaffe, E. Scannapieco, “The Effect of the Detector Response Time on Bolometric Cosmic Microwave Background Anisotropy Experiments,” Mon. Not. R. Astron. Soc. 299, pgs. 653-660 (1998).
- (7) T. Wilbanks, M. Devlin, A.E. Lange, S. Sato, J. W. Beeman, and E.E. Haller, ”Improved Low Frequency Stability of Bolometric Detectors,” IEEE Trans. Nuclear Science, vol. 37, pp. 566 (1990).
- (8) M. Devlin, A.E. Lange, T. Wilbanks, and S. Sato, ”A DC-Coupled, High Sensitivity Bolometric Detector System for the Infrared Telescope in Space,” IEEE Trans. Nuclear Science, vol. 40, pp. 162 (1993).
- (9) D. J. Fixsen, E. S. Cheng, D. A. Cottingham, W. C. Folz, C. A. Inman, M. S. Kowitt, S. S. Meyer, L. A. Page, J. L. Puchalla, J. E. Ruhl, and R. F. Silverberg, “A Balloon-Borne Millimeter-Wave Telescope for Cosmic Microwave Background Anisotropy Measurements,” Ap.J. 470 63 (1996).
- (10) Geneva Observatory, University of Geneva, Sauverny, Versoix, CH-1290.
- (11) D. J. Schlegel, D. P. Finkbeiner, and Marc Davis, “Maps of Dust IR Emission for Use in Estimation of Reddening and CMBR Foregrounds,” Astrophysical Journal 500, 525 (1998) (Also astro-ph/9710327)
- (12) M. Tegmark, “CMB mapping experiments: a designer’s guide,” Phys. Rev. D, 56, pgs. 4514-4529 (1997)