HST Observations of the Host Galaxy of GRB970508
Abstract
We report on observations of the field of GRB 970508 made in early August 1998, 454 days after outburst, with the STIS CCD camera onboard the Hubble Space Telescope. The images, taken in open filter (50CCD) mode, clearly reveal the presence of a galaxy which was obscured in earlier (June 1997) HST images by emission from the optical transient (OT). The galaxy is regular in shape: after correcting for the HST/STIS PSF, it is well-fitted by an exponential disk with a scale length of and an ellipticity of . All observations are marginally consistent with a continuous decline in OT emission as beginning two days after outburst; however, we find no direct evidence in the HST image for emission from the OT, and the surface brightness profile of the galaxy is most regular if we assume that the OT emission is negligible, suggesting that the OT may have faded more rapidly at late times than is predicted by the power-law decay. Due to the wide bandwidth of the STIS clear mode, the estimated magnitude of the galaxy is dependent on the galaxy spectrum that is assumed. Using colors obtained from late-time ground-based observations to constrain the spectrum, we find , a few tenths of a magnitude brighter than earlier ground-based estimates that were obtained by observing the total light of the galaxy and the OT and then subtracting the estimated OT brightness assuming it fades as a single power-law. This again suggests that the OT may have faded faster at late time than the power-law predicts. The position of the OT agrees with that of the isophotal center of the galaxy to which, at the galaxy redshift , corresponds to an offset from the center of the host of pc. This remarkable agreement raises the possibility that the GRB may have been associated with either an active galactic nucleus or a nuclear starburst.
Introduction
The detection and rapid localization of GRB 970508 by the Gamma-Ray Burst Monitor and the X-ray Wide Field Camera on BeppoSAX (Piro et al. (1998)) led to the identification of an optical counterpart within four hours (Bond (1997)) and, subsequently, to Keck spectroscopy of the counterpart that revealed a system of absorption lines at (Metzger et al. (1997)). This lower limit on the GRB redshift was the first direct constraint on the distance and energy scale of a classical gamma-ray burst. Because of its early discovery, as well as the great interest attracted by the redshift measurement, the fading counterpart of GRB 970508 has been more thoroughly studied than any other GRB counterpart. The optical light curve, for example, has been intensively observed from a few hours to over a year after the GRB. The optical flux reached a peak at R two days after the GRB, then began a power law decay, , with , that continued for over one hundred days (Pian et al. 1998b ; Galama et al. 1998b ). At that point, the decay curve began to flatten (Pian et al. 1998a ; Pedersen et al. (1998); Bloom et al. 1998a ; Zharikov, Sokolov, and Baryshev (1998); Sokolov et al. (1999)), as expected if the measured flux were becoming dominated by light from a host galaxy. GRB 970508 was also the first burst for which a radio counterpart was detected (Frail et al. (1997); Galama et al. 1998a ). The broadband (radio to X-ray) spectrum of the afterglow (Galama et al. (98)) provided strong support for the synchrotron emitting shock model for afterglows (see, e.g., Sari, Piran and Narayan 1998).
Despite the wealth of data on the GRB counterpart itself, the host galaxy has proven a more difficult observational target. Spectroscopy has revealed [O II] and [Ne III] emission features, and these, together with colors of the galaxy obtained by fitting observations of the combined light from the OT and the galaxy, have led to the suggestion that the host is an actively star-forming dwarf galaxy (Bloom et al. 1998a ; Sokolov et al. (1999)). However, attempts to resolve the host galaxy from the ground have proven fruitless. Even early HST observations, less than a month after outburst, found no evidence for an extended source at the position of the optical transient, down to faint levels, (Pian et al. 1998b ). In this Letter, we describe HST observations taken more than a year after outburst, which have finally allowed us to resolve the host galaxy of GRB 970508. These show that GRB 970508 occurred remarkably close—within about 70 pc—of the host galaxy center, and suggest that the brightness of the OT may have fallen faster at late times than would be predicted by a simple power-law fit. Finally, we discuss the implications of these observations for understanding the progenitor objects and energetics of GRBs.
Observations, Image Analysis, and Results
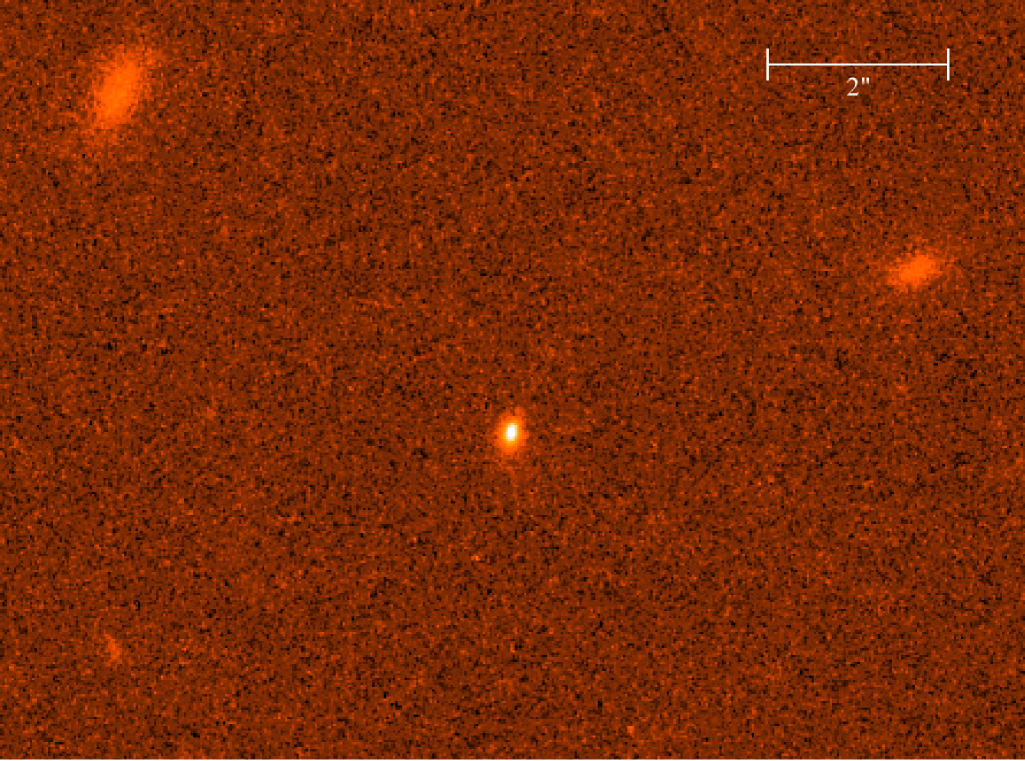
The field of GRB 970508 was imaged during four HST orbits in 1998 August 5.78–6.03 UT, using the STIS CCD in Clear Aperture (50CCD) mode. Two exposures of 1446 s each were taken at each of four dither positions for a total exposure time of 11,568 s. The images were bias and dark subtracted, and flat-fielded using the STIS pipeline. The final image was created and cleaned of cosmic rays and hot pixels using the variable pixel linear reconstruction algorithm (a.k.a. Drizzle) developed for the Hubble Deep Field (Williams et al. (1996); Fruchter and Hook (1997)). An output pixel size of across (one-half the size of the detector pixels on the sky) and a “pixfrac” of 0.6 were used. The (small) geometric distortion of the STIS CCD (Malamuth and Bowers (1997)) was removed during the drizzling process. A section of the final image is shown in Fig. 1.
The total emission from the OT and galaxy were measured by summing the counts in a box on a side and subtracting the local sky. We find counts per second in the aperture. The photometric calibration of the images was performed using the synthetic photometry package SYNPHOT in IRAF/STSDAS; however, a 12% aperture correction has been applied Landsman (1997) to account for light lost to large-angle scattering. The STIS CCD in clear aperture mode has a broad bandpass, with a significant response from 200 to 900 nm that peaks near 600 nm. As a result, STIS instrumental magnitudes are best translated into the standard filter set by quoting the result as a V magnitude; however, knowledge of an object’s intrinsic spectrum is required for an accurate conversion to the standard filter system. Using a spectral energy distribution (SED) flat in one finds . But, as mentioned in the introduction, ground-based observers have fitted for the host galaxy magnitude under the assumption that the power-law index of decay of the OT has been constant with time. We can therefore estimate the V magnitude using the color information from these observations. Although the estimated galactic magnitudes have changed with time (a point we will return to later), all observers have found a blue host, and Sokolov et al. suggest that the galaxy colors are best fit by an object intermediate between an Scd and an irregular (Im) redshifted to . Using either the measured galaxy colors, obtained by a rough averaging of the values obtained by previous observers (Bloom et al. 1998a ; Zharikov, Sokolov, and Baryshev (1998); Sokolov et al. (1999)), or an SED created by interpolating between Coleman, Weedman and Wu (1980) Scd and Im SEDs and redshifting to , we estimate , where the error is dominated by our uncertainty over the SED. This, however, represents the sum of the emission from the host galaxy and any remnant of the OT. We next place a limit on the magnitude of the OT.
In order to register the position of the OT on the late-time image, the positions of nine compact sources were found on both the June 1997 (Pian et al. 1998b ) and July 1998 drizzled images. A shift (in and ) and rotation were then fit between the two images using the IRAF task geomap. The accuracy of this transformation was checked by comparing the observed and predicted positions of four bright, point-like sources. An r.m.s. scatter of drizzled pixels () was found in each coordinate, for a position uncertainty . When the position of the OT on the June 1997 image was transformed to that of the July 1998 image using the shift and rotation measured, we found it to be exactly at the center of the host. To verify this observation, we fitted the host galaxy with elliptical isophotes using the IRAF task ellipse. We find that the isophotal center of the galaxy is stable as a function of radius and agrees with the predicted position of the OT to better than our astrometric error of .
In Fig. 2 we show a plot of the measured surface brightness profile of the galaxy compared with an model and an exponential disk model. In both cases, we have convolved the model with the STIS PSF. In addition to the measured surface brightness profile, we show that profile after subtracting an estimated remnant OT. To do this, we went back to the June 1997 observation and scaled and subtracted a STIS PSF until the remaining counts in a circle of radius four drizzled pixels equaled that in the same region of the late-time image. This PSF was then used as the estimate of the OT at 24.7 days after outburst, was then itself scaled using the power-law found in Pian et al. (1998) to the late time, 454 days after outburst. When subtracted from the galaxy, this estimate of the OT produced a clear “hole” in the center of the host. Under the assumption that galaxies (convolved to pc resolution by the PSF) should have surface brightness profiles rising toward the center, we reject this subtraction. The largest subtraction consistent with a roughly continuously rising surface brightness profile is shown in Fig. 2. Therefore we have subtracted a PSF scaled as between the two HST observations. This power-law is below the power-law reported by Pian et al. (1998), but agrees well with that found by Bloom et al. (1998) and is within of that found by Zharikov et al. (1998). (We note the Pian et al. fit was slightly contaminated by the then-unmeasured light from the host galaxy).
As can be seen from Figure 2, the surface brightness profile of the host galaxy is a far better fit to by exponential disk model than by an law. The best fit exponential model shown has a scale length and ellipticity . It has then been convolved with an estimate of the STIS PSF, produced using the HST Tiny Tim software (Krist, Hasan, and Burrows (1992)) (results obtained when the image is convolved using a stellar PSF are quite similar). This convolution produces a model which can be approximated by an exponential disk with scale length and ellipticity . A true exponential disk plotted as magnitude versus radius would, of course, have a surface brightness profile that is a straight line; however, at its core, the surface brightness of the observed galaxy is averaged over the width of the PSF, and at large radii the true light of the galaxy is overwhelmed by light scattered from the center. It is worth noting that given the large eccentricity observed, the poor fit of the law is not unexpected. In spite of their names, ellipticals rarely have ellipticities approaching .
The fit between the galaxy models and the data is substantially better when no OT is subtracted, than when we remove an OT scaled as . Nonetheless, as can be seen in Figure 3, this power-law largely fits the available ground-based R-band photometry. For this figure, a galaxy magnitude of has been removed from previous photometry. This corresponds to a flat (in ), ı.e. very blue, galaxy spectrum between R and V. The colors found by Sokolov et al. are somewhat redder; however, their V galaxy magnitude is somewhat fainter than ours. In July 1998, an OT falling as would have , implying a corrected galactic magnitude of . However, there has been a continuing trend among the ground-based estimates of the host magnitude. The later the data used to fit the host galaxy, the fainter the host was found to be (Bloom et al. 1998a ; Zharikov, Sokolov, and Baryshev (1998); Sokolov et al. (1999)). The differences are visible in all bands (B, V, R and I), and are typically at the level. Furthermore, the preference of our surface brightness fit for no continuing emission from the OT, and the prevalence of upper limits, rather than detections beyond day 150 in Figure 3, all suggest a single conclusion—the OT may have faded much more rapidly than after day .
Discussion
Our imaging has revealed the faint galaxy host of GRB 970508. We find that the OT is located, within astrometric errors of order , at the isophotal center of the host. At the redshift of GRB 970508, , this corresponds to an offset from the nucleus of pc. The surface brightness profile of the host better fits an exponential disk than the profile of an elliptical, and agrees best when no OT is assumed to be adding to the profile; however, we cannot rule out a power-law decay of the OT as , where . Both our data, and the ground-based observations, tend to support a steepening of the early power-law decay curve sometime after day . Such a break is naturally expected when the expanding fireball has swept up the material from the ISM comparable in rest mass to the energy of the initial explosion at:
where is the initial energy of the explosion in units of erg and is the density of the surrounding medium in protons per cm3 (Wijers, Rees, and Mészáros (1997)). Wijers and Galama (1999) have used the multi-wavelength observations of the afterglow emission of GRB 970508 to estimate the physical parameters of the burst and its surrounding interstellar medium, assuming that the afterglow is dominated by synchrotron emission. They find a total burst energy of and . These values would cause us to expect a break somewhat after one year. However, the uncertainties in these estimated parameters are large (perhaps an order of magnitude, Wijers, private communication). Furthermore the above calculation does not take into account the significant time-dilation in the early part of the expansion, thus overestimating the time till the break. Therefore, we believe that all observations are consistent with the possible break in the light curve between 100 and 200 days after outburst.
Although the precise behavior with time of the OT is uncertain, its position on the host is not. The extraordinary coincidence of the OT with the isophotal center of the host galaxy raises the question of whether the GRB is related to the galactic nucleus, either through a nuclear starburst or an AGN. The Keck spectroscopy by Bloom et al. (1998) shows strong [O II] and [Ne III], both of which are present in galaxies with active nuclei. However, in a large spectroscopic sample of galaxies (McQuade, Calzetti, and Kinney (1995); Storchi-Bergmann, Kinney, and Challis (1995)), no ellipticals or spirals without AGN show [Ne III]. About one-third of the starbursts in the sample show this line, and these are by and large the most active starbursts in the group. Furthermore, only the most extreme starbursts, and the Seyferts, have a [Ne III] equivalent width or the large [Ne III] to [O II] ratio (indicative of a temperature in excess of 40,000 K) seen in this galaxy. Thus, the spectroscopic evidence does not allow us to distinguish between a host which possesses an AGN and one which is simply showing signs of vigorous star formation. Nonetheless, we tend to prefer the latter explanation for two reasons. First, if cosmological GRBs are produced by a single mechanism, that mechanism is unrelated to AGN. The OT of GRB 970228 is located at the very edge of a galactic disk (Fruchter et al. 1999a ). Furthermore, HST images of other GRBs (Odewahn et al. (1998); Bloom et al. 1998b ; Fruchter et al. 1999b ), while less conclusive, all tend to discourage an AGN interpretation. Secondly, our recent work has shown that other GRB hosts possess unusually blue optical-to-infrared colors, implying that these galaxies are actively star-forming (Fruchter et al. 1999b). NICMOS imaging should soon allow us to determine whether this is also the case for the host galaxy of GRB 970508. Until then, we note that in many ways this host galaxy has a strong resemblance to the classic nearby starburst dwarf NGC 5253, in its integrated colors, morphology and line-strengths (McQuade, Calzetti, and Kinney (1995); Storchi-Bergmann, Kinney, and Challis (1995)). Furthermore, NGC 5253 has a hot, young star cluster in its nucleus, suggesting that the resemblance may be very good indeed, by providing a natural explanation for the location of the OT.
The hosts of four GRBs (970228, 970508, 971214 and 990123) have now been imaged and clearly resolved by HST (Sahu et al. (1997); Fruchter et al. 1999a ; Odewahn et al. (1998); Fruchter et al. 1999b ; Bloom et al. (1999)). In each case, the OT is superposed on the stellar field. We note that this may be a result of selection effects and not the true distribution of GRBs with respect to host galaxies, since all of these GRBs were localized by detection of an OT, which itself may require the presence of a dense external working surface such as an ISM (Paczyński and Rhoads (1993); Mészáros and Rees (1997)). Furthermore, only of the GRB localizations by the Beppo-Sax satellite have resulted in the discovery of an optical transient. This fraction is consistent with a model of GRB formation from the merger of neutron-star-neutron-star binaries, since a substantial fraction of neutron-star-neutron-star binaries are likely to be ejected from the galaxy by the momentum imparted to the neutron-stars at birth (Bloom, Sigurdsson, and Pols (1998); Livio et al. (1998)). However, it is not immediately clear that star-formation can properly account for the fraction of GRBs detected in the optical. Local estimates of dust obscuration in star-forming galaxies (Calzetti and Heckman (1999)), as well as some estimates of the same effect in high-redshift galaxies (Pettini et al. (1998); Blain et al. (1999)), suggest that about one-third of the light emitted in the UV escapes from starforming galaxies before being absorbed by dust and reprocessed to IR or radio wavelengths. (We typically view the OTs of GRBs in the UV rest wavelength since they have observed redshifts between 0.8 and 3.4, see also Hogg and Fruchter 1999.) A reduction by a factor of three of the light emitted by GRBs would be roughly consistent with what we observe — about one-half of GRBs are missing, and of order one-half of those observed have redder spectra than expected based on the afterglow theory (Bloom et al. 1998b ; Fruchter et al. 1999a ; Halpern et al. (1998)), perhaps suggesting the presence of moderate extinction. However, other authors (Meurer et al. (1997)) have claimed significantly higher absorption by dust at high redshift. And deep sub-millimeter observations of several high Galactic latitude fields (Hughes et al. (1998); Barger et al. (1998)) have suggested that a few obscured objects in each field which are undetectable in the optical could be producing more stars than all of the galaxies visible in the optical. If these more extreme estimates of the importance of dust obscuration are correct, and GRBs are related to star formation, it may be difficult to explain the success optical observers have had in finding OTs—especially ones like 970508, which is quite probably at the nucleus of a highly inclined starburst galaxy, yet whose color in the rest-frame UV (Pian et al. 1998b ) shows no sign of significant extinction.
References
- Barger et al. (1998) Barger, A., Cowie, L., Sanders, D., Fulton, E., Taniguchi, Y., Sato, Y., Kawara, K., and Okuda, H. 1998, Nature, 394, 248–251.
- Blain et al. (1999) Blain, A. W., Smail, I., Ivison, R. J., and Kneib, J. P. 1999, MNRAS, 302, 632–648.
- (3) Bloom, J. S., Djorgovski, S. G., Kulkarni, S. R., and Frail, D. A. 1998a, ApJ, 507, L25–L28.
- Bloom et al. (1999) Bloom, J. S. et al. 1999, ApJ. submitted, astro-ph/9902182.
- Bloom, Sigurdsson, and Pols (1998) Bloom, J. S., Sigurdsson, S., and Pols, O. R. 1998, MNRAS. submitted.
- (6) Bloom, J. S. et al. 1998b, ApJ, 508, L21–L24.
- Bond (1997) Bond, H. E. 1997. IAU circular 6654.
- Calzetti and Heckman (1999) Calzetti, D. and Heckman, T. M. 1999, submitted to Ap. J.; astro-ph/9811099.
- Coleman, Wu, and Weedman (1980) Coleman, G. D., Wu, C. C., and Weedman, D. W. 1980, Astrophys. J. Supp. Series, 43, 393–416.
- Frail et al. (1997) Frail, D. A. et al. 1997, Nature, 389, 261–263.
- Fruchter and Hook (1997) Fruchter, A. S. and Hook, R. N. 1997, in Applications of Digital Image Processing XX, Proc. SPIE, Vol. 3164, ed. A. Tescher, SPIE, 120–125.
- (12) Fruchter, A. S. et al. 1999a, ApJ. in press.
- (13) Fruchter, A. S. et al. 1999b, Submitted to ApJL.
- (14) Galama, T. J. et al. 1998a, ApJ, 500, L101–L104.
- Galama et al. (98) Galama, T. J., Wijers, R. A. M. J., Bremer, M., Groot, P. J., Strom, R. G., Kouvelioutou, C., and van Paradijs, J. 98, ApJ, 500, L97.
- (16) Galama, T. J. et al. 1998b, ApJ, 497, L13–L16.
- Halpern et al. (1998) Halpern, J., Thorstensen, J., Helfand, D., and Costa, E. 1998, Nature, 393, 41–42.
- Hughes et al. (1998) Hughes, D. H. et al. 1998, Nature, 394, 241–247.
- Krist, Hasan, and Burrows (1992) Krist, J. E., Hasan, H., and Burrows, C. J. 1992, in Astronomical Data Analysis Software and Systems, 223, Astronomical Society of the Pacific conf. ser. 25.
- Landsman (1997) Landsman, W. 1997. Internal STIS Calibration Document.
- Livio et al. (1998) Livio, M. et al. 1998, in Gamma Ray Bursts: 4th Huntsville Symposium, ed. C. A. Meegan, R. Preece, and T. Koshut, (Woodbury, New York: AIP).
- Malamuth and Bowers (1997) Malamuth, E. and Bowers, C. W. 1997, in 1997 HST Calibration Workshop, ed. S. Casertano, R. Jedrzejewski, T. Keyes, and M. Stevens, STScI, 144–149.
- McQuade, Calzetti, and Kinney (1995) McQuade, K., Calzetti, D., and Kinney, A. L. 1995, ApJS, 97, 331–346.
- Mészáros and Rees (1997) Mészáros, P. and Rees, M. J. 1997, ApJ, 476, 232–237.
- Metzger et al. (1997) Metzger, M. R., Djorgovski, S. G., Kulkarni, S. R., Steidel, C. C., Adelberger, K. L., Frail, D. A., Costa, E., and Frontera, F. 1997, Nature, 387, 879.
- Meurer et al. (1997) Meurer, G. R., Heckman, T. M., Lehnert, M. D., Leitherer, C., and Lowenthal, J. 1997, AJ, 114, 54–68.
- Odewahn et al. (1998) Odewahn, S. C. et al. 1998, ApJ, 509, L5–L8.
- Paczyński and Rhoads (1993) Paczyński, B. and Rhoads, J. 1993, ApJ, 418, L5.
- Pedersen et al. (1998) Pedersen, H. et al. 1998, ApJ, 496, 311–315.
- Pettini et al. (1998) Pettini, M., Kellogg, M., Steidel, C. C., Dickinson, M., Adelberger, K. L., and Giavalisco, M. 1998, ApJ, 508, 539–550.
- (31) Pian, E. et al. 1998a, in Gamma Ray Bursts: 4th Huntsville Symposium, ed. C. A. Meegan, R. Preece, and T. Koshut, (Woodbury, New York: AIP), 504–508.
- (32) Pian, E. et al. 1998b, ApJ, 492, L103–L106.
- Piro et al. (1998) Piro, L. et al. 1998, A&A, 331, L41–L44.
- Sahu et al. (1997) Sahu, K. C. et al. 1997, Nature, 387, 476.
- Sari, Piran, and Narayan (1998) Sari, R., Piran, T., and Narayan, R. 1998, ApJ, 497, L17.
- Sokolov et al. (1999) Sokolov, V. V., Zharikov, S. V., Baryshe, Y. V., Hanski, M. O., Nilsson, K., Teerikorpi, P., Nicastro, L., and Palazzi, E. 1999, accepted for publication in A&A;astro-ph/9809111.
- Storchi-Bergmann, Kinney, and Challis (1995) Storchi-Bergmann, T., Kinney, A. L., and Challis, P. 1995, ApJS, 98, 103+.
- Wijers and Galama (1999) Wijers, R. A. M. J. and Galama, T. J. 1999, submitted to the Ap. J.; astro-ph/9805341.
- Wijers, Rees, and Mészáros (1997) Wijers, R. A. M. J., Rees, M. J., and Mészáros, P. 1997, MNRAS, 288, L51–L56.
- Williams et al. (1996) Williams, R. E. et al. 1996, AJ, 112, 1335.
- Zharikov, Sokolov, and Baryshev (1998) Zharikov, S. V., Sokolov, V. V., and Baryshev, Y. V. 1998, A&A, 337, 356–362.
Figures