Optical spectroscopy of faint gigahertz peaked spectrum sources
Abstract
We present spectroscopic observations of a sample of faint Gigahertz Peaked Spectrum (GPS) radio sources drawn from the Westerbork Northern Sky Survey (WENSS). Redshifts have been determined for 19 (40%) of the objects. The optical spectra of the GPS sources identified with low redshift galaxies show deep stellar absorption features. This confirms previous suggestions that their optical light is not significantly contaminated by AGN-related emission, but is dominated by a population of old (9 Gyr) and metal-rich (0.2 Fe/H) stars, justifying the use of these (probably) young radio sources as probes of galaxy evolution. The optical spectra of GPS sources identified with quasars are indistinguishable from those of flat spectrum quasars, and clearly different from the spectra of Compact Steep Spectrum (CSS) quasars. The redshift distribution of the GPS quasars in our radio-faint sample is comparable to that of the bright samples presented in the literature, peaking at . It is unlikely that a significant population of low redshift GPS quasars is missed due to selection effects in our sample. We therefore claim that there is a genuine difference between the redshift distributions of GPS galaxies and quasars, which, because it is present in both the radio-faint and bright samples, can not be due to a redshift-luminosity degeneracy. It is therefore unlikely that the GPS quasars and galaxies are unified by orientation, unless the quasar opening angle is a strong function of redshift. We suggest that the GPS quasars and galaxies are unrelated populations and just happen to have identical observed radio-spectral properties, and hypothesise that GPS quasars are a sub-class of flat spectrum quasars.
1 Introduction
Gigahertz Peaked Spectrum (GPS) sources are a class of compact radio source, characterised by a convex radio spectrum peaking at a frequency of 1 GHz. Together with the class of Compact Steep Spectrum (CSS) sources, which have spectra peaking at lower frequencies, they form a significant fraction ( 30%) of the high frequency radio source population (see O’Dea 1998, for a recent review on GPS and CSS sources). Their optical counterparts are a mixture of quasars and galaxies, with the quasars preferentially found at significantly higher redshifts than the galaxies (, O’Dea et al 1991, Stanghellini et al. 1998). The VLBI-morphologies (Stanghellini et al. 1997) and the distributions of radio spectral peak frequencies (de Vries et al., 1997; Snellen et al., 1998b) also seem to be different for GPS galaxies and quasars. These differences cause severe problems for orientation-based unification of GPS galaxies and quasars.
Their small sizes ( 100 pc) have made GPS sources the prime candidate to represent the early stages of radio source evolution (Fanti et al. 1995, Readhead et al. 1996, O’Dea and Baum 1997). The alternative hypothesis, which assumes these sources to be small due to confinement by a particularly dense interstellar medium (O’Dea et al. 1991), is less likely as recent observations show that the surrounding media of GPS sources are not significantly different from large scale sources (eg. Fanti et al. 1995). In addition, Owsianik and Conway (1998) have determined that the dynamical age of the radio source 0710+319, a prototype GPS galaxy, to be years by measuring the propagation velocity of its hot spots. It is therefore likely that at least some of the GPS galaxies represent the young counterparts of “old” extended radio sources. These are therefore the objects of choice to study the initial evolution of radio sources. Investigating the optical hosts and environments of GPS sources provides important information on the circumstances under which a radio source is formed.
Here we present results on a sample of faint GPS sources (Snellen 1997) selected from the Westerbork Northern Sky Survey (WENSS; Rengelink et al. 1997). The combination of this new faint sample and existing brighter samples (Fanti et al 1990; O’Dea et al 1991; Stanghellini et al., 1998; de Vries et al., 1997) allow for the first time the disentanglement of redshift and radio luminosity effects.
Previous papers have described the selection (Snellen et al. 1998a), and optical and near-infrared imaging of the radio-faint GPS sample (Snellen et al. 1998b). This paper describes the spectroscopic observations, leading to a discussion of the emission and absorption line properties and the redshift distributions of the GPS galaxies and quasars.
2 The Sample
The selection of the sample has been described in detail in Snellen et al. (1998a). Candidate GPS sources selected from the Westerbork Northern Sky survey, are those with an inverted spectrum between 325 MHz and higher frequencies. The sources are located in two regions of the survey; one at and , which is called the mini-survey region (Rengelink et al. 1997), and the other at and . Additional observations at 1.4, 5, 8.4 and 15 GHz were carried out with the WSRT and the VLA, yielding a sample of 47 genuine GPS sources with peak frequencies ranging from 500 MHz to more than 15 GHz, and peak flux densities ranging from to mJy. This sample has been imaged in the optical and near-infrared, resulting in an identification fraction of 87 % (Snellen et al. 1998b).
The subsample for which we obtained optical spectra was selected in the following way. During the first observing session with the William Herschel Telescope (WHT), 5 of the 15 GPS sources in the mini-survey region identified with GPS objects were observed, but no redshifts could be determined due to the low signal-to-noise ratio of these observations. Subsequently, we concentrated on the brighter sources in the sample. In the mini-survey region the 11 sources identified with an object were observed. In the region between , the eight sources identified with an object were observed, except for B0441+5757 which could not be observed due to scheduling constraints.
3 Observations and Reduction
Object Tel. Date Exp. (mag) (sec) B0531+6121 19.0 WHT 20 Dec. 1995 1800 B0537+6444 19.5 WHT 8 Jan. 1997 1800 B0544+5847 19.4 WHT 8 Jan. 1997 1800 B0601+5753 19.1 WHT 20 Dec. 1995 1800 B0755+6354 19.1 WHT 20 Dec. 1995 1800 B0758+5929 19.3 WHT 8 Jan. 1997 1800 B0826+7045 19.7 WHT 8 Jan. 1997 1800 B0830+5813 15.9 INT 11 Nov. 1996 600 B1525+6801 23.1 WHT 25 Jul. 1995 3000 B1538+5920 20.9 WHT 20 Jun. 1997 1800 B1550+5815 16.7 INT 30 Jul. 1995 1200 B1551+6822 23.8 WHT 26 Jul. 1995 3000 B1557+6220 22.5 WHT 24 Jul. 1995 3000 B1622+6630 17.2 WHT 12 Aug. 1996 3000 B1642+6701 17.0 INT 30 Jul. 1995 1200 B1647+6225 22.9 WHT 12 Aug. 1996 3000 B1746+6921 19.2 INT 30 Jul. 1995 1800 B1819+6707 17.7 INT 30 Jul. 1995 2400 B1841+6715 20.5 WHT 31 Aug. 1994 3600 B1942+7214 23.0 WHT 26 Jul. 1995 3000 B1945+6024 20.4 INT 30 Jul. 1995 3000 B1946+7048 16.3 INT 30 Jul. 1995 900 B1954+6146 22.2 WHT 25 Jul. 1995 3000 B1958+6158 19.1 WHT 19 Jun. 1997 1800
| Object | ID | Line | Peak | Redshift | Flux | FWHM | Eq. Width |
| (rest) | |||||||
| B0531+6121 | G | ||||||
| OII | |||||||
| H | |||||||
| OIII | |||||||
| OIII | |||||||
| B0537+6444 | Q | ||||||
| Ly | |||||||
| SiIV/O | |||||||
| CIV | |||||||
| CIII | |||||||
| B0544+5847 | |||||||
| Q | Ly | ||||||
| CIV | |||||||
| CIII | |||||||
| B0601+5753 | Q | ||||||
| CIV | |||||||
| HeII | |||||||
| CIII | |||||||
| MgII | |||||||
| B0755+6354 | Q | ||||||
| Ly | |||||||
| CIV | |||||||
| B0758+5929 | Q | ||||||
| CIV | |||||||
| CIII | |||||||
| B0826+7045 | Q | ||||||
| SiIV/O | |||||||
| CIV | |||||||
| HeII | |||||||
| CIII | |||||||
| B0830+5813 | G | ||||||
| NII | |||||||
| B1538+5920 | Q | ||||||
| Ly | |||||||
| NV | |||||||
| CIV | |||||||
| B1550+5815 | Q | ||||||
| CIII | |||||||
| MgII | |||||||
| B1622+6630 | G | ||||||
| OII | |||||||
| H | |||||||
| OIII | |||||||
| OIII | |||||||
| H | |||||||
| B1642+6701 | Q | ||||||
| SiIV/O | |||||||
| CIV | |||||||
| CIII | |||||||
| B1647+6225 | Q | ||||||
| Ly | |||||||
| NV | |||||||
| CIV | |||||||
| CIII |
a No reliable determination of FWHM posibble due to associated absorption.
b several stellar absorption lines are present consistent with the emission
line redshift.
| Object | ID | Line | Peak | Redshift | Flux | FWHM | Eq. Width |
| (rest) | |||||||
| B1746+6921 | Q | ||||||
| CIV | |||||||
| CIII | |||||||
| B1819+6707 | G | ||||||
| OII | |||||||
| OIII | |||||||
| OIII | |||||||
| B1841+6715 | G | ||||||
| OII | |||||||
| H | |||||||
| OIII | |||||||
| B1945+6024 | Q | ||||||
| Ly | |||||||
| CIV | |||||||
| B1946+7048 | G | ||||||
| OII | |||||||
| H | |||||||
| OIII | |||||||
| OIII | |||||||
| OI | |||||||
| B1958+6158 | Q | ||||||
| Ly | |||||||
| SiIV/O | |||||||
| CIV | |||||||
| HeII | |||||||
| CIII | |||||||
| MgII |
The observations were carried out using the 2.5m Isaac Newton Telescope (INT) and the 4.2m William Herschel telescope (WHT). Some of these observations were done as part of a programme carried out in the international CCI observing period on the La Palma telescopes in 1995. Table 1 gives the log of the observations. The ISIS long slit spectrograph was used for the WHT observations, with a Tektronix CCDs in both the red and blue arms. A spectral resolution of Å was obtained between 3500 and 9000 Å, using a slit width of 2′′ and R158 gratings. The Intermediate Dispersion Spectrograph (IDS) was used for the INT observations, with a Tektronix CCD. A spectral resolution of Å was obtained between 4000 and 7500 Å using a slit width of two arcsec and a grating with 300 grooves/mm. Usually the slit was oriented near the paralactic angle.
The reduction of the spectra was carried out using the ‘Long Slit’ package of the NOAO’s IRAF reduction software. A bias frame was constructed by averaging ‘zero second’ exposures taken at the beginning of each night. This was subtracted from every non-bias frame. The pixel-to-pixel variations were calibrated using flat fields obtained from an internal quartz lamp. Wavelength calibration was carried out by measuring the positions on the frames of known lines from either an Cu-Ne or a Cu-Ar calibration lamp. The sky contribution was removed by subtracting a sky spectrum obtained by fitting a polynomial to the intensities measured along the spatial direction outside the vicinity of targets. One dimensional spectra were extracted by averaging in the spatial direction over an aperture as large as the spatial extent of the brightest emission line.
4 Results
Redshifts were determined for all 11 sources in the mini-survey region identified with an object, and for 8 sources in the region between , which are all sources in this region identified with an object, except B0441+5757. Five of the 15 GPS sources in the mini-survey region identified with GPS objects were observed, but no redshifts could be determined: For four objects no lines were seen at a level of and the signal-to-noise ratio was too poor to detect absorption against the faint continuum. In addition, there were no spectral features observed in B1954+6154 to determine the redshift (see below). The spectra of the 19 sources with determined redshifts and of B1954+6154 are shown in figure 1. Their emission line properties are given in table 2. The final redshifts of the objects and their uncertainties were determined, taking into account the redshift differences and uncertainties of the individual lines. A distinction between galaxies and quasars has been made on grounds of optical morphology (stellar-extended) and emission line widths. A distinction between galaxies and quasars has been made on grounds of optical morphology (stellar-extended) and emission line widths. The optical host is called a quasar when there is no resolved galaxy visible in the optical CCD-image (Snellen et al. 1998b) and the spectrum shows emission lines with FWHM 2500 km sec-1.
One of the objects, B1954+6146, has a very peculiar spectrum. Below 6000 Å, the spectrum is faint and flat, while redward of 6000Å a steep rise in luminosity occurs. It was therefore not clear whether we should classify this object as a galaxy or a quasar. No lines could be identified. The band image of this object (Snellen et al. 1998b) shows a point source surrounded by faint extended emission. It is likely that the optical morphology and spectrum are produced by a non-thermal quasar nucleus visible in the red, but obscured in the blue. This would imply a reddening of about 9-10 magnitudes in the band, assuming a flat spectral energy distribution for the quasar nucleus and a standard extinction curve.


4.1 The Optical Spectra of GPS Galaxies

We obtained reliable spectra for six GPS galaxies, namely B0531+6121, B0830+5813, BG1622+6630, B1819+6707, B1841+6715 and B1946+7048. The spectra of two of the galaxies are clearly dominated by light coming from the active nucleus: B0531+6121 has a powerlaw spectrum and can be classified as a narrow-line radio galaxy with bright Seyfert 2-like emission lines. B1622+6630 can be classified as a Seyfert 1.5 with broad (FWHM 3500 km/s) H emission, and resembles the well known GPS galaxy B1404+286 (OQ208, MrK668, eg. O’Dea et al. 1991, and references therein). The broadline region of B1622+6630 seems to be heavily obscured and only visible in the red part of the spectrum. Unlike in B0531+6121, stellar absorption line features and the 4000 Å break are visible in the blue part of the spectrum of B1622+6630 indicating that the non-stellar nuclear light is less prominent in the blue. The emission lines of the other four GPS galaxies are typical for radio galaxies, showing [OII] , the [OIII] and lines, H/NII, H and in one case (B1946+7048) [OI] . Their [OII]/[OIII] line ratios indicate low ionisation.
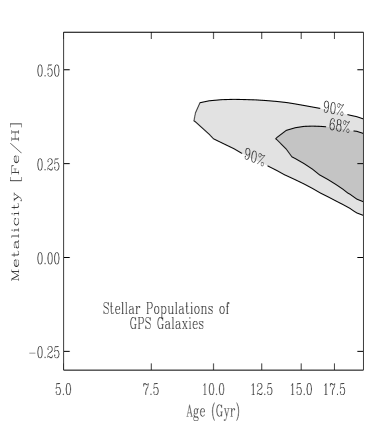
The optical to near-infrared broadband colours and magnitudes are consistent with GPS galaxies being giant elliptical galaxies with old stellar populations (Snellen et al., 1996a,b.; O’Dea et al. 1996). The spectra obtained here can be used to determine whether the properties of the stellar absorption lines are consistent with this hypothesis. Stellar absorption lines are a more powerful tool than broadband colours, because the range of absorption features can be used to disentangle age and metalicity effects (Worthey 1994). Furthermore, the measured equivalent widths of the lines are less influenced by calibration errors. The three highest signal-to-noise spectra of the most nearby GPS galaxies were shifted to the rest-frame and combined together to form a composite GPS galaxy spectrum (figure 2). The spectrum clearly shows the 4000 Å break and several deep stellar absorption lines, with as most prominent, the G-band at 4300 Å, Fe4668 Å, Mgb at 5175 Å and NaD at 5900 Å, with equivalent widths of 6.7, 7.3, 5.0 and 4.5 Å respectively. The absorption line indices were compared with the Worthey (1994) models to estimate their age and metalicity. According to these models, the dominant light of these galaxies is coming from a stellar population with an age Gyr and a metalicity between 1.5 and 2.5 times solar (figure 2).
Optically selected ellipticals show a strong correlation between absorption line strengths and mass (Dressler et al. 1987): the more massive the galaxy, the deeper the absorption lines. This indicates that giant ellipticals are more metal rich and/or have older stellar populations than smaller ellipticals. The deep stellar absorption lines in the GPS galaxies are therefore consistent with them being among the most massive ellipticals, as found by Snellen et al. (1996a, 1996b). This makes it unlikely that a non-stellar contribution from the active nucleus is present in the optical continuum of these galaxies. Even a small contribution of, say 5%, would make the intrinsic absorption lines 5% deeper, resulting in even higher ( 20%) metalicities and/or ages, which would correspond to unlikely ages higher than the age of the universe, and masses larger than those for central cluster galaxies. The claim that GPS galaxies are ideal objects to study the cosmological evolution of giant ellipticals seems therefore justified.
4.2 The Optical Spectra of GPS Quasars
In optical studies of quasars, GPS sources are generally treated as flat-spectrum radio sources. It is interesting to compare the optical (restframe UV) spectra of GPS quasars with those of the general population of flat-spectrum quasars, to see whether a distinction can be made between the two classes of objects. Any differences may provide important evidence on the influence Doppler boosting and orientation have on the optical and radio spectra of GPS quasars.
4.2.1 The composite GPS quasar spectrum
Baker and Hunstead (1995) have studied a sample of flat spectrum quasars as a function of their ratio of radio core-to-lobe flux density to reveal the effects of orientation. They divided the quasars in their sample into three sub-samples according to their radio core-to-lobe ratios ; (core dominated), (intermediate), and (lobe dominated). They found that core-dominated quasars have bluer optical spectra, a stronger 3000 Å bump and smaller equivalent widths than lobe dominated quasars. All these trends can be accounted for assuming an increase in dust extinction with viewing angle. In addition, Baker and Hunstead (1995) found the spectra of CSS quasars to have evidence of even more reddening, with steep powerlaw continua, strong low-ionisation narrow-line emission, and no 3000 Å bump.
Following the same procedure as Baker and Hunstead (1995) we produced a composite GPS quasar spectrum. To derive the composite spectrum, each individual spectrum was shifted to the quasar rest frame, and fitted with a power-law, , in the wavelength ranges , , and Å, thereby avoiding the influence of emission lines and contamination by the 3000 Å bump. This power law fit was used to find the level of the continuum at 3000 Å and to normalise the spectra at this wavelength. The redshifted and normalised spectra were then co-added without using any weighting. Because of obvious flux calibration problems, the data from the red ISIS arm of B0601+5753 and B0758+5929, and the data blueward of 4500 Å of B0758+5929 and B0826+7045, could not be used in this process.
By normalising the spectra at a given wavelength, spectral slope characteristics have largely been preserved. However, to be able to make a comparison with the Baker and Hunstead results, the spectra have been normalised at the same wavelength (3000 Å), which for all our quasars is at or even beyond the red end of their observed spectrum. This makes the contribution of the blue quasars stronger than the red quasars in the composite spectrum, but this effect should be similar in the Baker and Hunstead results in this part of the spectrum. The composite spectrum is shown in figure 3. Below 1500 Å the composite spectrum is very inaccurate, because only a few quasars, the ones with the highest redshifts, contribute to this part of the spectrum. The fitted power law, indicated by the dashed line, has a spectral index of 0.8, using the wavelength ranges , , and Å. However, when using only the wavelength ranges , and Å, a spectral index of 0.7 is obtained, indicating the uncertainty in the fit caused by the spectral curvature. Even taking into account this uncertainty the 3000 Å bump is clearly visible. The equivalent widths of Lyα, CIV, CIII and MgII are 65 Å, 25 Å, 20 Å and 25 Å, respectively.
The composite GPS quasar spectrum is clearly different from that of CSS quasars and is similar to that constructed for flat-spectrum quasars (Baker and Hunstead, 1995). The spectral slope measured for the composite GPS quasar spectrum is comparable to that for the intermediate sub-sample (0.7), and the strength of the 3000 Å bump is consistent with both the core-dominated and intermediate sub-sample. The equivalent widths of the mayor emission lines matches better those of the core-dominated quasars (Lyα = 70 Å, CIV = 50 Å, CIII = 34 Åand MgII = 43 Å) than those of the lobe-dominated quasars (CIV = 120 Å, CIII = 16 Å and MgII = 71 Å). The composite GPS quasar spectrum shows that the average optical properties of GPS quasars are indistinguishable from those of flat-spectrum quasars in general, but that they appear to be more like core-dominated quasars than lobe-dominated quasars. It is likely that GPS quasars are also present in the Baker and Hunstead (1995) sample. They will appear in the core-dominated sub-sample because the values are measured at resolution. The composite GPS quasar spectrum is therefore consistent with the Baker and Hunstead result. Note however that the redshift distribution for the GPS quasars is different from that of flat-spectrum quasars and that of CSS quasars. For the samples used, GPS quasars are biased towards the highest redshifts and CSS quasars are biased towards the lowest redshifts, and within the sample of flat-spectrum quasars, the core-dominated quasars are biased towards higher redshifts than the lobe-dominated quasars. The cosmological evolution of dust in the vicinity of quasars may therefore influence this result, and any conclusions must be drawn with caution. The evidence for a low dust extinction in GPS quasars may indeed indicate a small viewing angle as proposed by Baker and Hunstead for core-dominated quasars, but it can also reflect a decrease in dust-content with redshift.

4.2.2 The Baldwin effect in GPS quasars
A major effect in quasar spectra is the Baldwin effect, in which the equivalent width of the CIV 1549 line decreases with increasing continuum luminosity, particularly in quasars that are flat spectrum radio sources (Baldwin 1977, Baldwin, Wampler and Gaskell 1989). In photo-ionisation models for quasars, the line luminosity is linearly dependent on the continuum luminosity, but is also a strong function of the density and ionisation parameters. The Baldwin effect is believed to be a consequence of an ionisation parameter decreasing with luminosity (Mushotzky and Ferland, 1984). Interestingly, due to the fact that the line flux is not Doppler boosted, the scatter in the CIV-continuum luminosity relation can be used to put an upper limit on the average Doppler factors for the optical continuum in GPS quasars (Kinney et al. 1985).
To investigate the Baldwin effect in GPS quasars, our sample has been complemented with objects from the complete sample of radio-bright GPS sources of Stanghellini et al. (1998). This results in an additional 5 GPS quasars at with their CIV emission-line subsequently redshifted to optical wavelengths. The CIV emission line properties of these radio-bright GPS quasars are taken from the literature and shown in table 3. The Baldwin effect for the 17 GPS quasars is shown in figure 4. The spectra of 3 quasars show clear evidence that their CIV emission lines are severely disrupted by associated absorption, which greatly decreases their line luminosities and equivalent widths. These objects, B0554+5847, B0758+5929, and B1746+6921, are indicated by open squares in figure 4. The spectrum of quasar B1945+6024 is of insufficient signal-to-noise to determine whether CIV absorption is present. However, the low equivalent width with respect to the continuum luminosity indicates that CIV absorption is indeed important. Although evidence of the Baldwin effect for the remaining quasars is mainly based on the one low luminosity source, its strength and scatter is comparable to that for flat spectrum quasars (dotted line, Baldwin, Wampler and Gaskell, 1989). The continuum luminosity at 1549 Å is plotted against the CIV line luminosity in figure 5, with the solid line indicating the best fit. A linear relation between the two quantities is indicated by the dotted line, and the difference between this linear relation and the observed relation is an alternative way of plotting the Baldwin effect.
The scatter in the CIV - continuum luminosity relation is only 30%. Although in general GPS quasar spectra show evidence for low dust contents, the scatter may be partially induced by the ratio of dust extinction towards the CIV and continuum emission regions changing from quasar to quasar. More interestingly, the fact that the CIV emission line is emitted isotropically (and not too much affected by dust at small viewing angles to the line of sight) allows the scatter to be used to put an upper limit on the optical Doppler boosting. For example, if the optical continuum is Doppler boosted, the emission line luminosity is independent of viewing angle (disregarding extinction), but the continuum luminosity is a strong function of viewing angle. Therefore a sample of quasars with viewing angles randomly distributed within a certain range will result in a larger scatter in the CIV - continuum luminosity relation. A population of quasars with randomly distributed viewing angles within and with velocities of have optical continua which are on average Doppler boosted by a factor 5, and produce a 30% scatter in the CIV - continuum luminosity relation. If a smaller quasar opening angle is used, the scatter is lower due to a smaller range in viewing angles. However, if the quasar-opening-angle is reduced in such a way that the scatter allows , quasar-to-quasar variations in are likely to produce a much larger scatter in the observed CIV-continuum luminosity relation. The low scatter in the Baldwin effect therefore indicates that the optical emission of GPS quasars is only mildly Doppler boosted, unless there is only a small range in both s and viewing angles.
A weak correlation between the CIV luminosity and radio luminosity (figure 6) enables us to perform a similar analysis on the radio emission. Assuming that the factor 3 scatter is produced by source to source variations in Doppler boosting leads to an upper limit of and the conclusion that the dominant radio emission in GPS quasars is on average not more Doppler boosted than by a factor of 15.
| Source | z | W(CIV) | Ref. | ||
|---|---|---|---|---|---|
| () | () | (Å) | |||
| 0237-233 | 2.223 | 1.2e-15 | 1.5e-13 | 39 | 1,2 |
| 0457+024 | 2.384 | 6.9e-17 | 1.1e-14 | 45 | 3 |
| 1442+101 | 3.544 | 2.3e-16 | 1.4e-14 | 14 | 4 |
| 2126-158 | 3.270 | 6.0e-16 | 3.6e-14 | 14 | 4 |
| 2134+004 | 1.936 | 5.4e-16 | 5.2e-14 | 33 | 3 |
References:
1: Wills et al. 1993
2: Wilkes et al. 1983
3: Baldwin, Wampler and Gaskell, 1989
4: Osmer, Porter and Green, 1994


4.3 The Redshift Distributions of GPS Galaxies and Quasars


The optical counterparts of GPS sources at redshifts smaller than unity are seldomly found to have broad emission lines (eg. Stanghellini et al. 1998). For some of those, the contrast between the stellar and non-stellar emission is low (eg. 1404+286; Osterbrock and Cohen, 1979 and B1622+6630; this paper) which is why they are called Broad Line Radio Galaxies (BLRG) instead of quasars. Other ‘low’ redshift GPS sources also have a substantial non-stellar contribution in their optical light as indicated by a power-law optical spectrum but have no broad emission lines (eg. 2342+821 (Lawrence et al., 1996) and 0531+6121; this paper). However the large majority of low redshift GPS sources () are galaxies which show, apart from some narrow emission lines, no evidence for a contribution of non-thermal emission in the optical. High redshift GPS sources () are generally found to be genuine quasars (O’Dea 1990, O’Dea et al. 1991) with strong broad emission lines and no sign of the underlying host galaxies due to the high contrast between non-thermal nuclear emission and integrated star light.
It is important to establish whether this dependence of optical host with redshift is genuine, or whether it is due to selection effects; i) The known redshifts of GPS galaxies are likely to be biased towards low redshift because it is increasingly difficult to measure their emission line features with redshift (at least up to at which Ly and CIV are shifted into the optical band). Note that the small fraction of low redshift BLRGs would be identified as galaxies if located at high redshift, since their ratio and stellar absorption lines indicate that the non-stellar component is strongly absorbed and not visible at rest-frame UV wavelengths. Therefore, the classification of BLRG as galaxies and not as quasars does not bias the redshift distributions. ii) The high redshift GPS quasars are found to have substantially higher rest-frame radio peak frequencies than the GPS galaxies (Stanghellini et al. 1998, Snellen et al. 1998b). If a population of low redshift GPS quasars with similar peak frequencies as the high redshift quasars exists, it would not have been included in the radio-bright samples due to their too high observed radio-peak frequencies.
Both selection effects can be investigated with our faint sample. Due to the well established Hubble diagram for GPS galaxies (Snellen et al. 1996a), the redshifts of the GPS galaxies can be estimated using their optical band magnitude. Although this method results in an increasing uncertainty with redshift, we believe it is sufficient to establish differences between the redshift distributions. The faint GPS sample has been constructed in such a way that if an object falls within the sample at , it also would have been in the sample if it was located at . This is due to the fact that the sources are selected on the optically thick (inverted) part of their radio spectrum, and no high-frequency cut-off has been made. The shift in the peak frequency to higher values due to a lower redshift would be compensated for by an increase in the peak flux density. For example, the GPS quasar B1945+6024 at z=2.70 is in our sample, although it has an (undetermined) peak frequency larger than 15 GHz. No low redshift GPS quasars are found in our sample, which makes it unlikely that a significant population of low redshift GPS quasars is missing in the current GPS samples.
Knowing it to be free from major selection effects, the redshift distributions of the quasars and galaxies in the complete radio-bright GPS sample of Stanghellini et al (1998) and the faint sample can be compared. The radio luminosities of the objects in both samples are calculated as the peak frequency times the peak flux density, and assuming km/sec/Mpc and . For only five (25%) of the GPS galaxies in the Stanghellini et al. sample the redshifts were to be estimated from their band magnitudes. This method had to be used for the majority of the galaxies in the faint sample (80%), and for 8 of these (26%) only a lower limit of the redshift could be obtained. All the redshifts of the quasars in the bright sample and 70% of those in the faint sample have been measured. The radio luminosities of the GPS sources versus redshift are shown in figure 7. The diamonds indicate sources from the bright sample and the squares indicate sources from the faint sample. Filled symbols are quasars and open symbols are galaxies. Clearly in both samples the galaxies are found at low redshift and the quasars at high redshift. The GPS galaxies in the faint sample are biased towards higher redshift than the galaxies in the radio-bright sample (figure 8). In the faint sample, only 6 out of 27 galaxies (22%) are found at z0.5, while in the radio-bright sample 12 out of 19 galaxies (63%) are found at z 0.5. In addition, the faintest galaxies in the radio-faint sample are fainter than the faintest galaxies in the radio-bright sample. However, at present, it is not clear whether this is due to lower optical luminosities or higher redshifts of the host galaxies. A small fraction of the faint and red optical identifications may turn out to be quasars instead of galaxies. However, if quasars, they are most likely to be at even higher redshifts than the optically brighter quasars, since the colours of quasars at become rapidly redder with redshift due to the absorption by intervening Ly (eg. Hook et al., 1995). Therefore, this would unlikely affect the observed difference in redshift distribution.
The fact that in both samples the galaxies are found at low redshift and the quasars at high redshift, indicates that these different redshift-distributions are not caused by a radio-power effect; the higher the radio power, the larger the chance to see the quasar nucleus. Such an effect, that may be caused by a luminosity-dependent quasar opening-angle, could in a flux density limited sample lead to the dependence of optical host with redshift. However, finding a similar effect in both the faint and bright sample rules out this possibility. In figure 9 it is shown that the radio-luminosities of the GPS galaxies in the radio-bright sample are comparable to the luminosities of the GPS quasars in the radio-faint sample. This, combined with the fact that the quasar fraction is the same in both samples within the uncertainties, indicates that the galaxy-quasar difference is not a radio-power effect but a redshift effect.
The lifetime of a radio source is much smaller than cosmological time scales. Therefore, if GPS quasars and galaxies are unified by orientation, their different redshift distributions imply that the quasar opening angle is a strong function of redshift. However, such a strong dependence of opening angle with redshift needed to explain the data is not found for other types of radio-loud AGN. Snellen et al. (1998c) show that if GPS galaxies were oriented towards us, that their overall radio spectrum would change from gigahertz peaked to flat spectrum and variable, due to Doppler boosting of the inner radio components. This is a strong indication that GPS galaxies and quasars are not unified by orientation and that they form two distinct classes of objects which just happen to have the same observed radio-spectral properties.
In this case, the GPS quasars may be a sub-class of flat spectrum sources in general, having physical parameters at one end of the range seen in flat spectrum quasars. A model should account for their low flux density variability, peaked radio spectra, low extinction optical spectra, and low dispersion in the CIV-continuum relation as presented in section 4.2.2. For example, the GPS quasars may have slower jets (due to a denser medium, O’Dea et al. 1991) than the flat spectrum quasars in general, or their jets may be pointed more towards us resulting in a larger optical depth and possible synchrotron self absorption. A detailed comparison of the redshift distributions and the radio-spectral properties of GPS and flat spectrum quasars, including variability studies, are needed to further investigate this hypothesis.
5 Conclusions
We have presented spectroscopic observations of a sample of faint Gigahertz Peaked Spectrum (GPS) radio sources drawn from the Westerbork Northern Sky Survey (WENSS). Redshifts have been determined for 19 (40%) of the objects. The optical spectra of the low redshift GPS galaxies show deep stellar absorption features, which confirms that their optical light is not significantly contaminated by AGN-related emission, but is dominated by a population of old (9 Gyr) and metal-rich (0.2 Fe/H) stars. The optical spectra of GPS sources identified with quasars are indistinguishable from those of flat spectrum quasars. Their blue colours and strong 3000 Å bump indicate low dust extinction, which is comparable to the spectra of core-dominated quasars, but clearly different from the spectra of Compact Steep Spectrum (CSS) quasars. The low dispersion in the Baldwin effect for GPS quasars indicates that their optical continuum can only be mildly Doppler boosted. The redshifts of the GPS quasars in our radio-faint sample are comparable to those in the bright samples presented in the literature, and are preferentially found at . The construction of the radio-faint sample was such, that it is unlikely that a significant population of low redshift GPS quasars has been missed due to selection effects. We therefore claim that there is a genuine difference between the redshift distributions of GPS galaxies and quasars which, because it is present in both the radio-faint and bright samples, can not be due to a redshift-luminosity degeneracy. It is unlikely that the GPS quasars and galaxies are unified by orientation, unless the quasar opening angle is a strong function of redshift. We suggest that the GPS quasars and galaxies are not related and just happen to have identical observed radio-spectral properties, and hypothesise that GPS quasars are a sub-class of flat spectrum quasars in general.
acknowledgements
We thank the Comite Cientifico International (CCI) of the IAC for the allocation of observing time. The Isaac Newton Telescope, and the William Herschel Telescope are operated on the island of La Palma by the Isaac Newton Group in the Spanish Observatorio del Roque de los Muchachos of the Instituto de Astrofisica de Canarias. We thank Richard McMahon and Neal Jackson for taking some of the spectra. This work was in part funded through an NWO programme subsidy and by the European Commission under contracts SCI*-CT91-0718 (The Most Distant Galaxies) and ERBFMRX-CT96-086 (Formation and Evolution of Galaxies), and ERBFMRX-CT96-0034 (CERES).
References
- [1] Baker J.C. and Hunstead R.W., 1995, Astrophys. J., L95
- [2] Baldwin J.A., 1977, Astrophys. J., 214, 769
- [3] Baldwin J.A., Wampler E.J. and Gaskell C.M., 1989, Astrophys. J., 338, 630
- [4] Dressler A., Lynden-bell D., Burstein D., Davies R.L., Faber S.M., Terlevich, R., Wegner G., 1987, Astrophys. J., 313, 42
- [5] Fanti R., Fanti C., Schilizzi R.T., Spencer R.E., Nan Rendong, Parma P., Van Breugel W.J.M., Venturi T., 1990, Astron. Astrophys., 231, 333
- [6] Fanti C., Fanti R., Dallacasa D., Schilizzi R.T., Spencer R.E., Stanghellini C., 1995, Astr. & Astrophys., 302, 317
- [7] Hook I.M., McMahon R.G., Patnaik A.R., Browne I.W.A., Wilkinson P.N., Irwin M.J., Hazard C., 1995, Mon. Not. R. Astr. Soc., 273, L63
- [8] Mushotzky R. and Ferland G.J., 1984, Astrophys. J., 278, 558
- [9] Kinney A.L., Huggins P.J., Bregman J.N., Glassgold A.E., 1985, Astrophys. J., 291, 135
- [10] Lawrence C.R., Zucker J.R., Readhead A.C.S., Unwin S.C., Pearson T.J., Xu W.,, 1996, Astrophys. J. Suppl., 107, 541
- [11] O’Dea C.P., 1990, Mon. Not. R. Astr. Soc., 245, 20
- [12] O’Dea C.P., Baum S.A., Stanghellini C., 1991, Astrophys. J., 380, 66
- [13] O’Dea C.P., Stanghellini C., Baum S.A., Charlot S., 1996, Astrophys. J., 470, 806
- [14] O’Dea C.P., Baum S.A., 1997, Astron. J., 113, 148
- [15] O’Dea C.P., 1998, P.A.S.P., 110, 493
- [16] Osmer P.S., Porter A.C., Green R.F., 1994, Astrophys. J., 436, 678
- [17] Osterbrock and Cohen, 1979, Mon. Not. R. Astr. Soc., 187, 61
- [18] Owsianik I. and Conway J., 1998, Astr. & Astrophys., 337, 69
- [19] Readhead A.C.S., Taylor G.B., Xu W., Pearson T.J., Wilkinson P.N., Polatidis A.G., 1996, Astrophys. J., 460, 612
- [20] Rengelink R.B., Tang Y., de Bruyn A.G., Miley G.K., Bremer M.N., Röttgering H.J.A., Bremer M.A.R., 1997, Astron. Astrophys. Suppl., 124, 259
- [21] Snellen I.A.G., Bremer M.N., Schilizzi R.T., Miley G.K., van Ojik R., 1996a, Mon. Not. R. Astr. Soc., 279, 1294
- [22] Snellen I.A.G., Bremer M.N., Schilizzi R.T., Miley G.K., 1996b, Mon. Not. R. Astr. Soc., 283, 123
- [23] Snellen I.A.G., PhD thesis 1997, Leiden Observatory
- [24] Snellen I.A.G., Schilizzi R.T., de Bruyn A.G., Miley G.K., Rengelink R.B., Röttgering H.J.A., Bremer, M.N., 1998a, Astr. & Astrophys. Suppl., 131, 435
- [25] Snellen I.A.G., Schilizzi R.T., Bremer M.N., de Bruyn A.G., Miley G.K., Röttgering H.J.A., McMahon R.G., Pérez Fournon I., 1998b, Mon. Not. R. Astr. Soc., 301, 985
- [26] Snellen I.A.G., Schilizzi R.T., de Bruyn A.G., Miley G.K., 1998c, Astr. & Astrophys., 333, 70
- [27] Stanghellini C., O’Dea C.P., Baum S.A., Dallacasa D., Fanti R., Fanti C., 1997, Astron. & Astrophys., 325, 943
- [28] Stanghellini C., O’Dea, C. P., Dallacasa, D., Baum, S.A., Fanti, R.,Fanti, C., 1998, Astron. & Astrophys. Suppl., 131, 303
- [29] De Vries W.H., Barthel P.D., O’Dea C.P., 1997, Astronomy and Astrophysics, 321, 105
- [30] Wilkes B.J., Wright A.E., Jauncey D.L., Peterson B.A., 1983, Proceedings Astr. Soc. of Australia, Vol. 5, no. 1, p2
- [31] Wills B.J., Netzer H., Brotherton M.S., Han Mingsheng, Wills D., Baldwin J.A., Ferland G.J., Browne I.W.A., 1993, Astrophys. J, 410, 534
- [32] Worthey G., 1994, Astrophys. J. Suppl., 95, 107