Abstract. This paper reviews the results from recent optical and near-infrared spectroscopic studies of ultraluminous infrared galaxies.
1 Introduction
Over the last decade, several spectroscopic studies have attempted to determine the nature of the dominant energy source in ultraluminous infrared galaxies (ULIGs). Optical surveys of unbiased samples of luminous IRAS galaxies (e.g. Elston, Cornell, & Lebofsky 1985; Leech et al. 1989; Allen et al. 1991; Ashby, Houck, & Matthews 1995; Wu et al. 1998) generally have found that 80% of high-luminosity infrared galaxies (LIGs; ) present H II region-like optical spectra, and therefore appear to be powered by hot stars rather than an active galactic nucleus (AGN). However, the great majority of the infrared galaxies in these samples are in the luminosity range , with only a few having . This distinction is important as there is growing evidence that the fraction of AGN among LIGs increases with increasing (e.g., Sanders et al. 1988; Armus, Heckman, & Miley 1989; Veilleux et al. 1995; Sanders & Mirabel 1996; cf. §2).
Recent progress in infrared detector technology provides another approach to constrain the energy source in ULIGs. Near-infrared spectroscopy has the potential to more deeply probe the cores of ULIGs: for example, the extinction coefficient in the K-band is nearly 10 times smaller than at optical wavelengths. This technique has proven very useful in the study of highly reddened broad-line regions (BLRs) in intermediate Seyferts (1.8’s and 1.9’s; Goodrich 1990; Rix et al. 1990) and also has had success finding obscured BLRs in some optically classified Seyfert 2 and radio galaxies (e.g., Blanco, Ward, & Wright 1990; Goodrich, Veilleux, & Hill 1994; Ruiz, Rieke, & Schmidt 1994; Hill, Goodrich, DePoy 1996; Veilleux, Goodrich, & Hill 1997a) and in a few ULIGs (e.g., DePoy et al. 1987; Hines 1991; Nakajima, et al. 1991a,b; see Goldader et al. 1995, however).
The recent publication of the 1-Jy sample of ULIGs (Kim & Sanders 1998) offers a unique opportunity to verify these optical/near-infrared spectroscopic results. The 1-Jy survey provides a complete list of the brightest ULIGs with 1 Jy which is not biased toward ‘warm’ quasar-like objects with large ratios. This sample contains 118 objects with = 0.02 – 0.27 and log [Lir/L⊙] = 12.00 – 12.90. The infrared luminosities of these objects therefore truly overlap with the bolometric luminosities of optical quasars. Other surveys have discovered objects of comparable luminosity at fainter flux levels as well as a few ‘hyperluminous’ objects at higher Lir. However, the 1-Jy sample contains the brightest objects at a given luminosity, hence the best candidates for follow-up studies. The results from our optical spectroscopic survey of this sample are presented in Kim, Veilleux, & Sanders (1998; KVS) and Veilleux, Kim, & Sanders (1999a; VKS) and are summarized in §2. The near-infrared survey was just recently completed (Veilleux, Sanders, & Kim 1999b; VSK); the results are summarized in §3. The last section of the present paper (§4) combines the results from the optical and near-infrared surveys to derive the frequency of AGN/quasars among ULIGs and evaluate the importance of AGN/quasars in powering the large bolometric luminosities of ULIGs.
2 Optical Spectroscopy of the 1-Jy Sample of ULIGs
KVS and VKS discuss the optical spectroscopic properties of the 1-Jy sample of 118 ULIGs. These spectra are combined with those of Veilleux et al. (1995) to look for systematic trends with infrared luminosity among LIGs with . As found in Veilleux et al. (1995), the fraction of Seyfert galaxies among LIGs increases with infrared luminosity. For , about 48% of the ULIGs (15/31 objects) are classified as Seyfert galaxies. A summary of the spectral classification as a function of the infrared luminosity is presented in Figure 1.

Many of the spectroscopic properties of the Seyfert galaxies point to the existence of an AGN which is not present or visible in LINER or H II ULIGs. About 30% (10/33) of the Seyfert galaxies in the 1-Jy sample are of type 1, presenting broad Balmer lines and strong Fe II emission similar to what is observed in optically selected quasars. Seyfert ULIGs (especially those of type 1) have weaker H and Mg Ib stellar absorption features, bluer continuum colors, larger H luminosities and equivalent widths, smaller infrared-to-H luminosity ratios, and warmer IRAS colors than LINER or H II ULIGs. The [O III] 5007 line widths in the nuclei of the Seyfert galaxies are also significantly broader on average than those measured in the H II and LINER ULIGs.
The weak H and Mg Ib features in ULIGs optically classified as H II galaxies or LINERs suggests the presence of a young ( few 107 yrs) stellar population comprising 10% of the total galaxy mass in these objects (Bica, Alloin, & Schmidt 1990). While this starburst is the likely source of ionization among H II galaxies and some LINERs, long-slit information from Veilleux et al. (1995) and KVS indicates that the LINER-like emission may also be produced through shocks caused by the interaction of starburst-driven outflows with the ambient material. The weaker stellar absorption features, bluer observed continuum colors, and larger H emission equivalent widths among ULIGs indicate that the starburst becomes increasingly important with increasing infrared luminosity in both H II galaxies and LINERs.
3 Near-Infrared Spectroscopy of the 1-Jy Sample of ULIGs
The latest results from a sensitive near-infrared search for obscured BLRs in ULIGs from the 1-Jy sample are presented in VSK. The results from this survey were combined with those obtained by Veilleux, Sanders, & Kim (1997b) to produce a near-infrared spectroscopic database on sixty-four ULIGs. Prior to selecting these objects, the 10% of the 118 galaxies that already were known optically to show direct signs of quasar activity, i.e. optically classified as Seyfert 1, were excluded. VSK find that all of the galaxies with strong evidence for a hidden BLR at near-infrared wavelengths (Pa and/or Pa) present an optical Seyfert 2 spectrum. Overall, 50% (and perhaps up to 70%) of the optical Seyfert 2 galaxies in the combined sample present either a BLR or strong [Si VI] emission. All ten ‘warm’ () optically classified Seyfert 2 galaxies in the sample show either obscured BLRs or [Si VI] emission at near-infrared wavelengths. None of these objects have deficient Pa-to-infrared luminosity ratios. These results strongly suggest that the screen of dust obscuring the cores of ‘warm’ Seyfert 2 ULIGs is optically thin at 2 m. In contrast, none of the 41 optically classified LINERs and H II galaxies in the sample shows any obvious signs of an energetically important AGN at near-infrared wavelengths. The LINERs and H II galaxies in the sample span a wide range of IRAS colors and Pa-to-IR luminosity ratios. The apparent lack of AGN activity in these objects is therefore unlikely to be due solely to dust obscuration.
4 Discussion and Conclusions
The optical and near-infrared data taken together, suggest that the total fraction of objects in the 1-Jy sample with signs of a bonafide AGN is at least 20 – 25%. This fraction reaches 35 – 50% for objects with . These percentages are lower limits because the near-infrared method often fails to detect AGN activity ([Si VI] emission) in known optically selected Seyfert 2 galaxies (Marconi et al. 1994).
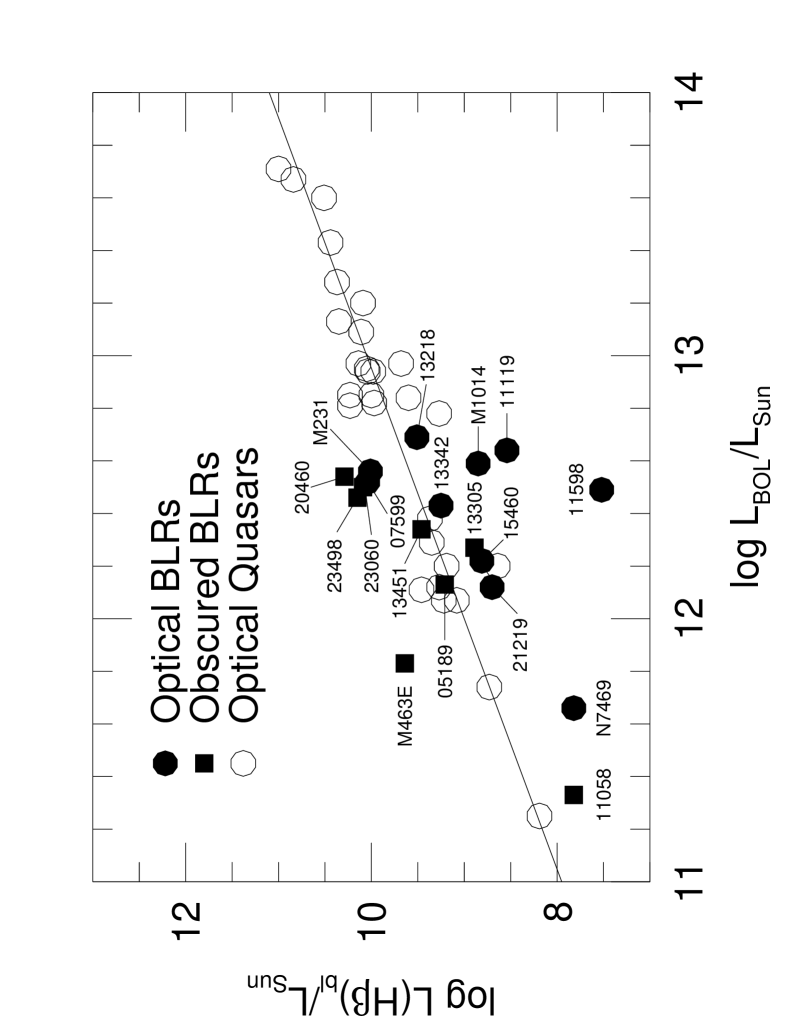
The presence of AGN activity in ULIGs does not necessarily imply that the AGN is the dominant energy source in these objects. A more detailed look at the AGN in these ULIGs is needed to answer this question. Following Veilleux et al. (1997b), we have plotted in Figure 2 the dereddened broad-line H luminosities of the optical and obscured BLRs in ULIGs and optically identified QSOs as a function of their bolometric luminosities. The methods and assumptions which were used to create this figure are briefly described in the caption (cf. Veilleux et al. 1997b, VKS, and VSK for a more detailed discussion). The typical uncertainties on the data points of Figure 2 are of order 30%. This figure brings support to the idea first suggested by Veilleux et al. (1997b) that most ( 80%) of the ULIGs with optical or near-infrared BLRs in the 1-Jy sample are powered predominantly by the quasar rather than by a powerful starburst. The AGN/quasar is therefore the dominant energy source in at least 15 – 25% of all ULIGs in the 1-Jy sample. This fraction is closer to 30 – 50% among ULIGs with . ULIGs with powerful AGN/quasar but with highly obscured BLRs would increase these percentages. An object-by-object comparison of our optical/near-infrared results with those obtained with ISO indicates a very good agreement between these two sets of data (cf. Genzel et al. 1998; VSK; Lutz, Veilleux, & Genzel 1999).
Acknowledgements.
The ground-based study discussed in this paper was done in collaboration with Drs. D. B. Sanders and D.-C. Kim. The author gratefully acknowledges the financial support of NASA through LTSA grant number NAG 56547.References
- [Allen et al. 1991] Allen, D. A., et al. 1991, M. N. R. A. S., 248, 528
- [Armus et al. 1989] Armus L., Heckman, T. M., & Miley, G. K. 1989, Ap. J., 347, 727
- [Ashby et al. 1995] Ashby, M., Houck, J. R., & Matthews, K. 1995, Ap. J., 447, 545
- [Blanco et al. 1990] Blanco, P. R., Ward, M. J., & Wright, G. S. 1990, M. N. R. A. S., 242, 4P
- [DePoy et al. 1987] DePoy, D. L., Becklin, E. E., & Geballe, T. R. 1987, Ap. J., 316, L63
- [Elston et al. 1985] Elston, R., Cornell, M. E., & Lebofsky, M. J. 1985, Ap. J., 296, 106
- [Elvis et al. 1994] Elvis, M. et al. 1994, Ap. J. Suppl., 95, 1
- [Genzel et al. 1998] Genzel, R. et al. 1998, Ap. J., 498, 579
- [Goldader et al. 1995] Goldader, J. D., et al. 1995, Ap. J., 444, 97
- [Goodrich 1990] Goodrich, R. W. 1990, Ap. J., 355, 88
- [Goodrich et al. 1994] Goodrich, R. W., Veilleux, S., & Hill, G. J. 1994, Ap. J., 422, 521
- [Hill et al. 1996] Hill, G. J., Goodrich, R. W., & DePoy, D. L. 1996, Ap. J., 462, 163
- [Hines 1991] Hines, D. C. 1991, Ap. J., 374, L9
- [Kim & Sanders 1998] Kim, D.-C., & Sanders, D. B. 1998, Ap. J. Suppl., 119, 41
- [Kim et al. 1998] Kim, D.-C., Veilleux, S., & Sanders, D. B. 1998, Ap. J., 508 627 (KVS)
- [Leech et al. 1989] Leech, K. J., et al. 1989, M. N. R. A. S., 240, 349
- [Lutz et al. 1999] Lutz, D., Veilleux, S., & Genzel, R. 1998, Ap. J. (Letters), in press
- [Marconi et al. 1994] Marconi, A., et al. 1994, A. & A., 291, 18
- [Nakajima et al. 1991a] Nakajima, T., Carleton, N. P., & Nishida, M. 1991a, Ap. J., 375, L1
- [Nakajima et al. 1991b] Nakajima, T., et al. 1991b, Ap. J., 373, 452
- [Rix et al. 1990] Rix, H.-W., et al. 1990, Ap. J., 363, 480
- [Ruiz et al. 1994] Ruiz, M., Rieke, G. H., & Schmidt, G. D. 1994, Ap. J., 423, 608
- [Sanders et al. 1995] Sanders, D. B., et al. 1995, A. J., 110, 1993
- [Sanders & Mirabel 1996] Sanders, D. B., & Mirabel, I. F. 1996, AR&A, 34, 725
- [Sanders et al. 1989] Sanders, D. B., et al. 1989, Ap. J., 347, 29
- [Sanders et al. 1988] Sanders, D. B., et al. 1988, Ap. J., 325, 74
- [Soifer et al. 1987] Soifer, B. T., et al. 1987, Ap. J., 320, 238
- [Veilleux et al. 1997a] Veilleux, S., Goodrich, R. W., & Hill, G. J. 1997a, Ap. J., 477, 631
- [Veilleux et al. 1999a] Veilleux, S., Kim, D.-C., & Sanders, D. B. 1999a, Ap. J., in press (VKS)
- [Veilleux et al. 1995] Veilleux, S., et al. 1995, Ap. J. Suppl., 98, 171
- [Veilleux et al. 1997b] Veilleux, S., Sanders, D. B., & Kim, D.-C. 1997b, Ap. J., 484, 92
- [Veilleux et al. 1999b] Veilleux, S., Sanders, D. B., & Kim, D.-C. 1999b, Ap. J., in press (VSK)
- [Wu et al. 1998] Wu, H., et al. 1998, A. & A. Suppl., 127, 521
- [Yee 1980] Yee, H. K. C. 1980, Ap. J., 241, 894