Long-Term Variability of the Hard X-ray Source GRS 1758–258: GRANAT/SIGMA Observations
Astronomy Letters 1999, 25
Received November 5, 1998; in final form, December 1, 1998.
Abstract
The results of GRANAT/SIGMA hard X-ray observations of GRS 1758–258 in 1990–1998 are presented. The source lies at from the Galactic Center and was within the SIGMA field of view during the GRANAT surveys of this region. The total exposure time of the Galactic Center was s. The regular SIGMA observations revealed strong variability of the source: the 40–150 keV flux varied at least by a factor of 8 on a time scale of a year, between less than 13 mCrab and 100–110 mCrab. The average flux was 60 mCrab in 1990–1998. The source’s spectrum is well fitted by a power law with a photon index 1.86 in the energy range 40 to 150 keV and becomes steeper at energies above 100 keV. The radio and hard X-ray properties of GRS 1758–258 are similar to those of another Galactic Center source, 1E1740.7–2942. GRS 1758–258 and 1E1740.7–2942 are the two brightest hard X-ray sources in the Galactic Center region. Both sources have radio jets, similar X-ray luminosities ( erg/s), and spectra, and exhibit variations in the hard X-ray flux on long times scales by a factor of or more . In contrast to most of the known black hole candidates, which are X-ray transients, GRS 1758–258 and 1E1740.7–2942 were detected by SIGMA during most of the observations in 1990–1998. Assuming that this behavior of the sources implies the suppression of accretion-disk instability in the region of partial hydrogen ionization through X-ray heating, we impose constraints on the mass of the optical companion and on the orbital period of the binary system.
1 Introduction
GRS 1758–258 was discovered by the ART-P and SIGMA telescopes onboard the GRANAT Observatory during the first series of observations of the Galactic Center region in March–April 1990 (Sunyaev et al. 1991; Gilfanov et al. 1993). Together with 1E1740.7–2942, this source dominated in the Galactic Center region in the 40–300 keV energy band. The hard X-ray spectra of GRS 1758–258 and 1E1740.7–2942, which extend up to 100–300 keV, are similar to the low-state spectra of Cygnus X–1, a well-known black hole candidate. Their spectral properties suggest that the two sources (GRS 1758–258 and 1E1740.7–2942) are black hole candidates (Sunyaev et al. 1991).
An analysis of the ROSAT soft X-ray observations in the Spring of 1993 led Mereghetti et al. (1994) to conclude that there is a soft X-ray component in the spectrum of GRS 1758–258. This conclusion was called into question by Grebenev et al. (1996), who performed an independent analysis of these and earlier (the Spring of 1992) ROSAT observations. Mereghetti et al. (1992) refined the source position to within 10″(90% error circle radius): ; (epoch 1950). A comparison of the ROSAT and GRANAT/SIGMA observations revealed a possible anticorrelation between the soft and hard spectral components (Mereghetti et al. 1994).
The XTE observations in the standard X-ray band show that the Power Density Spectra (PDS) of GRS 1758–258 and 1E1740.7–2942 are similar (Smith et al. 1997) and close to that of Cygnus X–1 (Smith et al. 1997; Miyamoto et al. 1992). X-ray flux QPOs were also found in the PDS of the two sources (Smith et al. 1997).
VLA radio observations of GRS 1758–258 at cm were carried out in early and mid–1992, when the hard X-ray flux (40–150 keV) from the source was below the SIGMA detection threshold ( 13 mCrab – upper limit; Gilfanov et al. 1993). A triple radio source was identified with GRS 1758–258 (Rodriguez et al. 1992). The position of the central core coincided with the ROSAT position of the X-ray source (Mereghetti et al. 1992), while the southern and northern lobes were, respectively, at 13 and 21 on either side of the core. A similar radio pattern was previously observed in 1E1740.7–2942 (Mirabel et al. 1992; Mirabel et al. 1993).
2 Instrument and observations
The SIGMA telescope is one of the principal instruments onboard the GRANAT Astrophysical Observatory. It is designed to obtain hard X-rays and soft -ray (35–1300 keV) images using the principle of a coded mask. The angular size of the full coding region is 47 43, and the field of view at half sensitivity is 105 106. The nominal angular resolution of the telescope is 13′(́the pixel size of the coded mask). Bright point sources can be localized to within several tens of arcseconds, depending on the source brightness and the number of observations. A more detailed description of the telescope was given by Paul et al. (1991).
Inflight energy calibrations of the telescope were performed using observations of Crab (the last observation was in October 1997). The angular resolution was calibrated using observations of bright compact sources (Cyg X–1, Crab , bright X-ray transients). Correction for the background illumination of the detector was made using observations of “empty fields” (regions of the sky without bright sources).
Observations111For the light curve all 1990-1998 data were used. The latest data (since the Fall of 1997) may be subject to slightly larger systematic errors that those for the previous years due to the slow evolution of the detector background illumination, whose last calibrations were performed in September 1997. A subsequent analysis of these data can result in small changes in the flux for the last three points in Fig.1. For the same reason, we do not provide the best-fit parameters for these observations in Tables 1–4. of the Galactic Center region were carried out yearly in the Spring and Fall of 1990–1994 and 1997–1998, in the Fall of 1995, and in the Spring of 1996, with a total duration of each individual survey between one week and two months. The mean duration of a single observing session was 20 h. The SIGMA total exposure time for 171 observations during 16 surveys of the Galactic Center region is 3100 h.
3 Light Curve
The light curve of the source averaged over the observational series is shown in Fig. 1. A maximum (40–150 keV) flux of 90–110 mCrab was recorded in 1990 and 1997. The observations in the Spring of 1991 revealed a decline in the flux to 70 mCrab.
During the observations in August–September 1991, the intensity of the hard X-ray (40–150 keV) emission from GRS 1758–258 was considerably lower and did not exceed the detection threshold in each individual session and for the sum of all observations of this series. The upper limit on the source flux was 14 mCrab (3 ; Cordier et al. 1991).
GRS 1758–258 was also below the detection limit during the subsequent series of observations in the Spring of 1992. A statistically significant flux from the source with a 3 upper limit of 9 mCrab cannot be detected even by combining the data for the Fall of 1991 and the Spring of 1992 (Gilfanov et al. 1993).
GRS 1758–258 was again detected during the following series of Galactic Center observation in the Fall of 1992 (see Fig.1) with a flux of 40 mCrab. Subsequent observations showed that the source intensity continued to vary several-fold on long time scales. The flux gradually increased from the Spring of 1992 through the Spring of 1994, when GRS 1758–258 was again at its maximum with a flux of 80 mCrab. During the next surveys in the Fall of 1994 and 1995 and in the Spring of 1996 and 1997, the flux was comparable to its mean value of 50 mCrab. The source brightness was again at a maximum in the Fall of 1997 – the flux reached 110 mCrab and was greater than its value in the previous series of observations in the Spring of 1997 by a factor of 3. The source also remained bright in the next two series ( 90 mCrab).
Note that smooth variations in the hard X-ray flux from GRS 1758–258 can be clearly traced on long time scales, while flux variations on time scales of several days are not always traceable. Variations in the source (40–150 keV) flux by several times on such a time scale (a few days) were reliably detected for the series of observations in February–April 1991, February–April 1993 and March 1996. It should be noted that the measurement error in the flux from GRS 1758–258 per observing session (a mean duration of h) is typically 25 mCrab at a typical flux from the source of 60 mCrab.
4 Spectral Variability
To search for spectral variability, we grouped all SIGMA observations of GRS 1758–258 in two ways:
-
1.
Grouping of the data in observational series to study possible spectral changes on long time scales.
-
2.
Grouping of the data in flux to search for a possible correlation between the spectral shape and the source flux.
4.1 Averaging over the Observational Series
To study the spectral properties of the source on long time scales, we grouped the data in observational series. The derived spectra were fitted by the following models: a power law (Table 1), bremsstrahlung of an optically thin plasma (Kellogg et al. 1975; Table 2), and a Comptonized disk (Sunyaev and Titarchuk 1980; Table 3). As can be seen from the values in Tables 1–3, the last two models fit the source spectrum considerably better than does the power law. This is undoubtedly attributable to a gradual steepening of the spectrum at energies above 100 keV. Both the bremsstrahlung model and the Comptonized disk model provide equally acceptable (in terms of the test) fits to the observed spectra. Note that for the assumed (in the standard theory of disk accretion) parameters of the region of X-ray generation (Shakura and Sunyaev 1973; Shapiro et al. 1976), the bremsstrahlung model may not be relevant. Nevertheless, we use this model as a simple analytic fit to the spectrum. The temperature in this model provides a convenient means of characterizing the spectral hardness by a single parameter.
Figure 2 shows a plot of spectral hardness versus time which we obtained by using the bremsstrahlung model. There are no hardness data for the observations in the Fall of 1991 and the Spring of 1992, because the flux from the source was below the SIGMA detection threshold during these periods (see above). Note that after the source was again detected in the Fall of 1992, no significant changes occurred in the source spectrum – the characteristic temperature of the bremsstrahlung spectrum was 130 keV.
We attempted to trace the possible change in spectral hardness as a function of hard X-ray luminosity in the band 40–200 keV by using the average spectra (Fig. 3). Figure 3 shows that as the luminosity changes from erg/s to erg/s (for an assumed distance to the source of 8.5 kpc), the hardness remains constant (within the error limits).
Thus, we found no reliable evidence for variations in the source spectral hardness from one observational series to another.
4.2 Grouping in Flux
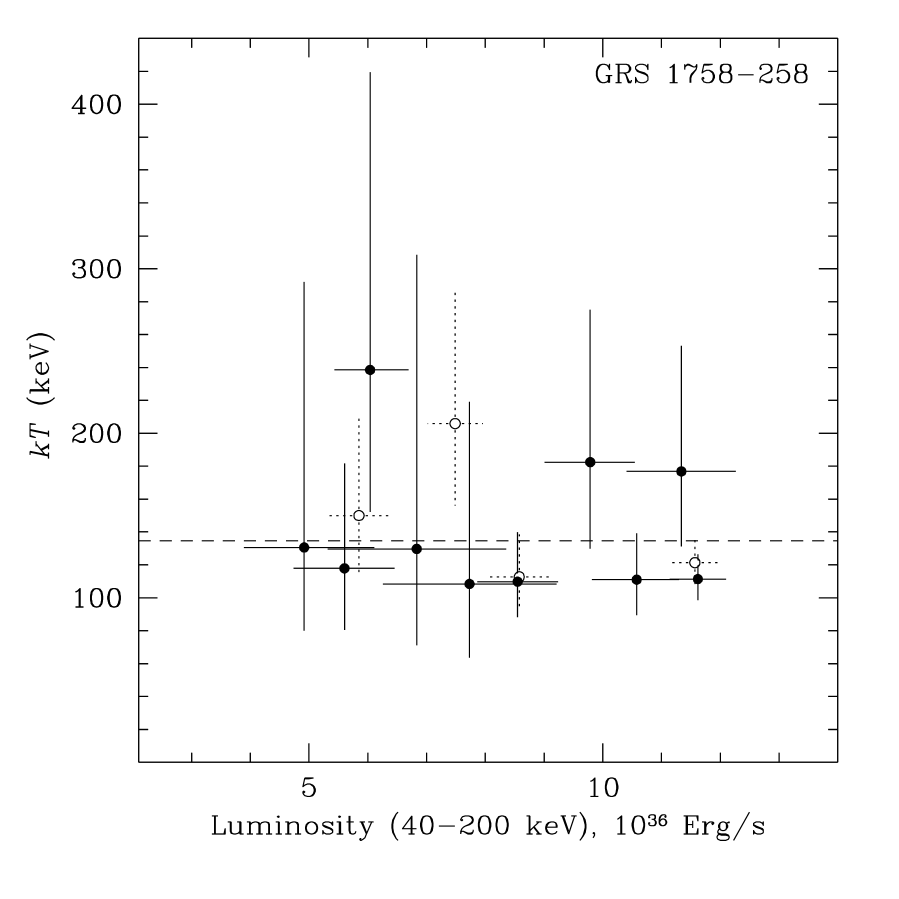
To search for spectral variability which correlates with variations in the source flux on time scales of days, we grouped the data in flux. A procedure similar to that described below was used to analyze the observations of Cygnus X-1 and 1E1740.7–2942 (Kuznetsov et al. 1997) and revealed a clear correlation between the flux and the spectral hardness. Since the statistical significance of the observations of GRS 1758–258 is lower, we cannot perform a detailed analysis of the flux-hardness correlation. For completeness, however, we carried out such an analysis.
The data were averaged as follows. The entire range of variations in the 40–150 keV flux observed in 1990–1997 was divided into several bins of equal width. Accordingly, all individual observing sessions (in which the source flux exceeded 1.4 counts sec-1 cm-2) were divided into groups; sessions in which the flux was in a given bin fell in each group. We then averaged the source spectra in each group of sessions.
As a result, we obtained average spectra of the source for various flux ranges. The average spectra were fitted by the model of bremsstrahlung of an optically thin plasma in the band 40–300 keV. For each spectrum, we determined the best-fit luminosity and hardness (). The data covered the luminosity range from erg/s to erg/s (for an assuming distance to the source of 8.5 kpc). The results are shown in Fig. 4. We see that the spectral hardness () is constant (within the error limits): the mean temperature of the bremsstrahlung spectrum is 130 keV. The previously found correlation “spectral hardness – hard X-ray luminosity” for Cygnus X–1 and 1E1740.7–2942 (Kuznetsov et al. 1997), which is indicated by the dashed line in Fig. 4, can be neither confirmed nor rejected with a sufficient statistical significance for GRS 1758–258.
5 Average Spectrum of the Source
The total exposure time for all SIGMA observations of the source in 1990–1997 was s (except for the observations since the Fall of 1997; see the footnote to Sec. 2). Assuming that the spectral shape did not change during this period, we averaged all the source spectrum that were obtained during the observations in 1990–1997. The average energy spectrum (40–300 keV) was fitted by the following models: a power law, a power law with an exponential cutoff at high energies, optically–thin thermal bremsstrahlung (Kellogg et al. 1975), and a Comptonized disk (Sunyaev & Titarchuk 1980). The results are given in Table 4 and shown in Fig. 5.
The average spectrum is well described by the models with a cutoff at high energies – the Comptonized disk model, a power law with an exponential cutoff, and the bremsstrahlung spectrum: d.o.f.= 43/43/44, respectively (see Table 4). As we see from Fig. 5, the spectrum can be accurately described by a power law only up to energies 100–200 keV. At higher energies, the spectrum steepens appreciably. Fitting of the spectrum by a power law in the band 40–300 keV gives a high value of 59.9 (per 44 d.o.f.).
Best-fit parameters for the spectrum of 1E1740.7–2942 which was averaged over the same set of observations are also given in Table 4. As can be seen from this table, the best-fit parameters for the spectra of 1E1740.7–2942 and GRS 1758–258 are in good agreement. The difference between the mean 40–200 keV luminosities is 20–25 % assuming the same distances to the sources).
6 Discussion
Thus, the observational data suggest that 1E1740.7–2942 and GRS 1758–258, the two brightest (at energies above 35 keV) sources within a few degrees of the Galactic Center, are similar. A total of six bright sources (1E1740.7–2942, GRS 1758–258, GX 1+4, GX 354–0, 4U 1722–30, SLX 1735–269) are clearly seen in the SIGMA image of this region in 1990–1998. Two of them, 1E1740.7–1942 and GRS 1758–258, clearly stand out by the following properties:
(1) the detection of coherent pulsations or X-ray outbursts from all other sources provides reliable evidence that the compact object is a neutron star;
(2) the spectral hardness of all other sources (which is defined as the ratio of 75–150 to 40–75 keV fluxes) is considerably lower than that for 1E1740.7–2942 and GRS 1758–258 (Goldwurm et al. 1994; Gilfanov et al. 1995; Churazov et al. 1997).
As was already noted above, these two properties suggest that 1E1740.7–2942 and GRS 1758–258 are black hole candidates. Most of the binaries that show dynamical evidence for a massive compact object – a black hole (apart from a low mass optical companion) are known to be X-ray transients. Such objects were actually observed by SIGMA in the Galactic Center region (for example, X-ray Nova Ophiuchi 1993 – GRS 1716–249; Revnivtsev et al. 1998), with their spectral hardness being comparable to that of GRS 1758–258 and 1E1740.7–2942. However, it is clear from the light curves of GRS 1758–258 and 1E1740.7–2942 that these two sources cannot be classified as classical X-ray transients, which are characterized by activity periods lasting for several months against the periods of quiescence (at least tens of years).
Among the other Galactic sources which exhibit fairly hard spectra and substantial variability on time scales of months and years, we can mention, for example, Cygnus X–1, GX 339–4, GRS 1915+105, and GRO J1655–40222The last two sources are classified as transients, although their X-ray activity has been observed for several years. Optical observations of GRS 1758–258 rule out the hypothesis of a very massive companion (Chen et al. 1994; Marti et al. 1998) similar to the O9.7 optical companion of Cygnus X–1. The interstellar absorption toward 1E1740.7–2942, (see, e.g., Chen et al. 1994), is so high that it precludes the possibility of placing stringent constraints on the optical companion.
Recent observations in and band (Marti et al. 1998) have revealed two sources within 1 arcsec of the central radio source which was identified with GRS 1758–258 (Rodriguez et al. 1992). In the near future, the optical companion of GRS 1758–258 will be firmly established, which will allow us to return the problem discussed above and to understand what differs this source from other X-ray transients.
In their recent papers, Van Paradijs et al. (1996), King et al. (1997a, 1997b) explain the “transient” behavior of most low mass binary systems with black holes by thermal instability of the accretion disk in the region of partial hydrogen ionization. This instability was successfully used to interpret the light curves of cataclysmic variables (e.g. Meyer and Meyer-Hofmeister 1981). Van Paradijs et al. (1996) point out that irradiation of the outer parts of the accretion disk by X-ray emission (Shakura and Sunyaev 1973; Lutyi and Sunyaev 1976) from the inner zone of main energy release may have a major effect on the development of this instability for low mass binaries (with a neutron star or a black hole). Provided that this irradiation is capable of raising the disk temperature above the hydrogen ionization temperature, the conditions for the generation of instability vanish and, as a consequence, the behavior of the accretion rate and the X-ray flux becomes more regular. In this model, the determining parameter that separates “transients” from “persistent” sources is the critical mass accretion rate at which the outer part of the disk is heated to a temperature of 6500K (which corresponds to the hydrogen ionization temperature). In turn, the radius of the outer disk boundary depends on the masses of the optical companion and the compact object and on the orbital period. King et al. (1997b) also note that a distinctive feature of neutron stars and black holes could be the difference in the geometry of the emitting region: for black holes, the radiation originates from the flat inner zone of the accretion disk, while for neutron stars, a point isotropic source is assumed a the location of the compact object (as a result, a more appreciable part of the X-ray flux can be absorbed by the outer parts of the accretion disk around the neutron star). As a result, a sizable fraction of the low mass binary systems with neutron stars turn out to be “persistent” sources, while most binary systems with black holes must show up as “transients”. Although this model requires further elaboration, it is of interest to consider the results of its application to GRS 1758–258 and 1E1740.7–2942. The light curves of GRS 1758–258 and 1E1740.7–2942 on long time scales suggest that the instability under consideration in these objects is suppressed. This implies that the observed X-ray luminosity (of the order of several erg/s at a distance of 8.5 kpc) heats up the outer parts of the disk above the hydrogen ionization temperature. Consequently, (Lutyi & Sunyaev 1976; Van Paradijs et al. 1996; King et al. 1997b)
| (1) |
where is the temperature at the outer disk boundary due to X-ray irradiation, is the source’s X-ray luminosity, is the disk half-thickness, is the disk albedo for X-ray emission, and is the radius of the outer disk boundary. We assume below that (see, e.g., King et al. 1997b), and (de Jong et al. 1996). Consequently,
| (2) |
where is the luminosity in units of erg/s. According to Eggleton (1983), the mean Roche-lobe radius (in our case, for the compact object)
| (3) |
can be determined with an accuracy higher than 1% in the interval (here, is the binary separation, is the mass ratio for the binary system, and and are measured in solar masses). Using Kepler’s third law and taking as the radius of the outer disk boundary, we can place the following constraint on the binary’s period:
| (4) |
where – period in hours.
Thus, the conditions for the suppression of instability in a close binary system with a black hole of mass and with a companion star of mass (the upper limit for GRS 1758–258; Chen et al. 1994) require that the period be shorter than h (). The assumption of a more massive black hole implies even shorter periods. Assuming additionally that the optical component is a main sequence star and that it fills its Roche lobe (assuming that ), we can obtain even more stringent constraints on the period and the mass of the companion star: h and ().
Of course, the above analysis has many significant (and not quite justified) simplifications and assumptions. Dubus et al. (1998) point out that due to the substantial optical depth of the disk, the temperature which is derived from formula (1) reflects only the surface temperature (as was shown by Lutyi and Sunyaev 1976) and cannot be directly used to analyze the degree of hydrogen ionization in the bulk of the disk. Moreover, the increase in the geometrical thickness of the disk at intermediate distances may result in the self-screening of the outer regions of the accretion disk. The results of Dubus et al. (1998) imply appreciably less stringent constraints on the binary’s period. Besides, the additional factor , which was used by King (1997a) to describe the “disk” geometry of the emitting region in accreting black holes, may not be applicable to 1E1740.7–2942 and GRS 1758–258, because the luminosity is dominated by the hard component that originates in an optically thin region. The true albedo () may differ significantly from its assumed empirical value, which is based on observations of low mass X-ray binaries (de Jong et al. 1996). It is, nevertheless, clear that by further analyzing the effect of irradiation of the outer parts of the accretion disk on the pattern of accretion, we can place important constraints on the parameters of binary systems.
Although we assumed above that GRS 1758–258 is not a transient, the source is undoubtedly variable. The SIGMA observations of GRS 1758–258 in 1990–1998 revealed variations in the hard X-ray flux from the source on time scales of about one year by more than a factor of 8. During the two successive series of observations in the Fall of 1991 and in the Spring of 1992, the source flux was below the telescope sensitivity threshold, mCrab. Assuming that the source flux was at a comparable level from September 1991 through April–May 1992, the total time during which the hard X-ray flux from GRS 1758–258 was low is 200 days. However, most of the time – 14 of the 16 observational series, i.e., – the source was in a state with a hard X-ray flux above 30–40 mCrab. A similar temporal behavior in the hard X-ray range is also observed in the other two Galactic black hole candidates: 1E1740.7–2942 and Cygnus X–1. As was already noted above, the luminosity, energy spectra, and the patterns of aperiodic variability on short time scales for these three sources are also very similar.
The extended episodes of low hard X-ray luminosity can be attributed (1) to the transition of the source to a high (soft) spectral state and (2) to the general decrease in luminosity over the entire X-ray range, which is caused, for example, by a decrease in the accretion rate. Note that in the former case, the decrease in the hard X-ray luminosity is attributable to the redistribution of emitted energy in frequency and reflects neither the sign nor the amplitude of variations in the accretion rate. Observations of other sources – black hole candidates – show that the transition to a high spectral state is probably caused by an increase in the accretion rate by a factor of .
The RXTE and ASCA observations show (see, e.g., Cui et al. 1997) that for Cygnus X–1, the extended episodes of low hard X-ray luminosity are attributable to the transition of the source to a high (soft) spectral state. For GRS 1758–258, the ROSAT/PSPC flux in March 1992 was half the measured flux in March 1993 (Grebenev et al. 1996), while the hard X-ray flux changed by at least a factor of [the 40–150 keV flux did not exceed 8 mCrab in the Spring of 1992 ( upper limit) and was mCrab in the Spring of 1993). This may provide evidence that, as in the case of Cygnus X–1, the extended episode of low hard X-ray luminosity is attributable at least partly to an appreciable softening of the source spectrum. At the same time, the decrease in the soft luminosity does not allow us to assert that the source was in the “classical” high (soft) state in March 1992, similar to that observed in Cygnus X–1.
Acknowledgments
This work was supported in part by the INTAS (grant no. 93–3363–ext) and the Russian Foundation for Basic Research (project no. 96–02–18588). S. Kuznetsov was also supported by the ISSEP grants nos. A97–2301 and A98–1602. We are grateful to S. Grebenev, A. King, U. Kolb, and H. Ritter for a discussion and valuable remarks.
References
Cordier B., Roques J.P., Churazov E., Gilfanov M., IAUC. 1991, No. 5377.
Chen W., Gehrels N., Leventhal M., ApJ, 1994, 426, 586.
Churazov E., Gilfanov M., Sunyaev R. et al., Adv. Space Res., 1997, 19, 61.
Cui W., Zhang S.N., Focke W., Swank J.H., ApJ, 1997, 484, 383.
de Jong J.A., Van Paradijs J., Augusteijn T., A&A, 1996, 314, 484.
Dubus G., Lasota J.P., Hameury J.M., Charle P., MNRAS, 1998, (in press).
Eggleton P., ApJ, 1983, 268, 368.
Gilfanov M., Churazov E., Sunyaev R., Khavenson N.,Novikov B., Dyachkov A., Kremnev R., Sukhanov K., Bouchet L., Mandrou P.,Roques J.P., Vedrenne G., Cordier B., Goldwurm A., Laurent P., Paul J., ApJ, 1993, 418, 844.
Gilfanov M., Churazov E., Sunyaev R., Vikhlinin A.,Finoguenov A., Sitdikov A., Dyachkov A., Khavensov N., Laurent P., Ballet J.,Claret A.,Goldwurm A., Roques J.P., Mandrou P., Niel M., Vedrenne G., Lives of the the Neutron Stars. NATO ASI Ser. (ed. Alpar M.,Kiziloǧlu Ü., Van Paradijs J.), Dordrecht: Kluwer Acad. Publ., 1995, 450, 712.
Grebenev A., Pavlinsky M., Sunyaev R., The Transparent Universe, 2nd Integral Workshop (ed. Winkler C., Courvoisier T., Durouchoux P., Kaldeich-Schürmann B.) Noordwijk: ESA Publ. Div. ESTEC, 1997, 382, 183.
Goldwurm A., Cordier B., Paul J., Ballet J., Bouchet L., Roques J.P., Vedrenne G., Mandrou P., Sunyaev R., Churazov E., Gilfanov M., Finoguenov A., Vikhlinin A., Dyachkov A., Khavenson N., Kovtunenko V., Nature, 1994, 371, 589.
Kelloggg E., Baldwin J., Koch D., ApJ, 1975, 199, 299.
King A., Frank J., Kolb U., Ritter H., ApJ, 1997a, 484, 844.
King A., Kolb U., Szuszkiewicz E., ApJ, 1997b, 488, 89.
Kuznetsov S., Gilfanov M., Churazov E., Sunyaev R.,Korel I., Khavenson N., Dyachkov A., Chulkov I., Ballet J., Laurent P., Vargas M., Goldwurm A., Roques J.P., Jourdain E., Bouchet L., Borrel V., MNRAS, 1997, 292, 651.
Lutyj V., Sunyaev R., Astronomicheskij zhurnal, 1976, 53, 511.
Marti J., Mereghetti S., Chaty S., Mirabel I., Goldoni P., Rodriguez L., A&A, 1998, 338, L95.
Mereghetti S., Caraveo P., Bignami G.F., Belloni T., A&A, 1992, 259, 205.
Mereghetti S., Belloni T., Goldwurm A., ApJ, 1994, 433, L21.
Meyer F., Meyer-Hofmeister E., A&A, 1981, 104, 10.
Mirabel F., Rodriguez L.F., Cordier B., Paul J., Lebrun F., Nature, 1992, 358, 215.
Mirabel F., Rodriguez L.F., Cordier B., Paul J., Lebrun F., A&ASS, 1993, 97, 193.
Miyamoto S., Kitamoto, S., Mitsuda K., Dotani, T., ApJ, 1992, 391, L21.
Paul J., Ballet J., Cantin M., Cordier B., Goldwurm A.,Lambert A., Mandrou P., Chabaud J.P., Ehanno M., Lande J., Adv. Space Res., 1991, 11, 289.
Revnivtsev M., Gilfanov M., Churazov E., Sunyaev R.,Borozdin K., Aleksandrovich N., Khavenson N., Chulkov I., Goldwurm A., Ballet J., Denis M., Laurent P., Roques J.P., Borrel V., Bouchet L., Jourdain E., A&A, 1998, 331, 557.
Rodriguez L.F., Mirabel I.F., Marti J., ApJ, 1992, 401, L15.
Shakura N.I., Sunyaev R.A, A&A, 1973, 24, 337.
Shapiro S., Lightman A., Eardley D., ApJ, 1976, 204, 187.
Smith D.M., Heindl W.A., Swank J., Leventhal M., MirabelI., Rodriguez L., ApJ, 1997, 489, L51.
Sunyaev R.A., Titarchuk L.G., A&A, 1980, 86, 121.
Sunyaev R.A., Gilfanov M.R., Churazov E.M., Pavlinsky M.N., Babalyan G., Dekhanov I., Kuznetsov A., Grebenev S., Yunin S., Yamburenko N., Cordier B., Lebrun F., Laurent P., Ballet J., Mandrou P., Roques J.-P., Vedrenne G., Boucher L., Astron. Lett., 1991, 17, 116.
Van Paradijs J., ApJ,1996, 464, 139.
| Date of observations | Photon index () | Luminosity, | (d.o.f.) |
|---|---|---|---|
| (40–200 keV)aa Erg s-1. | |||
| 1990 | |||
| Spring | 11.2 | 29.8(44) | |
| Fall | 11.6 | 44.0(44) | |
| Mean | 11.5 | 37.9(44) | |
| 1991 | |||
| Spring | 8.6 | 50.1(44) | |
| 1992 | |||
| Fall | 4.8 | 49.9(44) | |
| 1993 | |||
| Spring | 5.9 | 58.7(44) | |
| Fall | 9.7 | 45.3(44) | |
| Mean | 7.4 | 37.5(44) | |
| 1994 | |||
| Spring | 10.6 | 48.9(44) | |
| Fall | 5.5 | 45.0(44) | |
| Mean | 8.6 | 51.3(44) | |
| 1995 | |||
| Fall | 7.8 | 43.7(44) | |
| 1996 | |||
| Spring | 6.7 | 55.0(44) | |
| Date of observations | Temperature (), | Luminosity, | (d.o.f.) |
|---|---|---|---|
| keV | (40–200 keV)aa Erg s-1. | ||
| 1990 | |||
| Spring | 11.3 | 28.4(44) | |
| Fall | 11.6 | 40.5(44) | |
| Mean | 11.6 | 32.8(44) | |
| 1991 | |||
| Spring | 8.6 | 46.6(44) | |
| 1992 | |||
| Fall | 4.9 | 48.7(44) | |
| 1993 | |||
| Spring | 6.0 | 59.1(44) | |
| Fall | 9.8 | 47.9(44) | |
| Mean | 7.5 | 39.9(44) | |
| 1994 | |||
| Spring | 10.6 | 49.2(44) | |
| Fall | 5.6 | 42.3(44) | |
| Mean | 8.6 | 47.4(44) | |
| 1995 | |||
| Fall | 7.7 | 43.9(44) | |
| 1996 | |||
| Spring | 6.8 | 54.6(44) | |
| Date of observations | Temperature (), | Optical | Luminosity, | (d.o.f.) |
|---|---|---|---|---|
| keV | depth () | (40–200 keV)aa Erg s-1. | ||
| 1990 | ||||
| Spring | 11.4 | 28.4(43) | ||
| Fall | 11.7 | 40.4(43) | ||
| Mean | 1.0 | 11.6 | 32.9(43) | |
| 1991 | ||||
| Spring | 8.4 | 45.7(43) | ||
| 1992 | ||||
| Fall | 5.5 | 47.2(43) | ||
| 1993 | ||||
| Spring | 6.1 | 58.6(43) | ||
| Fall | 9.8 | 45.6(43) | ||
| Mean | 7.4 | 37.6(43) | ||
| 1994 | ||||
| Spring | 10.7 | 48.6(43) | ||
| Fall | 5.6 | 39.0(43) | ||
| Mean | 8.6 | 46.7(43) | ||
| 1995 | ||||
| Fall | 7.8 | 43.7(43) | ||
| 1996 | ||||
| Spring | 7.7 | 54.4(43) | ||
| Parameter | GRS 1758–258 | 1E1740.7–2942 |
|---|---|---|
| Power-law | ||
| Slope () | ||
| Luminosity (40–200 keV)aa Erg s-1. | ||
| (d.o.f.) | 59.9(44) | 70.1(44) |
| Power-law with high energy exponential cutoff | ||
| Slope () | ||
| cutoff energy (keV) | ||
| Luminosity (40–200 keV)aa Erg s-1. | ||
| (d.o.f.) | 45.1(43) | 40.1(43) |
| Optically-thin thermal bremsstrahlungbb Kellogg et al. (1975) | ||
| Temperature, keV | ||
| Luminosity (40–200 keV)aa Erg s-1. | ||
| (d.o.f.) | 46.0(44) | 40.9(44) |
| Comptonized disc modelcc Sunyaev, Titarchuk (1980) | ||
| Temperature, keV | ||
| Optical depth () | ||
| Luminosity (40–200 keV)aa Erg s-1. | ||
| (d.o.f.) | 44.9(43) | 43.2(43) |