The ROSAT Wide Field Camera Extragalactic Survey
Abstract
We report the results of a new analysis of the ROSAT Wide Field Camera (WFC) all-sky survey data, designed to detect extragalactic sources of extreme ultraviolet (EUV) radiation in regions of low Galactic . We identify a total of 19 active galactic nuclei (AGN), more than double the number of confirmed AGN in the published WFC (2RE) survey. Our sample contains 8 narrow-line Seyfert 1 galaxies, making this the first reasonably-sized, complete sample of these extreme AGN, along with 6 broad-line Seyfert 1s and 5 BL Lacertae objects. These EUV-selected sources typically have steep soft X-ray spectra with a mean power-law energy index . The derived AGN luminosity function is rather flat and appears to cut off above a luminosity of erg/s/keV, measured monochromatically at 200 eV. Narrow-line Seyfert 1s account for roughly half of the local () volume emissivity in the EUV band.
keywords:
databases: surveys – galaxies: active – galaxies: BL Lacertae objects: general – galaxies: Seyfert: general – ultraviolet: galaxies – X-ray: galaxies1 Introduction
It is becoming increasingly clear that the extreme ultraviolet (EUV) regime can provide unique insight into the phenomenon of active galactic nuclei (AGN). Consider, for instance, the emerging subclass of AGN known as narrow-line Seyfert 1 galaxies (NLS1s). The extreme properties of NLS1s have prompted comparison with Galactic black hole candidates in their high states (Pounds, Done & Osborne 1995) leading to the suggestion that they may represent a class of AGN in which accretion (onto a supermassive black hole) proceeds at a rate close to the Eddington limit (Ross, Fabian & Mineshige 1992). These objects were first identified (Osterbrock & Pogge 1985; Goodrich 1989) by virtue of the fact that their optical permitted lines are much narrower (H FWHM km/s) than in “normal” broad-line Seyfert 1 galaxies (BLS1s). However, more recently, largely on the basis of ROSAT observations, NLS1s have also been shown to exhibit extremely soft X-ray spectra and to be highly variable in the soft X-ray band (Boller, Brandt & Fink 1996). This, in turn, suggests that an excellent way to construct a representative sample of NLS1 objects might be via EUV-selection.
Unfortunately, the difficulties of working in at EUV wavelengths have until now prevented the definition of complete and unbiased samples of EUV-bright extragalactic sources. These difficulties include the relative insensitivity of instruments flown to date compounded by the fact that most lines of sight to the extragalactic Universe are opaque in the EUV due to photoelectric absorption in the interstellar medium of our Galaxy.
During 1990, ROSAT performed an all-sky survey in both the soft X-ray (0.1–2.4 keV) and EUV (60–210 eV) bands. The former employed the ROSAT X-ray telescope and position sensitive detector (PSPC; Trümper et al. 1991) and the latter the coaligned UK Wide Field Camera (WFC; Sims et al. 1990). The result has been the publication of the ROSAT Bright Source Catalogue (RBSC; Voges et al. 1996) and the WFC RE and 2RE catalogues (Pounds et al. 1993; Pye et al. 1995). Here we utilize the WFC all-sky survey database to produce the first reasonably large and complete sample of EUV-selected extragalactic objects, all of which are identified as AGN.
The remainder of this paper is organised as follows. We first discuss the selection criteria used to define a preliminary list of EUV-selected sources and then describe how this sample divides into AGN and Galactic stellar sub-populations. Next we consider the properties of the EUV-bright AGN including a comparison with a hard X-ray selected AGN sample. In § 4 we derive an approximate luminosity function for EUV-selected AGN and calculate the local volume emissivity of such sources. Finally, in § 5, we briefly summarise our results and consider possible future extensions of this work.
2 The Source Catalogue
The selection criteria we have used in order to include a source in our
preliminary source list is as follows:
(1) A WFC all-sky survey S1 band (90–210 eV; 60–140 Å) detection at
;
(2) An S2 band (60–110 eV; 110–210 Å) null detection;
(3) A coincident strong RBSC X-ray detection (0.1–2.4 keV count rate
0.3 ct/sec) within 100′′ of the S1 position;
(4) A value of the foreground Galactic column density in the direction of
the source of cm-2 (Dickey & Lockman
1990).
Criterion (3) allows the current survey to go more than a factor of 2 below the 5.5 WFC 2RE survey limit (Pye et al. 1995), since the requirement for both an S1 and soft X-ray detection limits the number chance coincidences in the sample to much less than one. Criteria (2) and (4) select against Galactic sources, since there is no reasonable expectation of extragalactic sources being detectable in the S2 band anywhere in the sky or in the S1 band if the Galactic column is too high. For example, in the S2 band, even for the lowest-column source in the sample (which has cm-2), , corresponding to a fractional transmission of only 2.6%. For comparison the transmission in the S1 band is 16% for this same source. However, at the survey limit of , even the S1 transmission has declined to 0.6%. Clearly only the brightest extragalactic sources would be able to be detected in the presence of such strong attenuation.
A total of 34 WFC sources were found to satisfy the above criteria. For this preliminary sample of EUV sources, SIMBAD and other catalogues were searched for potential optical counterparts. This process proved efficient in that all but one of the sources (RX J0437–47; see § 2.2.) were identified in this fashion. The sample is now fully identified and comprises 19 extragalactic and 15 Galactic sources. Details of these sources are presented below.
2.1 The Extragalactic Sources
Table 1 contains a compilation of the ROSAT data for the extragalactic sample as detailed in the table footnote. Note that the two hardness ratios and apply to the full PSPC band and the hard PSPC band respectively (i.e., and where is the 0.1–0.4 keV count rate, the 0.5–2 keV count rate, the 0.5–0.9 keV count rate, and the 0.9–2 keV count rate). Also we quote the RBSC positions in preference to the WFC positions since the former are more accurate (the X-ray telescope has better spatial resolution and typically records at least 10 times more counts than the WFC).
| S1 | S2 | RBSC | R.A. | Dec. | Offset | ||||
| Name | (ct/ks) | (ct/ks) | (ct/s) | HR1 | HR2 | (J2000) | (J2000) | (′′) | |
|---|---|---|---|---|---|---|---|---|---|
| (1) | (2) | (3) | (4) | (5) | (6) | (7) | (8) | (9) | (10) |
| WPVS 7 | 23 | 15 | 0.96 | — | –4.8 | 00 39 15.6 | –51 17 01 | 47 | |
| LB 1727 | 10 | 4 | 4.56 | –2.5 | 04 26 01.6 | –51 12 01 | 34 | ||
| RX J0437–47 | 19 | 22 | 0.85 | –2.5 | 04 37 26.6 | –47 11 18 | 60 | ||
| GB 1011+49 | 12 | 4 | 1.94 | –1.2 | 10 15 04.3 | 49 26 04 | 38 | ||
| 1ES 1028+511 | 14 | 8 | 4.46 | –1.2 | 10 31 18.6 | 50 53 40 | 21 | ||
| RE J1034+39 | 23 | 16 | 2.66 | –2.0 | 10 34 38.7 | 39 38 34 | 31 | ||
| EXO 1055+60 | 13 | 11 | 0.39 | –2.0 | 10 58 30.1 | 60 16 02 | 37 | ||
| Mkn 421 | 85 | 16 | 26.60 | –1.2 | 11 04 27.1 | 38 12 31 | 43 | ||
| IC 3599 | 17 | 5 | 5.10 | –1.9 | 12 37 41.4 | 26 42 29 | 96 | ||
| IRAS 1334+243 | 15 | 7 | 2.53 | –2.0 | 13 37 18.8 | 24 23 06 | 41 | ||
| PG 1415+451 | 8 | 8 | 0.50 | –2.0 | 14 17 00.5 | 44 55 56 | 34 | ||
| NGC 5548 | 12 | 5 | 4.95 | –1.3 | 14 17 59.6 | 25 08 17 | 50 | ||
| 1H 1430+423 | 18 | 12 | 4.20 | –2.0 | 14 28 32.0 | 42 40 28 | 69 | ||
| Mkn 478 | 66 | 18 | 5.78 | –2.0 | 14 42 07.7 | 35 26 32 | 35 | ||
| RX J1618+36 | 10 | 9 | 0.85 | –1.6 | 16 18 09.2 | 36 19 50 | 93 | ||
| RX J1629+40 | 12 | 7 | 0.78 | –2.3 | 16 29 01.2 | 40 07 53 | 29 | ||
| PKS 2155–304 | 180 | 17 | 36.20 | –1.8 | 21 58 52.2 | –30 13 37 | 11 | ||
| NGC 7213 | 12 | 4 | 3.94 | –0.9 | 22 09 16.6 | –47 10 02 | 21 | ||
| RE J2248–51 | 18 | 10 | 2.24 | –2.2 | 22 48 41.4 | –51 09 51 | 26 |
The columns provide the following information: (1) the source name; (2) the WFC S1 count rate and 1 error; (3) the 2.5 upper limit on the WFC S2 count rate; (4) the RBSC 0.1–2.4 keV count rate; (5) and (6) the and hardness ratios; (7) the X-ray spectral index, (see § 3.3); (8) and (9) the right ascension and declination (J2000) as tabulated in the RBSC; (10) the difference between the RBSC and WFC positions in arcsec.
Information from other wavebands is presented in Table 2: column 3 gives the Galactic value of derived from the survey of Dickey & Lockman (1990), columns 4–6 give the V-band optical magnitude, redshift and H line width, as reported in the optical observations referenced in column 9. Columns 7 and 8 give the monochromatic luminosity at 200 eV () and optical/EUV spectral slope, , as derived in § 4. and § 3.3., respectively.
| V-band | H FWHM | log(L200) | ||||||
| Name | Type | (1020 cm-2) | Magnitude | Redshift | (km/s) | (erg/s/keV) | Reference | |
| (1) | (2) | (3) | (4) | (5) | (6) | (7) | (8) | (9) |
| WPVS 7 | NLS1 | 2.5 | 14.8 | 0.029 | 1200 | 45.31 | –0.66 | 1 |
| LB 1727 | BLS1 | 2.0 | 14.3 | 0.103 | 3460 | 45.78 | –1.10 | 2 |
| RX J0437–47 | BLS1 | 1.8 | 15.3 | 0.050 | 4600 | 45.23 | –0.82 | 3 |
| GB 1011+49 | BL Lac | 0.8 | 16.1 | 0.200 | — | 45.56 | –1.16 | 4 |
| 1ES 1028+511 | BL Lac | 1.2 | 17.0 | 0.361 | — | 46.55 | –0.76 | 5 |
| RE J1034+39 | NLS1 | 1.0 | 15.6 | 0.042 | 1500 | 44.59 | –1.03 | 6 |
| EXO 1055+60 | NLS1 | 0.6 | 17.3 | 0.149 | 2030 | 45.10 | –1.01 | 1 |
| Mkn 421 | BL Lac | 1.4 | 13.5 | 0.030 | — | 45.19 | –1.00 | 7 |
| IC 3599 | NLS1 | 1.3 | 16.5 | 0.020 | 1200 | 44.06 | –0.79 | 8 |
| IRAS 1334+243 | NLS1 | 1.2 | 15.0 | 0.107 | 2100 | 45.41 | –1.16 | 9 |
| PG 1415+451 | BLS1 | 1.2 | 15.7 | 0.114 | 2620 | 45.20 | –1.16 | 10 |
| NGC 5548 | BLS1 | 1.7 | 13.1 | 0.017 | 5900 | 44.06 | –1.41 | 11 |
| 1H 1430+423 | BL Lac | 1.4 | 16.4 | 0.129 | — | 45.82 | –0.75 | 12 |
| Mkn 478 | NLS1 | 1.0 | 14.5 | 0.077 | 1400 | 45.59 | –1.02 | 13 |
| RX J1618+36 | NLS1 | 1.3 | 16.8 | 0.034 | 840 | 44.29 | –0.84 | 1 |
| RX J1629+40 | NLS1 | 0.9 | 19.0 | 0.272 | 1500 | 43.83 | –0.53 | 14 |
| PKS 2155–304 | BL Lac | 1.7 | 13.0 | 0.116 | — | 46.94 | –0.83 | 15 |
| NGC 7213 | BLS1 | 2.1 | 10.5 | 0.006 | 3200 | 43.41 | –1.81 | 1 |
| RE J2248–51 | BLS1 | 1.4 | 15.0 | 0.102 | 2630 | 45.61 | –1.04 | 1 |
REFERENCES: (1) Grupe (1996). (2) Guainazzi et al. (1998). (3) This paper. (4) Puchnarewicz et al. (1992). (5) Polomski et al. (1997). (6) Puchnarewicz et al. (1995). (7) Miller (1975). (8) Brandt, Pounds & Fink (1995). (9) Wills et al. (1992). (10) Boroson & Green (1992). (11) Osterbrock (1977). (12) Sambruna et al. (1997). (13) Gondhalekar et al. (1994). (14) Bade et al. (1995). (15) Falamo, Pesce & Treves (1993).
Since the EUV and soft X-ray data in Table 1 were gathered from a single mission at the same time, correlations and colours measured from them are reliable. However, many of the data in Table 2 were taken from a variety of non-simultaneous measurements, and thus any ratios involving these quantities (e.g., ) may be influenced by any temporal variability of the source.
2.2 Notes on Individual Sources
WPVS 7: With , this NLS1 is the softest AGN in the sample. There are almost no counts in bands and , so the hardness ratio is not well-determined. The foreground HI column is comparatively high at cm-2 and, after correcting for the Galactic transmission, this is the brightest Seyfert galaxy in the sample (in terms of its incident flux). WPVS 7 appears to be a transient source, as subsequent pointed ROSAT observations show that its X-ray flux dropped by a factor of 400 with respect to the survey measurement, the largest such variation seen for any Seyfert 1 galaxy (Grupe et al. 1995).
LB 1727: The WFC 2RE catalogue reports the detection of an EUV source identified with the Seyfert 1 galaxy LB 1727 (1H 0419–577) but at a position over 3′ offset from the optical counterpart and a corresponding RBSC detection. A close examination of the WFC data for this field reveals that the 2RE source is a fact a blend of two sources of roughly equal brightness in the S1 band. These two sources are clearly resolved in pointed EUVE and ROSAT HRI observations and have been identified respectively with the Seyfert galaxy LB 1727 (Guainazzi et al. 1998; Turner et al. 1999) and an AM Her star EUVE J0425.6–5714 (Halpern et al. 1998). When the effects of the source confusion are taken into account, the WFC source associated with LB 1727 meets all the criteria defined in §2 and hence we include it in our sample.
RX J0437–47: This was the only source in the sample without a published optical spectrum. Low-resolution optical spectra were therefore acquired from the 3.9m Anglo-Australian Telescope using the RGO and FORS spectrographs, with total integration times of 1000 and 900 sec respectively, in 2′′ seeing conditions. The combined, flux-calibrated spectrum, shown in Figure 1, is that of a Seyfert 1 galaxy at a redshift of . The Balmer lines are clearly broad, with H FWHM = 4600 km/s, so we classify this source as a BLS1.

IC 3599: This is another highly transient source, with later pointed ROSAT observations giving a flux 100 times lower than at the time of the all-sky survey. A recent optical spectrum most closely resembles that of an extragalactic HII region, but at the time of the survey this source clearly had the appearance of a NLS1 (Brandt, Pounds & Fink 1995) and that classification is adopted herein.
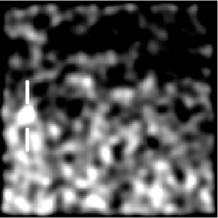
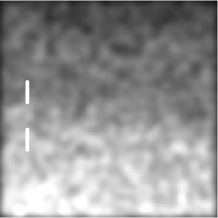
1H 1430+423: This AGN is listed as an S1 and S2 detection in the WFC 2RE survey (Pye et al. 1995) but only as an S1 detection in the original WFC RE survey (Pounds et al. 1993). Our own inspection of the relevant WFC survey image confirms that any detection in the S2 band is at best very marginal (see Figure 2). The S2 detection in the 2RE processing appears to be a result of confusion with the high background signal in this field. Since this source is clearly of extragalactic origin, and notwithstanding selection criterion (2) above, we have included it in our sample.
2.3 The Galactic Sources
For completeness, the Galactic sources selected by the criteria defined at the start of this section are listed in Table 3. Columns 1 and 2 give the source name and classification, columns 3–10 give the same quantities as in Table 1, and column 11 gives the value of derived from Dickey & Lockman (1990). The identifications encompass 11 late-type stars, two cataclysmic variables (CV), a low-mass X-ray binary (XRB), and a globular cluster (GC). We believe that it is very unlikely that this list harbours any unrecognized extragalactic sources.
| S1 | S2 | RBSC | R.A. | Dec | Offset | |||||
| Name | Type | (ct/ks) | (ct/ks) | (ct/s) | (J2000) | (J2000) | (′′) | (1020 cm | ||
| (1) | (2) | (3) | (4) | (5) | (6) | (7) | (8) | (9) | (10) | (11) |
| V777 Tau | F0 | 13 | 17 | 0.56 | –0.03 | 0.26 | 04 26 16.9 | –37 57 30 | 47 | 2.0 |
| H 0449–55 | F5 | 41 | 30 | 1.08 | –0.20 | 0.12 | 04 53 30.2 | –55 51 28 | 8 | 2.1 |
| HD 77407 | G0 | 30 | 52 | 0.66 | –0.21 | 0.01 | 09 03 26.8 | 37 50 32 | 90 | 2.4 |
| DK Leo | K7 | 17 | 14 | 0.51 | –0.38 | –0.02 | 10 14 19.3 | 21 04 37 | 43 | 2.4 |
| EK UMa | CV | 33 | 13 | 1.11 | –0.99 | –1.00 | 10 51 35.3 | 54 04 37 | 52 | 1.0 |
| CW UMa | M4 | 20 | 9 | 0.37 | –0.21 | –0.20 | 11 11 51.8 | 33 32 13 | 39 | 2.1 |
| HD 108102 | F8 | 19 | 17 | 0.60 | –0.06 | –0.09 | 12 25 01.8 | 25 33 41 | 10 | 1.8 |
| SAO 632275 | G6 | 10 | 13 | 0.39 | –0.23 | 0.13 | 12 58 34.7 | 38 16 41 | 20 | 1.4 |
| GP Com | CV | 17 | 7 | 0.54 | 0.12 | 0.39 | 13 05 42.7 | 18 00 56 | 45 | 2.1 |
| HD 114378 | F5 | 17 | 29 | 0.88 | –0.38 | –0.21 | 13 09 59.3 | 17 31 36 | 32 | 1.9 |
| NGC 5272 | GC | 11 | 10 | 0.57 | –0.95 | –0.12 | 13 42 10.2 | 28 22 50 | 56 | 1.2 |
| AG +19 1315 | K0 | 11 | 10 | 0.55 | 0.03 | 0.41 | 14 01 58.2 | 19 25 39 | 57 | 2.4 |
| HD 131511 | K2 | 12 | 15 | 0.36 | –0.48 | –0.29 | 14 53 24.3 | 19 09 15 | 65 | 2.5 |
| Her X-1 | XRB | 93 | 14 | 18.80 | –0.37 | 0.11 | 16 57 49.6 | 35 20 33 | 33 | 1.8 |
| HD 208496 | F3 | 16 | 37 | 0.54 | –0.04 | –0.31 | 21 58 31.6 | –59 00 43 | 33 | 2.1 |
3 The Extragalactic Sample of EUV-Selected Sources
3.1 Completeness of the Sample
The completeness of the sample has been checked using the test of Schmidt (1968). Here represents the total volume of space out to the distance at which the source flux would drop below the survey limit. Likewise, is the volume of space surveyed out to the actual distance of the object. For a complete sample of objects, uniformly distributed in Euclidean space, the expectation value of , is 0.5 with a formal 1 error of , where is the number of objects in the sample (Avni & Bahcall 1980).
Although in practice our catalogue was selected on the basis of a significance threshold (i.e. in the S1 band), here we make the assumption that our set of sources represents a count rate limited sample with a threshold (at ) of 10 S1 ct/ksec111PG 1415+451 has a measured S1 count rate that is actually below our nominal survey limit. In this one case we simply set .. For the extragalactic sample we then obtain , implying that the above choice of count rate threshold is a reasonable one. The application of a K-S test to the distribution of the values then gives (Avni & Bahcall 1980). On this basis we conclude that the sample shows no clear evidence for either strong evolution or incompleteness.
3.2 Comparison with Previous EUV Studies
In total eight extragalactic sources (three NLS1 galaxies, two BLS1s and three BL Lac objects) are listed in the ROSAT WFC 2RE catalogue222A ninth extragalactic source, the normal galaxy NGC 4787, was listed in the WFC 2RE catalogue. This identification is almost certainly spurious as the WFC source is detected only in the S2 band.. The 2RE catalogue employed a combined S1+S2 significance limit of , where , and and are the significances of the detections in the two WFC filters. Since AGN are very unlikely to be detected in the S2 band, the 2RE survey was not optimized to find such sources. As noted earlier, our approach here has been to search much more deeply in the S1 band (i.e., to ), whilst guarding against spurious detections by requiring a simultaneous detection in the soft X-ray band (at a level well above the threshold of the RBSC). The resulting sample of extragalactic sources, all of which are identified as AGN, is more than twice the size of that derived from 2RE catalogue.
The Extreme Ultraviolet Explorer (EUVE) has also conducted an extensive all-sky survey at EUV energies (Bowyer & Malina 1991). Using EUVE survey data, Marshall, Fruscione & Carone (1995) compiled a list of 13 extragalactic sources detected by EUVE at , eight of which appear in the current WFC sample. However, that study cross-correlated the EUVE data with catalogues of previously-known AGN. Since few NLS1s were known at that time, it is no surprise that this sample contains only three NLS1s (representing 25% of the total, compared to almost 50% in our current sample). One can therefore conclude that the EUVE sample is probably incomplete and biased against NLS1s. A low-significance survey by Fruscione (1996) and Craig & Fruscione (1997) resulted in a large number of potential EUV detections of extragalactic sources. However, as recognised by the authors, a rather high fraction of these EUV sources may be spurious and even the bona fide EUV detections may represent chance coincidences with AGN (in the relatively large EUVE error circles) or arise due to the hard leak in the EUVE filters. The smaller error circles, the S2 discriminant and the sharper filter cutoff are all advantages of the WFC survey compared to that carried out by EUVE, at least in the narrow context of defining a complete EUV-selected sample of AGN. It must be emphasized that all of the identifications in the current WFC survey are very likely to be solid and secure.
3.3 Comparison with a Hard X-ray Selected Sample
It is interesting to compare the properties of our sample of sources selected in EUV band with those of a sample of AGN selected at much harder X-ray energies. For this purpose, we use the well-studied set of AGN derived from the 2–10 keV HEAO-1 A2 survey (Piccinotti et al. 1982). Table 4 compares certain properties of the WFC and HEAO-1 A2 samples. Clearly there is quite a striking difference in the make-up of the AGN population as one moves up roughly a factor of 25 in energy. The HEAO-1 A2 sample is dominated by BLS1s, and contains four narrow emission-line and Seyfert 2 galaxies, but no NLS1s. By comparison, almost half of the AGN in the EUV-selected WFC sample are NLS1s, which also contains a significantly higher proportion of BL Lacs, but no Seyfert 2s. This is yet another example of the relationship between optical emission line width and EUV/X-ray spectral properties. The WFC objects are optically fainter and typically are at higher redshift than the HEAO-1 A2 sources. Since the EUV sample is selected from a smaller region of sky (effectively 31 square degrees; see § 4), it is not unexpected that it is necessary to search to greater distances (and fainter magnitudes) in order to find comparable numbers of sources in the EUV band as contained in the HEAO-1 A2 sample.
| WFC | HEAO-1 A2 | |
| NLS1 | 8 (42%) | 0 (0%) |
|---|---|---|
| BLS1/quasar | 6 (32%) | 27(78%) |
| Seyfert 2/NELG | 0 (0%) | 4 (11%) |
| BL Lac | 5 (26%) | 4 (11%) |
| Total | 19 (100%) | 35 (100%) |
| 0.079 | 0.035 | |
| Median redshift | 0.050 | 0.019 |
| –0.52 | +0.47 | |
| –0.02 | +0.28 | |
| 15.2 | 13.5 |
As noted earlier, the RBSC provides two measures of spectral hardness covering the 0.1–2.0 keV band, namely the ratios and . Figure 3 shows a plot of versus , for both our EUV-selected sample and the HEAO-1 A2 sources. There is evidence of a correlation, indicating that sources that are characterized by a significant flux in the 0.1–0.4 keV band (i.e., ) also have rather steep spectra in the adjacent 0.5–2.0 keV band (), and vice-versa. There is very little overlap in between the two samples, even though neither explicitly used any colour selection criteria. Again, this emphasizes how selection in the hard X-ray and EUV bands finds very different types of objects.

3.4 The Spectral Form of the Sources
For each WFC source, we have measurements available in four spectral channels, namely the WFC S1 band count rate and soft X-ray count rates measured by the ROSAT PSPC in the , and bands (derived in an approximate way from the broad band, 0.1–2.4 keV count rate tabulated in the RBSC and the corresponding and hardness ratios; see § 2.1). We have employed the spectral fitting package xspec v10.0 to model these four channel data in terms of a simple power-law continuum with absorption corresponding to the foreground Galactic . The energy spectral index, (defined as ), derived for each source is tabulated in Table 1.
In practice, the simple spectral model detailed above gave an unacceptable minimum for six of the sources. However, when the constraints on the value were relaxed, in each case a much better (and acceptable) fit was obtained. Interestingly all of these sources required an in excess of the Galactic value in order to improve the fit (typically by an amount ). Three of these sources are BL Lac objects and it is possible to invoke spectral curvature (downwards below keV) as the cause of the discrepancy. The other sources are IC 3599 and RE J1034+39, both of which are NLS1s, and LB 1727, a BLS1 galaxy. More detailed spectral fitting of IC 3599 (Brandt et al. 1995), RE J1034+39 (Pounds et al. 1995) and LB 1727 (Turner et al. 1999) is consistent with additional or a relatively complex spectral form in these objects. Of course, the assumed value for the Galactic (based on the broad-beam 21 cm measurements compiled by Dickey & Lockman 1990) may be in error by at least and possibly more in some instances (Elvis, Wilkes & Lockman 1989). Nevertheless, one conclusion is clear from the above analysis, namely that we have no evidence for any excess flux in the extreme ultraviolet band in the spectra of NLS1s (over and above that predicted by a simple power-law extrapolation of the soft X-ray spectrum).
Using the unabsorbed fluxes measured at 200 eV and an estimate of the optical flux at 5500 Å derived from the V-band magnitude, we have also calculated the optical/EUV spectral index, , for each source (see Table 2). Figure 4 shows a plot of versus for the AGN sample. An obvious point is that, apart from two objects, spectral slope in the soft X-ray band is generally steeper than the optical/EUV index. Specifically and (where the error represents the standard deviation of the distribution). The implication is that many of these sources may contain a large hidden ultraviolet/EUV excess, possibly attributable to emission from the hotter inner regions of an accretion disk (e.g., Bechtold et al. 1987).

4 The Luminosity Function of EUV-Selected AGN
Our catalogue of EUV-selected AGN represents the best sample of such sources presently available and, in principle, may be used to investigate the statistical properties of the extragalactic EUV-source population. Here we construct an approximate EUV luminosity function and estimate the relative contributions of the various types of AGN to the local () EUV volume emissivity. Values of km/s/Mpc and are assumed throughout this section.
The first step is to define the intrinsic luminosity of each source. For this purpose we employ a “standard” spectral model consisting of a power-law continuum with fixed at –2 (i.e., close to the overall mean value for the sample). We also investigated using the individual values tabulated in Table 1 and found that it made no significant difference, and thus stayed with the mean value because the uncertainties are smaller. Using this spectral form, together with the appropriate Galactic and redshift, we then transform the observed S1 count rates for each source to a monochromatic luminosity, , measured at a rest-frame energy of 200 eV. The derived values of are listed in Table 2. Allowing for the strong cut-off of the source spectra at low energies due to Galactic absorption, the selected energy of 200 eV is close to the typical photon energy recorded for this set of sources in the WFC S1 band. Similarly, we use a monochromatic luminosity since the typical effective detection bandwidth is very narrow (again as result of Galactic absorption). It is a matter of semantics as to whether the derived luminosities are referred to as EUV or “ultra-soft” X-ray measurements; here we use the former.
The standard formula for calculating the luminosity function of a sample of sources (e.g., Schmidt 1968) is:
where there are objects in each luminosity bin of width , and is the volume surveyed in the process of detecting the th source. Because the test was developed for a flux limited survey, the calculation of is complicated in this instance by the fact that the WFC survey is significance limited (that is, the limiting flux is not constant from one part of the sky to another). Earlier (§ 3.1), we assumed that the sample of sources could, at least to a first approximation, be represented as a count-rate limited sample with a threshold (at ) of S1 ct/ks. Since this prescription gave a reasonable outcome in terms of the test, we also adopt the same approach in calculating the luminosity function; in any event the very limited source statistics most likely dominate the errors.
A second serious complication is that the transmission in the EUV band is a very strong function of the Galactic foreground . Our approach of assuming a constant count rate threshold over the sky implies a variable flux threshold (when due allowance is made for the variable Galactic transmission), which in turn directly influences the survey volume. Specifically, for each source we calculate
where is the differential solid angle of sky with a Galactic column density , is the Galactic EUV transmission as a function of , is the Galactic column density in the direction of the source, , is the S1 count rate and is the source distance. The cumulative function of is shown in Figure 5 and has a value at of steradians or 31 square degrees (whereas integration of ) between the same limits gives 3.5 steradians).

For the purpose of this paper we have estimated the luminosity function, , for the full sample of AGN (i.e., Seyfert galaxies plus BL Lac objects) from a binned representation of the data as shown in Figure 6. The plotted errors correspond simply to a factor and since they don’t account for any possible systematic errors, they should be considered to be lower limits on the true errors. The three lower luminosity points in Figure 6 are consistent with the power-law form
where is the monochromatic luminosity at a rest frame energy of 200 eV in units of . This rather flat luminosity function appears to cut off sharply in the highest luminosity bin (which contains only two sources, both of which are BL Lac objects).

The integrated volume emissivity has been estimated by summing the product of and over the sample of sources. We obtain a total emissivity of at 200 eV (which is close to the value obtained by integrating the above luminosity function between ). The NLS1s contribute 50% of this emissivity, BLS1s 42%, and the BL Lac objects the remainder. This high contribution of NLS1s is in contrast to the situation at hard X-ray energies, where NLS1s make a negligible contribution to the volume emissivity (e.g., Picccinotti et al. 1982). However, it is interesting to note that a similar value for the volume emissivity at 200 eV is obtained by extrapolating downward with a spectral slope from the 2–10 keV AGN volume emissivity derived from the HEAO-1 A2 sample (Piccinotti et al. 1982).
5 Conclusions
This paper focuses on a sample of extragalactic sources selected on the basis of their detection in the EUV by the ROSAT WFC. Using an approach optimized to find such sources we construct an initial catalogue of 34 sources, which after the exclusion of sources identified with Galactic objects, reduces to a sample of 19 EUV-bright AGN. This is the first reasonably sized, complete and unbiased sample of EUV-selected AGN to be available. NLS1s are well represented in the sample making up just under half of the total, with BLS1s and BL Lac objects comprising the remainder. This is in stark contrast with hard X-ray selected samples, in which NLS1s have negligible representation. It is expected that these data will allow the first reliable statistical studies of this important emerging subclass of “extreme” AGN.
In the first such preliminary study, presented in this paper, a correlation was seen between the ROSAT soft and hard band hardness ratios, and , indicating that sources with strong EUV excesses also have steeper soft X-ray spectra. These data were also used to directly derive the first luminosity function for AGN measured at EUV energies (specifically at 200 eV). The luminosity function implies a roughly equal contribution to the EUV volume emissivity from each decade of luminosity for between to , but with a sharp cut off at higher luminosities. This luminosity function provides an independent estimate of the mean intergalactic ionizing photon field, which until now has been estimated by extrapolation from the optical luminosity function of AGN. Finally, we note that NLS1s contribute roughly half of the volume emissivity at 200 eV, again in contrast to the situation pertaining at harder X-ray energies.
Acknowledgments
The authors would like to thank John Pye, Steve Sembay, Keith Sohl and the Leicester WFC team for help compiling the deep WFC data and correlating it with the RBSC and other data. This research made use of data obtained from the High Energy Astrophysics Science Archive Research Center (HEASARC), provided by NASA’s Goddard Space Flight Center, from the NASA/IPAC Extragalactic Database (NED), provided by NASA/JPL under contract with Caltech, from the Leicester Database and Archive Service (LEDAS) at the Department of Physics and Astronomy, Leicester University, UK, and from the Set of Identifications, Measurements and Bibliography for Astronomical Data (SIMBAD), maintained by the Centre de Donnees astronomiques de Strasbourg. We thank the staff at the Anglo-Australian Observatory for obtaining the spectrum of RX J0437–47 during service time, and Thomas Boller for a quick and helpful referee’s report. SV acknowledges support from PPARC.
References
- [1] Avni, Y., Bahcall, J. 1980, ApJ, 235, 694
- [2] Bade, N., Fink, H., Engels, D., Voges, W., Hagen, H.-J., Wisotzki, L., Reimers, D. 1995, A&AS 110, 469
- [3] Bechtold, J., Czerny, B., Fabbiano, G., Elvis, M. & Green, R. 1987, ApJ, 314, 699
- [4] Brandt, W. N., Pounds, K., Fink, H. 1995, MNRAS, 273, L47
- [5] Boller, Th., Brandt, W. N., Fink, H., 1996, A&A, 305, 53
- [6] Boroson, T., Green, R. 1992, ApJS, 80, 109
- [7] Bowyer, S. & Malina, R. 1991, The EUVE Mission in Extreme Ultraviolet Astronomy, ed. R. Malina & S. Bowyer (New York: Pergamon), 391
- [8] Craig, N., Fruscione, A. 1997, ApJ, 114, 1356
- [9] Dickey, J. M., Lockman, F. J. 1990, ARA&A 28, 215
- [10] Elvis, M., Wilkes, B., Lockman, F.J. 1989, AJ, 97, 777
- [11] Falamo, R., Pesce, J., Treves, A. 1993, ApJ, 411, L63
- [12] Fruscione, A. 1996, ApJ, 459, 509
- [13] Goodrich, R. 1989, ApJ, 342, 224
- [14] Gondhalekar, P. et al. 1994, MNRAS, 268, 973
- [15] Grupe, D. 1996, Ph.D. Thesis
- [16] Grupe, D., Beuermann, K., Mannheim, K., Thomas, H.-C., Fink, H., de Martino, D. 1995, A&A, 300, L21
- [17] Guainazzi, M. et al. 1998, A&A, 339, 327
- [18] Halpern, J. P., Leighly, K. M., Marshall, H. L., Eracleous, M., Storchi-Bergmann, T. 1998, PASP, 110, 1394
- [19] Marshall, H., Fruscione, A., Carone, T. 1995, ApJ, 439, 90
- [20] Miller, H. R. 1975, ApJ, 201, L109
- [21] Osterbrock, D. 1977, ApJ, 215, 733
- [22] Osterbrock, D., Pogge, R. 1985, ApJ, 297, 166
- [23] Piccinotti, G., Mushotzky, R,̇ Boldt, E., Marshall, F., Serlemitsos, P., Shafer, R. 1982, ApJ, 253, 485
- [24] Polomski, E. et al. 1997, ApJ, 486, 179
- [25] Pounds, K. et al. 1993, MNRAS, 260, 77
- [26] Pounds, K., Done, C. & Osborne, J. 1995, MNRAS, 277, L5
- [27] Puchnarewicz, E. et al. 1992, MNRAS, 256, 589
- [28] Puchnarewicz, E. et al. 1995, MNRAS, 276, 20
- [29] Pye, J. et al. 1995, MNRAS, 274, 1165
- [30] Ross, R., Fabian, A., Mineshige, S. 1992, MNRAS, 258, 189
- [31] Sambruna, R. et al. 1997, ApJ, 487, 774
- [32] Schmidt, M. 1968, ApJ, 151, 393
- [33] Sims, M. et al. 1990, Opt. Eng., 26, 649
- [34] Stocke, J. et al. 1991, ApJS, 76, 813
- [35] Trümper, J. et al. 1991, Nature, 349, 579
- [36] Turner, T. J. et al. 1999, ApJ, 510, 178
- [37] Voges, W. et al. 1996, Proc. “Röntgenstrahlung from the Universe”, ed. H. Zimmermann et al., MPE Report 263, p. 637
- [38] Wills, B. et al. 1992, ApJ, 400, 96