Thermal Instability and Evaporation of Accretion Disc Atmospheres
Abstract
We investigate the vertical structure of the outer layers of accretion discs in which the local viscous energy dissipation rate scales with the pressure as for standard Shakura-Sunyaev discs. It has been pointed out by several authors that a thermal instability occurs in the outer layers of such discs when the gas pressure drops below a certain value. When the density becomes too low thermal equilibrium can no longer be maintained and the gas heats up, forming a hot corona or possibly a wind. To assess the importance of this effect we estimate the pressure and temperature at which this instability will occur, where the instability point lies with respect to the total vertical disc structure, and whether the instability is likely to be important for the disc as a whole. The main difference between our work and earlier estimates lies in a more detailed treatment of the heating and cooling processes and the inclusion of the effects of an external radiation field.
By solving for the accretion disc vertical structure using the grey two-stream approximation instead of the usual diffusion approximation for the radiative transfer, we first show that the thermal structure of the optically thin outer layers is in first approximation independent from radiative transfer effects, and follows the thermal equilibrium curve for optically thin plasma’s in the pressure-temperature plane. We then calculate the thermal structure using the detailed photoionisation code MAPPINGS, which includes much more accurate heating and cooling physics than the mean opacity used in the vertical structure calculations. This approach also allows a straightforward inclusion of the effects of an external radiation field from the centre of the accretion flow.
We apply our method to cataclysmic variable (CV), and stellar mass black hole discs, and show that evaporation due to the thermal instability can be important under a variety of conditions. In the case of CVs, radiative heating by photons emanating from the boundary layer can increase the evaporation rate significantly over the non-irradiated case, but for steady state CV discs the evaporation by the mechanism considered here is still not sufficient to evaporate the entire disc. It may become important however in non-steady discs in dwarf novae if the accretion heated white dwarf plays a role in irradiating the disc after an outburst. In the case of Black Hole Soft X-ray Transients, the evaporation can have a significant effect on the structure of the outer regions of the disc, resulting in mass loss rates comparable to the local mass accretion rate through the disc for g s-1 for a solar mass black hole. Accretion in such systems could therefore proceed mainly from a hot thick disc formed by evaporation from the outer regions of the thin disc. The evaporation can be quenched by Compton cooling only for mass transfer rates of g s-1 and low values of the viscous heating parameter .
keywords:
accretion, accretion discs — novae, cataclysmic variables — black hole physics1 Introduction
The vertical structure of accretion discs, as based on the equations of hydrostatic equilibrium, energy transport and detailed opacities and equation of state has been studied extensively in the past (e.g. Mineshige & Osaki 1983, Smak 1982, Meyer & Meyer Hofmeister 1982, Canizzo & Wheeler 1984, Shaviv & Wehrse 1986, Mineshige & Wood 1990). Most of these works assume that the heating prescription for vertically averaged disc structures originally given by Shakura & Sunyaev (1972), , is also valid locally. As discussed earlier in Shaviv & Wehrse 1986 (hereafter SW), Adam et al. 1988 (hereafter ASSW), Czerny & King 1989 and Shaviv, Wickramasinghe & Wehrse 1998 (hereafter SWW) this assumption must lead to a thermal instability in the outer, low-density layers of the disc. The underlying mechanism is as follows. The cooling rate at a given temperature of a low density optically thin gas is roughly proportional to the density squared, whereas the viscous heating rate is proportional to the density. Thus, when the density in the disc decreases outwards, the cooling decreases faster than the heating. As long as the cooling rate at constant pressure increases with temperature, the equilibrium temperature rises with decreasing density. More realistic cooling curves however (e.g. Raymond et al. 1976) have a maximum in the cooling rate at a temperature between and K, after which the cooling rate decreases with increasing temperature. This leads to runaway heating.
In this paper we investigate this instability further, and discuss the likely consequences for the disc structure. ASSW have argued that this instability can lead to the formation of a stable “corona” with a temperature of a few times K over a large fraction of the disc surface, and SWW argue that it could lead to mass loss from the surface of the disc that can become comparable to the total mass accretion rate.
These conclusions depend strongly on the opacities used in these calculations, since the opacity essentially prescribes the cooling rate. SWW considered power law opacities, and in their applications to Black Hole Soft X-ray Transients (BHSXTs), took only bremsstrahlung emission and absorption into account, which severely underestimates the cooling rate in the optically thin outer disc layers when they are cooler than K. ASSW used relatively old opacity tables, and as is discussed in more detail below, used the Rosseland mean absorption coefficient in the thermal equilibrium equation rather than the Planck mean (see also Hubeny 1990). These two means can easily differ by a factor of , so that this assumption has a major effect on the results. Additionally, these papers did not consider the effect of the irradiation of the outer disc layers by a much harder, but diluted continuum from the central parts of the accretion disc or the accreting compact object.
We therefore reinvestigate the structure of the optically thin outer layers of accretion discs. The outline of this paper is as follows. First, we present some vertical structure models based on the two stream approximation. These show that the thermal structure of the outer layers is essentially determined by the thermal equilibrium curve in the pressure - temperature plane. We then argue (see also Mineshige & Wood 1990) that the description of heating and cooling processes in terms of mean opacities (as used in the set of accretion disc vertical structure equations) is not accurate enough to properly describe the thermal equilibrium, and present a set of detailed calculations of thermal equilibrium curves in the plane obtained with the photoionisation equilibrium code MAPPINGS. Based on these curves, we then discuss the consequences of the thermal instability for the accretion disc. The results are applied to Cataclysmic variable (CV), and stellar mass black hole discs.
2 Method
2.1 Vertical Structure Equations
To solve for the detailed vertical disc structure we require a set of equations for the hydrostatic equilibrium and energy generation and transport. Since this paper deals mainly with processes in the outer, optically thin layers of accretion discs we neglect convective energy transport.
The hydrostatic equation is
| (1) |
where is the gas pressure, and the Keplerian angular velocity of the disc at the radius considered, is the Rosseland mean opacity and the radiation flux. Our equation of state
| (2) |
includes the effects of ionization of hydrogen and helium, and is computed together with the mean opacities.
Most detailed vertical structure models calculate the radiative energy transport in the diffusion approximation (Meyer & Meyer-Hofmeister 1982, Canizzo & Wheeler 1984), which is clearly not appropriate for the optically thin outer regions of the disc that are the main emphasis of this work. The best way to solve the problem would be to treat the entire disc as a stellar atmosphere (see e.g. Hubeny 1990, Hubeny & Hubeny 1997) with a full treatment of the angle- and frequency dependent radiation field, but in practice this is not straightforward, and also not necessary if one is just interested in the global behaviour of the solutions and not in the detailed line profiles. We therefore make two approximations. The frequency dependence is eliminated by using only frequency integrated quantities and appropriate mean opacities, and the angle dependence is simplified by considering only an ingoing and an outgoing direction. This leads to the so-called grey two-stream approximation. Although approximative, this method still allows for a natural transition between optically thick and optically thin regions.
We base ourselves on the grey two-stream formalism, in which the direction of the outgoing and ingoing beam are taken to travel at an angle with respect to the normal of the surface , with and respectively. In a slightly different form (taking ), this formalism has been used in several papers calculating accretion disc vertical structure (SW, ASSW).
We first define the following quantities. The frequency integrated intensities along the outgoing and ingoing stream will be called () and (). In terms of these two quantities, the mean intensity and flux are defined as
| (3) |
| (4) |
The radiative transfer equations for () and () are
| (5) |
| (6) |
where and are the mean opacity and the absorption coefficient (per gram), is the volume emissivity, and the frequency integrated Planck function. The second equality follows from the assumption of LTE.
By adding and subtracting the transfer equations for and we derive the folowing equations for and (similar to the first and second moments of the full radiative transfer equation)
| (7) |
| (8) |
where is the Rosseland mean opacity, and the Planck mean absorption coefficient (both per gram). Equation 8 implicitly assumes that the spectral shape of the mean intensity is not too different from the Planck function at the local temperature . This could be a problem if the temperature in the optically thin outer disc layers would be very different from the disc effective temperature (corona-like), but this situation is not encountered in our solutions.
From the definitions of and , and the condition that there is no incoming radiation at the outer boundary (), and the symmetry condition in the disc midplane (), we find the two boundary conditions
| (9) |
| (10) |
where is the outer edge of the disc, which is predefined to lie at some very low pressure, say comparable to that of the interstellar medium.
In the two-stream approximation the temperature is not obtained by integrating the temperature gradient (as in the diffusion approximation), but is calculated locally from the two variables and by solving the thermal equilibrium equation
| (11) |
where is the viscous heating rate per unit volume,
| (12) |
From our solutions of the vertical disc structure using the two-stream approximation as described above, we will find that the thermal structure of the outer layers of the disc (as defined by the temperature of the solution as a function of pressure) no longer depends on radiative transfer effects. This can be understood as follows. At low optical depth and low pressure, the flux is nearly constant, being determined by the dissipation in the underlying layers. Furthermore, we find that the outer boundary condition (10) is not only satisfied at the exact outer boundary, but is a very good approximation throughout the optically thin region. In this case the temperature equilibrium equation can be simplified to
| (13) |
where is the Stefan-Boltzman constant. Using this equation, we can solve for the heating/cooling equilibrium as a function of the local variables pressure and temperature in the outer layers of the disc for given values of the central mass, mass accretion rate (which is equivalent to effective temperature) and radius without having to consider the vertical disc structure.
2.2 Opacities
Previous applications of the grey two-stream method to accretion disc vertical structure have not always taken the correct type of opacity average in the moment equations, and have used the Rosseland mean absorption coefficient rather than the Planck mean in equation 8 (ASSW). The Rosseland mean is basically a measure of how easily radiation can escape. It is designed to give the correct physical result when the diffusion approximation is used, and is thought to be a good approximation of the flux mean, hence its appearance in equation 7. It is mainly determined by how much of the spectral range has a relatively low opacity. Our numerical results confirm the assumption underlying the simplification made in previous works, in that the structure of the main body of the accretion disc is in fact extremely insensitive to the mean opacity in equation 8.
However, there is a problem with using the Rosseland mean when considering the structure of the optically thin regions that we are interested in in this paper. The optically thin cooling rate is given by definition as
| (14) |
with the Planck mean opacity. If the cooling is mainly due to lines or other features with a high absorption coefficient over a narrow frequency range, the Planck mean can be much higher than the Rosseland mean, and the use of the Rosseland mean in equation 11 severely underestimates the cooling rate. Comparing Rosseland and Planck mean opacities from the Opacity Project the difference can exceed a factor of , and even for a continuum process like free-free absorption the Planck mean is about 40 times higher than the Rosseland mean (Rybicki & Lightman 1979). In our application, it is therefore essential to use the Planck mean in equations 8, 11 and 13.
The Rosseland mean opacities we use are calculated with a program provided by R. Wehrse (private communication), and the Planck mean opacities are based on opacities from the Opacity Project (OP, Seaton et al. 1993) which are the state of the art in including as many bound-bound and bound-free processes as feasible. The reason we use different sources for the two mean opacities is as follows. The opacity program by Wehrse can calculate the opacities from physical principles over the entire range of pressures and temperatures needed for our accretion disc models, whereas the OP tables cover only a part of it. On the other hand, the program does not consider many spectral lines that are quite important for optically thin cooling. The Rosseland mean opacities from these two sources are virtually indistinguishable in the region where both are available, but the Planck mean resulting from Wehrse’s program is much lower than that from the OP data because many lines are not included.
Using the OP mean opacities for accretion discs two problems are encountered. The first is that the range of density and temperature for which these opacities have been computed do not overlap the entire regime for which they are needed, so that extrapolation to low density is necessary. The second one is that they are calculated for LTE, which will no longer be valid in the low density optically thin outer layers of the disc. In the low density limit we have
| (15) |
where is the “cooling function” calculated by many authors (e.g. Raymond et al. 1976, Sutherland & Dopita 1993). We therefore extrapolate the OP opacities to low densities assuming that below the lowest density available on the OP grid is reduced proportional to the density. The “cooling function” that can be derived from the OP Planck mean opacities using equation 15 is mostly within a factor of a few from the detailed cooling functions quoted above, except for low temperatures below K where it is significantly higher. In spite of these difficulties with the OP opacities, we still consider them an improvement over using the severely underestimated Planck mean opacities as calculated with Wehrse’s program.
3 Results
3.1 Vertical structure models
Here we first describe some results of our vertical structure calculations with the grey two-stream method to be able to put the results of our surface layer models into context. We solve the basic set of differential equations 1, 7, 8 with boundary conditions 9, 10 and at , together with the auxiliary equations 2, 11 and 12, for the four variables , , and as a function of z. The integration is started in the midplane (z=0), and proceeds outwards. In previous applications of the two-stream grey method the integration was usually started at the surface, but because we want to find the point where the thermal equilibrium equation does not have a solution any more, we can not use this method here.
Rather than solving for the disc structure by iterating on the disc height for a given mass accretion rate (or flux at the surface boundary), we solve for a self consistent disc structure by iterating on the central density for a given central temperature , and the mass accretion rate and surface density are determined by the model. The density at z=0 is iterated until the outer boundary condition (10) is fulfilled at a pressure where the optical depth is already very low (say ). This solution determines the main structure of the disc. We then do one more integration outwards with the midplane density and temperature from the converged solution, but now the integration does not stop at the pressure previously defined as the outer boundary, but continues outwards until the thermal equilibrium equation does not have a solution any more. It was carefully verified that the instability point obtained in this way does not depend on the choice of pressure at the outer boundary in the initial disc structure iterations as long as it lies at sufficiently low optical depth and pressure. Below we present some results for an accretion disc with around a one solar mass compact object.
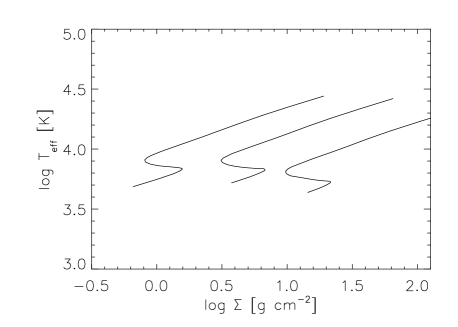
In Figure 1 we show the relation between surface density and effective temperature (the “S-curves”) for radii and cm. The lowest models have a of a few tenths, and are therefore already unreliable since the radiation field is no longer approximately a Planck spectrum, and the effective mean opacity will be very different from the Rosseland mean (Mineshige & Wood 1990). We therefore do not extend our models to lower optical depth discs. These curves reproduce reasonably well previous calculations carried out by other investigators (e.g. Canizzo & Wheeler 1984 ) in the diffusion approximation.

In Figure 2 the vertical structure of a disc model at cm with an accretion rate of is shown in detail. Plotted are the temperature, pressure and Rosseland mean optical depth as a function of height above the disc mid-plane. The cross on the temperature curve indicates the point where the optical depth is 1. The most pronounced feature is the long temperature plateau at low optical depth, which is explained in the next section. The temperature only starts to rise significantly, signalling the approach of the instability point, at a very low optical depth of less than . Note that there is no hydrostatic corona in this model: the temperature changes continuously, and at the pressure where the low-temperature equilibrium is lost there is no high-temperature equilibrium available to the gas. This is similar to the case when only free-free processes are considered (SWW).

Figure 3 shows the relation between temperature and pressure for a number of models with increasing mass transfer rate [ and g s-1 ] at cm. All structures have the same general morphology: pressure and temperature drop simultaneously with increasing height, until the point at which is reached. At this point the temperature becomes constant at a value slightly below the effective temperature, while the pressure drops by about 6 orders of magnitude. At very low pressure the temperature starts to rise again until the thermal instability sets in.
3.2 Simple surface layer models
In this section we will show how the simplified thermal equilibrium equation 13 explains the behaviour of the full disc solution at low optical depth. In Figure 4 we show the solution of equation 13 in the plane for cm and . At high pressures there are two equilibrium temperatures. The high temperature solution mostly lies on an equilibrium curve with a positive gradient, and is unstable since after a temperature perturbation at constant pressure (dictated by the hydrostatic equilibrium), the gas will tend to move farther away from the equilibrium line. On the other hand, the low temperature equilibrium is stable. For low temperatures, the temperature is almost independent of the pressure. This is because , so that the equilibrium temperature is given to high precision by . Since at low densities , for low enough pressures the heating term becomes comparable to the absorption and emission terms, and the equilibrium temperature rises. The minimum in the thermal equilibrium curve defines the lowest pressure at which thermal equilibrium is possible.


In Figure 5 we show a close-up of the solution of equation 13 on the same scale as in Figure 3, for cm and and . Comparing Figure 5 with Figure 3, it is obvious that the disc models just follow the thermal equilibrium curve as soon as the optical depth becomes small. Therefore, to estimate the temperature and pressure at the instability point we do not have to calculate the entire disc model, but only the equilibrium curves.
From Figure 4 it is clear that these vertical structure models never form a significant static hot corona. We note, however, that for a narrow range of pressure and temperature close to the global minimum in the equilibrium curves, there is a second higher temperature branch of negative where another stable equilibrium solution appears to be possible. Thus, we see from the close-up of Figure 5, that for a very narrow range of between 15 and 16 the equilibrium curve has two minima, the higher temperature one ( K) being slightly lower in pressure than the lower temperature ( K) one. The difference in pressure between the two minima is so small, however, that this cannot be considered a significant effect. Anyway, our cooling description is not likely to be accurate to such fine detail because of uncertainties in the opacities.
4 Detailed surface layer models
Clearly the description of the radiative heating and cooling processes in terms of a single (very uncertain) mean opacity is not very satisfactory. The adequacy of using mean opacities for optically thin discs and accretion disc atmospheres is also addressed in detail by Mineshige & Wood 1990, who found that models with a frequency dependent opacity can lead to significantly different results than those with mean opacities. Furthermore, the model above neglects the possible effect of a dilute external radiation field from the centre of the accretion disc or the surface of the accreting star when one is present. This external radiation field can be quite important, as has already be shown in other models (e.g. Begelman & McKee and Shields 1983, Idan & Shaviv 1996).
The previous section has shown that, in the outer very optically thin layers of the accretion disc where the thermal instability occurs, the temperature as a function of pressure is given to high accuracy by the thermal equilibrium curve in the plane of an optically thin gas irradiated by the underlying disc (equation 13). This result allows us to construct a more accurate description of the low optical depth region by calculating such thermal equilibrium curves for optically thin irradiated gas in more detail by using a different tool. It turns out that the pressure, temperature and optical depth in these outer layers is such that it is possible to calculate the thermal equilibrium curves with a photoionisation equilibrium code, with an extra heating term added to describe the viscous energy dissipation. We have used the code MAPPINGS (Sutherland & Dopita 1993). As all other photoionisation codes, this code is designed to work for a low density environment, and does not make any assumptions like LTE. The downside is that such codes become less accurate when the density becomes very high, because collisional de-excitation for species other than hydrogen and helium is not included, which could quench some of the emission lines. This limit on the density means that we can not consider the innermost parts of accretion discs around neutron stars or stellar mass black holes because the pressures and densities at the point where the optical depth becomes small are too high for the photionisation equilibrium code.
Thus, we consider the thermal equilibrium of an optically thin parcel of gas heated by viscous heating (equation 12) and irradiated by a radiation field with two components: an undiluted blackbody with a temperature equal to the effective temperature of the underlying accretion disc, and a diluted, generally much hotter blackbody coming from the central parts of the accretion flow. The fact that the disc models above indicate that the instability point lies at extremely low () Rosseland mean optical depth justifies our neglect of radiative transfer effects. We have also neglected the possible effect of shadowing of the radiation coming from the inner parts of the accretion flow by the disc at radii smaller than the one considered.
In terms of input parameters, the surface layer models are a function of the central mass , the mass flow rate through the disc , the radius in the disc considered, the viscosity parameter , and the external radiation field.
4.1 Application to Cataclysmic Variable Discs
For the external irradiation of a CV disc we take the radiation field expected from the boundary layer. We assume that for accretion rates below g s-1 the boundary layer is in a hot ( K) state (Warner 1995), leading to highly diluted, hard irradiating spectrum. For g s-1, the boundary layer is optically thick, and we take the radiating area to be , with the white dwarf radius and . In all cases we assume that the total luminosity of the boundary layer is
| (16) |
That is, we assume that the heating is what is expected for a steady disc corresponding to the given .

Figure 6 shows the result of the thermal equilibrium analysis of the outer layers of a CV disc at cm, for a range of mass flow rates through the disc () ranging from to g s-1, and two choices for the viscosity parameter , 0.3 and 0.01. We show only the part of the equilibrium curve before or slightly beyond the minimum, since for higher temperatures only unstable equilibria exist.
The irradiation flux, and its spectrum, determines the pressure and the temperature at which thermal instability sets in, but does not change the overall qualitative behaviour of the thermal equilibrium curves. To demonstrate the former, we also show two models with the external radiation field turned off. These are the curves marked 17nr in Figure 6. We can see that, to good approximation, the effect of this on the equilibrium curve is the same as reducing the mass accretion rate in the models including external radiation by a factor of .
The general morphology of the curves is quite similar to Figure 5. Most directly comparable to Figure 4 is the non-irradiated curve 17nr (solid), which has exactly the same parameters (, g s-1). In detail there is some difference. The temperature over most of the atmosphere is lower than that derived using a mean opacity, showing that the assumptions (mainly LTE) underlying the mean opacity calculations are not valid in the low density outer layers. The new minimum lies at a similar temperature (), but at a 10 times higher pressure. The inclusion of the external radiation field raises the critical pressure by an additional factor of 100. The detailed models are also similar to those in the previous section in that we never find hydrostatic coronae, since there is no hot equilibrium phase available to the gas once the pressure has dropped below the minimum.
Following Czerny & King 1989, we estimate the mass loss rate that can result from the thermal instability from the pressure and temperature at the instability point (see also SWW):
| (17) |
where and are the density and sound speed at the minimum in the thermal equilibrium curve. We consider this estimate to be an upper limit because the real mass loss rate is determined by at the critical point where . This critical point must lie at a higher z than the thermal instability point where the outflow starts to be driven, and we know that is a decreasing function of height.
The dotted lines in Figure 6 are lines of equal mass loss as defined by equation 17, labelled with the logarithm of the mass loss rate from the cool disc. We see that the minimum in the thermal equilibrium curves occur at a temperature and pressure that imply an evaporation rate that is always less than times the accretion rate, with the largest relative mass loss occurring for the lowest accretion rates. We also find that the relative importance of evaporation (as defined by the ratio ) is not very dependent on radius being about 3 times higher at than at cm.
On the basis of the above calculations, we can conclude that mass loss by evaporation due to the mechanism considered here will occur, but cannot be very important for the overall structure of CV discs. One may ask if the mechanism could be more effective in non steady discs, such as those found in dwarf novae, and perhaps be responsible for the central “holes” that appear to develop in some systems after an outburst. According to the limit cycle model for dwarf novae, the mass transfer rate through the disc oscillates between the values appropriate to the upper and the lower branch of the equilibrium S curves shown in Figure 1 (Osaki 1996), in general agreement with observations (Warner 1995). After a dwarf nova outburst the mass transfer rate through the disc could drop by a factor of from say to g s-1, but the disc may continue to be heated by a luminosity that is significantly higher than the value expected for a steady disc at the lower accretion rate. The irradiation luminosity could be by soft photons from the white dwarf which has been accretion heated by the immediately preceding outburst, and accumulated effects of previous outbursts. Enhanced heating of the outer disc may also occur at the end of an outburst when the luminosity of the inner regions of the disc far exceeds the luminosity expected for steady disc at the mass transfer rate rate appropriate to the lower branch of the S curve.
In order to investigate the effects of non-steady heating, we carried out an additional series of calculations for the model with g s-1 where the heating was enhanced to correspond to mass transfer rates near the inner edge of the disc of and g s-1 respectively (Figure 7). At the upper end of this range, the heating is mainly by UV photons at the appropriate black body temperature, and disc evaporation becomes very effective. These calculations show that non steady heating, for instance due to radiation from the heated white dwarf, can increase disc evaporation significantly. However, an increase in irradiation by a factor of at least over the steady case is necessary for the evaporation rate to become comparable to the mass flow rate through the disc.

4.2 Application to stellar mass Black Hole discs
The main difference between the thermal equilibrium in the outer layers of an accretion disc around a stellar mass black hole and a CV is the role played by the external hard radiation field (e.g. Begelman, Shields & McKee 1983, Idan & Shaviv 1996). As shown above, for CV’s this external radiation field has a mild effect on the steady state structure, but for black hole discs the radiation field completely changes the behaviour of the equilibrium curves. For discs around a stellar mass black hole, we assume that the temperature of the external radiation field is
| (18) |
where is the effective temperature of the disc and is the radius of the disc where most energy is dissipated, at 10 Schwarzschild radii. The dilution factor is
| (19) |
with a geometrical correction factor for the fact that the central continuum source is likely to be beamed perpendicular to the disc. We take to be 0.1. In Figure 8 we show the thermal equilibrium curves for the outer layers of a disc at a radius of cm around a 10 M⊙black hole, parameters appropriate for BHSXT’s.

First we demonstrate the importance of the external radiation field by comparing a model with g s-1 with (the thick lines labelled with 17) and without (thin lines) radiation. The presence of the radiation field increases the temperature at the instability point from to K and the pressure from to dyne cm-2 for the curve. According to our mass loss estimate equation 17, this implies a factor of increase in mass loss from the cool disc relative to the non-irradiated case. The models shown in Figure 8 also do not exhibit a real corona in the sense that a sudden transition to high temperatures occurs, although for the higher mass loss rates the temperature goes up to a million degrees before becoming unstable. We note that for larger radii and higher mass accretion rates a temperature discontinuity does form, with the temperature jumping from a few times K to about K, the latter corresponding to a well known equilibrium state of an X-ray irradiated low density gas (Krolik, McKee & Tarter 1981). The gas can remain in the hot state while the pressure drops by another factor of ten before becoming unstable.
It can be seen from figure 8 that for the highest accretion rate considered ( g s-1) and , the disc atmosphere does not become unstable at low presssures, but rather assumes a constant temperature as the pressure drops. This is because in this case the radiation field is strong enough to compensate for the viscous heating by inverse Compton cooling. Both the viscous heating rate and the Compton cooling rate are proportional to the pressure, so that the equilibrium remains valid as the pressure drops, and the atmosphere is stable everywhere. However, since the viscous heating rate is proportional to the disc angular velocity , and the Compton cooling proportional to the energy density of the radiation field , the cooling decreases faster with radius than the heating, and beyond a certain radius the thermal instability returns. In our case, we find that models with an accretion rate of g s-1 and become unstable for . These results are consistent with those of Czerny & King 1989, who studied the stabilization of an accretion disc atmosphere by Compton cooling while neglecting other radiative cooling and heating processes. Czerny & King considered only radiation directly from the underlying disc. Because we take the external irradiation into account, we find more effective stabilization at larger radii than Czerny & King did.
We point out that the models for Compton heated winds from accretion discs of Begelman, McKee and Shields (1983) did not include viscous heating. Most of the effect of these Compton heated winds come from the outer radii of the disc where the virial temperature becomes comparable to the Compton temperature. In our calculations the region where Compton cooling can compensate for viscous heating does not extend out far enough to reach , so that the regime considered in the Compton heated wind models is never reached. Thus, the Compton heated wind models require that in the corona in order to be valid.
Figure 8 also shows that if , the vertical mass loss from the cool disc could become comparable or greater than the mass flow through the disc for g s-1, implying that steady, cold discs may not exist around stellar mass black holes in the low regime if the dissipation rate in the outer layers is high (). We have summarized our results for the relative mass flow out of the cool disc () for different radii in Figure 9. Our results indicate that disc evaporation by a combination of viscous heating and irradiation is more important in the outer parts of a steady disc than in the inner parts. Only for the lowest accretion rate of g s-1 is the entire range of radii we consider susceptible to complete evaporation, implying that a steady state cool disc may not exist beyond a radius of cm. However, the evaporation could remain a significant effect at at least the 10 % level for all accretion rates considered. We re-emphasize that this conclusion does depend upon the effectiveness of viscous heating () in the atmosphere, and that for smaller the evaporation becomes important only for lower mass accretion rates and larger disc radii, e.g. for the accretion rate and evaporation rate become comparable for R = cm and g s-1.

The somewhat complex behaviour (crossing over) of the curves at log R = 10.5 in Figure 9 is due to a switch of the equilibrium state at which the lowest stable pressure occurs, between the cool equilibrium at a few times K and the hot equilibrium for X-ray irradiated gas at about K.
5 Discussion
We have shown that mass loss can occur from the surface of an accretion disc by evaporation due to thermal instability for a variety of conditions.
For accretion discs in cataclysmic variables, radiative heating by photons from smaller radii in the form of hard X-rays (from an optically thin boundary layer) or K black body photons (from an optically thick boundary layer or the heated white dwarf surface), plays an important role in determining the mass loss rate due to atmospheric thermal instability. Under steady state conditions, the mass loss rate is expected to be less than a maximum of a few percent of the mass transfer rate through the disc, with the maximum being reached in low discs. However, in non steady discs, mass loss from thermal instability could be a larger fraction of the mass transfer rate through the disc. Another effect that could significantly increase the evaporation rate is extra heating in the atmosphere, as would be expected if a significant buoyant flux of magnetic field is escaping from the disc and is dissipated in the atmosphere, as has been suggested by some authors (Tout & Pringle 1992, but see also Stone et al. 1996). The thermal instability may therefore provide an explanation for the UV delay seen in some dwarf novae, which has been interpreted as evidence for the existence of ”holes” in the disc during the low phase of the dwarf nova cycle, but other effects that come into play once the instability has led to a significant corona are probably a better candidate.
An example of this is the work of Meyer & Meyer Hofmeister 1994 (MMH) and Liu et al. 1996, who found that evaporation from a CV disc can easily lead to significant mass loss. These models do not consider the stability of a cold disc by itself, but rather consider the situation in which the disc is sandwiched between a corona, and calculate the structure of such a disc-corona combination self-consistently. The evaporation in their case is due to thermal conduction from the viscously heated corona into the cold disc. They also take the dynamics of the evaporative outflow into account, an ingredient that is still missing from our exploratory calculations. Our results indicate that a cold disc by itself is indeed unstable, and that the formation of a corona is inevitable. Thus, evaporation by the mechanism modelled here may play a role by providing seed material for a corona, which may then develop into a coronal siphon flow in the manner outlined by MMH. We do treat the thermal equilibrium of the accretion disc outer layers in more detail than MMH, and show that the effect of the radiation field, which was not included by MMH, can be quite significant. We find that in our case the heating in the disc atmosphere is dominated by absorption of radiation over many pressure scale heights (even in the case of no radiation from the centre of the accretion flow), and not viscous heating as modelled by MMH. We expect that for discs around black holes or neutron stars the irradiation effect is so strong that the disc evaporation picture developed by MMH for CV discs will have to be modified to include the irradiation.
Disc atmospheres around stellar mass black holes develop a thermal instability at much higher pressure than discs around white dwarfs due to the strong irradiation, and significant evaporation by thermal instability appears to be a real possibility. The importance of X-ray heating in determining the S curves of BHSXT discs and disc instability has already been demonstrated by El Khoury and Wickramasinghe (1998). Our calculations have shown that X-ray heating from the inner regions of a black hole disc can be sufficient to drive evaporation at a rate comparable to or larger than the local mass transfer rate through the disc for g s-1. The evaporation is strongest in the outer regions of the disc,and will be quenched by Compton cooling only at very high ( g s-1) and for low in the accretion disc atmosphere. Thus, the thermal instability considered here may play a role in the transition of thin cool discs to hot advection dominated discs that has been postulated to explain the absence of a strong X-ray flux from some accreting black hole candidates (e.g Narayan, McClintock & Yi 1996).
Our results could have important implications for the interpretation of the observations of accretion discs around Black Hole Soft X-ray Transients. It is well documented that line profiles of H and He lines seen in BHSXT’s are rarely disc - like. Rather, phase dependent observations show strongly asymmetric and split lines which are inconsistent with an origin in a standard disc (Soria et al. 1998). We draw particular attention to the well studied system GRO1655-40. The spectral energy distribution during its 1996 outburst appears to evolve in time more like a black body than a disc (Hynes et al. 1998). The soft X-ray delay seen in this system (Hameury et al. 1997) also argues for a non standard disc. Based on our calculations, it would appear that the modelling of the time dependent evolution of such systems would require consideration of evaporation, and accretion from the hot, thick disc that could result from this.
6 Acknowledgements
We would like to thank Ralph Sutherland for making the photoionisation code MAPPINGS available to us. Our referee, Ivan Hubeny, has contributed significantly to making this paper more clear and consistent.
References
- [1] Adam, J. et al. 1988, A&A 183, L1 (ASSW)
- [2] Begelman, M.C., McKee, C.F. & Shields, G.A. 1983, ApJ 271,70
- [3] Canizzo, J.K. & Wheeler J.C. 1984, ApJS 40, 1
- [4] Czerny, M. & King, A.R 1989, MNRAS 236, 843
- [5] El Khoury, W., & Wickramasinghe, D. T., 1998, MNRAS (in press)
- [6] Idan, I. & Shaviv, G. 1996, MNRAS 281, 615
- [7] Hynes, R. L. et al. 1998 MNRAS 300, 64
- [8] Hubeny, I. 1990, ApJ 351, 632
- [9] Hubeny, I.& Hubeny, V. 1997, ApJ 484, L37
- [10] Krolik, J.H., McKee, C.F. & Tarter, C.B. 1981, ApJ 249, 422
- [11] Liu, F.K., Meyer, F. & Meyer-Hofmeister, E. 1995, A&A 300, 823
- [12] Meyer, F. & Meyer-Hofmeister, E. 1994, A&A 288, 175
- [13] Meyer, F. & Meyer-Hofmeister, E. 1982, A&A 106, 34
- [14] Mihalas, D. & Mihalas, B. 1984, in “Foundations of Radiation Hydrodynamics”, Oxford University Press, p359.
- [15] Mineshige, S. & Wood, J.H. 1990, MNRAS 247, 43
- [16] Mineshige, S. & Osaki, Y. 1983, PASJ 35, 377
- [17] Narayan, R., McClintock, J.E., & Yi, I. 1996, ApJ, 457, 821
- [18] Osaki, 1996, IAU Colloquium 163
- [19] Raymond, J.C., Cox, D.P. & Smith, B.W. 1976, ApJ 204, 290
- [20] Rybicki, G.B. & Lightman, A.P. 1979, in “Radiative Processes in Astrophysics”, J. Wiley & Sons, New York, p. 162
- [21] Soria, R. et al. 1998, ApJ 495, 95L
- [22] Seaton, M.J. 1993, MNRAS 265, 25P
- [23] Shakura, N.I. & Sunyaev, R.A. 1973, A&A 24, 337
- [24] Shaviv, G. & Wehrse, R. 1986, A&A 159, L5
- [25] Shaviv, G., Wickramasinghe, D. & Wehrse, R. 1998, submitted (SWW)
- [26] Smak, J, 1982, Acta Astronomica 32, 213
- [27] Stone, J.M. et al. 1996, ApJ 463, 656
- [28] Sutherland, R.S. & Dopita, M.A. 1993, ApJS 88,253
- [29] Tout,C.A. & Pringle, J.E. 1992, MNRAS 259, 604
- [30] Warner, B., 1995, Cataclysmic Variables, Cambridge University Press