The optical variability of the narrow line Seyfert 1 galaxy IRAS 13224-3809
Abstract
We report on a short optical monitoring programme of the narrow-line Seyfert 1 Galaxy IRAS 13224-3809. Previous X-ray observations of this object have shown persistent giant variability. The degree of variability at other wavelengths may then be used to constrain the conditions and emission processes within the nucleus. Optical variability is expected if the electron population responsible for the soft X-ray emission is changing rapidly and Compton-upscattering infrared photons in the nucleus, or if the mechanism responsible for X-ray emission causes all the emission processes to vary together. We find that there is no significant optical variability with a firm upper limit of 2 per cent and conclude that the primary soft X-ray emission region produces little of the observed optical emission. The X-ray and optical emission regions must be physically distinct and any reprocessing of X-rays into the optical waveband occurs some distance from the nucleus. The lack of optical variability indicates that the energy density of infrared radiation in the nucleus is at most equal to that of the ultraviolet radiation since little is upscattered into the optical waveband. The extremely large X-ray variability of IRAS 13224-3809 may be explained by relativistic boosting of more modest variations. Although such boosting enhances X-ray variability over optical variability, this only partially explains the lack of optical variability.
keywords:
galaxies: individual: IRAS 13224-38091 Introduction
X-ray observations by Boller et al (1997) have shown persistent giant variability on short timescales, with an amplitude of variability far in excess of that seen in a typical broad line Seyfert 1 galaxy. Such extreme variability is determined by the emission and variability mechanisms in the nucleus. The degree of variability at other wavelengths may be used to constrain the conditions and mechanisms. Optical variability will occur if, for example, the X-ray emitting electron population is rapidly changing and Compton scattering infrared radiation in the nucleus, or if the mechanism responsible for the X-ray variations causes all the emission processes to vary together. It has also been suggested (Boller et al 1997) that such large amplitude X-ray variability may be due to relativistic boosting, the degree of which is spectrally dependent. We have therefore observed IRAS 13224-3809 on three consecutive nights in order to determine the level of optical variability in the source.
Previous studies of the narrow line Seyfert 1 galaxy IRAS 13224-3809 have shown it to be variable both in the UV and X-ray wavebands. Long timescale Ly line variability has been observed, with the line profile and flux changing between three IUE observations over four months (Mas-Hesse et al. 1994). UV continuum variability has been observed in 11 IUE observations spanning three years, with the flux varying by 24 per cent (Rodríguez-Pascual 1997).
2 Optical observations
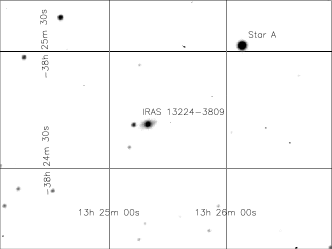
IRAS 13224-3809 (, ) was observed in B, V, R and I on three consecutive nights from 1997 March 13 to 16 using the blue sensitive TEK4 CCD at the Cassegrain focus of the 1m Jacobus Kapteyn Telescope (JKT). The arcmin CCD field contained the galaxy and a number of foreground stars (see Fig. 1) allowing us to perform relative photometry. The images were bias subtracted and flat fielded using sky flats. Flux calibration was performed using the standard stars PG0942-029B, C and D of Landolt (1992). IRAS 13224-3809 has a foreground star 7.6 arcsec from the optical nucleus (10.7 arcsec from the X-ray centroid position (Boller et al. 1997)), and the aperture used to collect the light from the nucleus was chosen to have a diameter of 6.6 arcsec. This was found to collect most of the light from the nucleus whilst minimising that from the surrounding galaxy and the foreground star. Repeating our analysis with different sized apertures did not significantly affect our results. The same size aperture was used to obtain the flux from a comparison star in the field. Fig. 2 shows the radial profile of pixel values from the centre of IRAS 13224-3809. The scatter in pixel value is due to the different contributions to the radial profile from different azimuths. The contribution from the nucleus, underlying galaxy, the nearby star and background may be seen.

We follow the method of Done et al (1990) in which the variations seen in a comparison star due to small-scale rapid changes in seeing are used as a scalable template to model the variability one would expect to see in the nucleus as a results of those seeing changes. During each night the zenith distance of IRAS 13224-3809 varied between 67–72∘ and over such a small range we expect the extinction to remain almost constant. Since the images were taken through a number of different filters we grouped the images by night and by filter and then normalised them so that they have the same mean. This allows us to compare images taken with different filters. Fig. 3 shows the stellar and galactic residuals about the mean for a typical night. We would expect the slope of the best fitting line to be 1 if the seeing had an equal effect on both the galaxy and the comparison star. The actual fit has a slope of 1.10 indicating that seeing has a larger effect on the flux measured for the galaxy than the star, assuming both are not variable. The stellar residuals are then used as a scalable template for the variations of the galaxy about the mean flux of the galaxy. The normalisation of this template is chosen to minimise the difference between the predicted and observed galactic fluxes. Fig. 4 shows the template light curve, created using the scaled stellar residuals, and the actual light curve. There is very good agreement between the two.
Fig. 5 shows the light curve for the three nights using data from all filters, with Poisson error bars. The light curve is consistent with less than 1 per cent variability during each night. One may expect the amplitude of variability to be wavelength dependent, but we are unable to detect significant variability in the data from any one filter. The light curve for each night is normalised to the mean for that night although there is less than 1 per cent variability between nights. The large breaks in the light curve are due to high winds at the telecsope preventing observing.


3 Discussion
3.1 Optical

The optical light curve of IRAS 13224-3809 is consistent with the short time-scale variability of the source being less than 1 per cent. We are unable to comment on the wavelength dependence of any optical variability. Our aperture, however, also collects flux from the underlying galaxy which dilutes the signal from the nucleus. As may be seen from Fig. 1 the three main components of the flux received within a radius of 10 pixels, namely the contribution of the background, the underlying galaxy and the nucleus may be separated. If the nucleus is assumed to be a Gaussian point source and we (over-) estimate the contribution from the galaxy then the variability of the nucleus may be constrained. It is found that a 1 per cent variation of the entire source may correspond to a per cent variation in the nucleus.
The continuum optical spectrum of IRAS 13224-3809 (Boller et al 1993) has a photon index of approximately across the optical waveband. The V band magnitude of the nucleus is 15.2, corresponding to a flux in the V band of erg cm-2 s-1 at 5500Å.
3.2 X-ray
Simultaneous X-ray data are not available but if the 30 day ROSAT light curve of Boller et al (1997) is assumed to be typical of IRAS 13224-3809 it is extremely unlikely that the X-ray flux did not at least double during the period of our observations. This light curve is shown in Fig. 6 and there is no set of three consecutive days during which the X-ray flux did not change considerably. The only period of relative ‘quiescence’ is between 8–10 days, and even during this the X-ray flux at least doubles. A more recent HRI monitoring campaign has confirmed the continued existence of such extreme variability (private communication).


The X-ray photon index of IRAS 13224-3809 was observed to be very high, , and the average HRI count rate was count s-1 (Boller et al 1997) corresponding to a flux of erg cm-2 s-1 at 1.25 keV.
3.3 The nuclear X-ray and optical emitting regions
Optical emission can originate from the soft X-ray emission region, or very close to it, by several means. It may be emitted by the same electrons that produce the X-rays, by cyclotron or synchrotron emission or Comptonization (perhaps of photons produced by the cyclo-synchrotron process; see e.g. Di Matteo, Celotti & Fabian 1997). Comptonization is however unlikely to make a large contribution to the observed flux since the steep X-ray spectrum implies a low Compton -parameter which gives a similarly steep optical spectrum. Optical emission may also originate from reprocessing of the X-ray flux, and therefore would have a thermal spectrum (probably from a range of temperatures). Finally it may be triggered by whatever mechanism causes the X-ray variability but not share the same emitting electrons as the X-rays.
The X-ray flux is expected to have at least varied by a factor of two during our observations. Let us assume that the X-ray flux doubled at some point and consider the implications of the lack of optical variability.
A lack of variability in the optical band can be explained in several ways. It may simply be due to most, more than 98 per cent, of the optical emission emerges from a region unconnected with that producing the soft X-ray flux. Note however that the average soft X-ray flux (below 1 keV) is comparable to the optical flux and the peak soft X-ray flux may be significantly greater. It could also be due to the presence of many very dense clouds in the nucleus which free-free absorb the intrinsic optical flux (Celotti, Rees & Fabian 1994). Alternatively, the spectrum of the X-ray source may be such that relativistic effects preferentially enhance the variability of the X-ray emission over the optical emission.
The exceptionally large and rapid X-ray variability of IRAS 13224-3809 may be explained if the X-ray emission is relativistically boosted (Boller et al 1997). For a source moving at a fraction of the speed of light inclined at an angle to the observer the Doppler parameter is given by , where . If the source is a power law of photon index this gives rise to a boost in the amplitude of variability by a factor of . Fig. 7 shows the X-ray and optical boost factors that may be produced as a function of radius for different continuum photon indices and accretion disc inclinations. It is possible for the X-ray boost factor to be many times greater than the optical boost factor. (The ratio of the X-ray to optical boost factor is ). The fraction of the optical emission that may be produced by, or whose variability is tied to, the soft X-ray emitting regions may then be constrained. The maximum fraction of the optical emission that is due to the X-ray source is shown in Fig. 8 assuming values of and . For reasonable values of the inclination and emission radius it is unlikely that the X-ray source is responsible for more than about 10 per cent of the optical flux.
The observed photon index of the optical continuum may differ from that of the optical emission associated with the X-ray source. The lowest possible is from the Rayleigh-Jeans part of the blackbody spectrum, and it is possible that exceeds 4. It remains unlikely, however, that more than about 20 per cent of the optical emission is closely associated with the soft X-ray emission. Differential relativistic effects between the X-ray and optical bands can therefore be up to a factor of 10 but not completely explain the lack of optical variability.
The hot electron population responsible for the X-ray emission can inverse-Compton-scatter lower energy infrared photons into the optical waveband and similarly ultraviolet photons into the X-ray waveband. The observed lack of variability can be used to place a limit on the ratio of the energy density of infrared to ultraviolet radiation in the nucleus. The observed ratio of 1.25 keV X-ray to optical luminosity, , and the lack of optical variability suggests that the variable X-rays have less than or comparable with 1, so, in the nucleus, the energy density of infrared radiation is at most that of the ultraviolet radiation . If we assume the source to have an X-ray photon index , the 1.25 keV flux implies the 0.1 keV flux will be erg cm-2 s-1 allowing the stronger constraint


3.4 Location of any reprocessing material
The lack of optical variability implies that very little of the primary soft X-ray flux is reprocessed into the optical waveband within approximately a light day of the source. This may be due to the inner disc where the X-rays originate being hot and small, radiating mostly in the EUV, and to a lack of optically thick material oriented to reprocess these X-rays at larger radii. For a black hole two light days corresponds to roughly 1000 Schwarzschild radii.
4 Conclusion
The Narrow Line Seyfert 1 galaxy IRAS 13224-3809 shows persistent giant amplitude X-ray variability yet almost no optical variability exceeding 2 per cent. Such an extreme difference in variability between the two wavebands suggests the X-ray emitting regions do not produce any optical variability. This is expected if the electron populations responsible for X-ray and optical emission are physically distinct and the spectrum of the X-ray source intrinsically produces almost no optical emission. The energy density of infrared radiation in the nucleus is at most equal that of the ultraviolet radiation since the X-ray emitting electrons are not responsible for significant inverse Compton scattering into the optical waveband. If relativistic boosting occurs then the conclusions are weakened somewhat with at most about 20 per cent of the optical emission associated with the X-ray source. Any significant reprocessing of primary soft X-rays into the optical waveband occurs on scales greater than The lack of optical variability is consistent with observations of less extremely X-ray variable Seyfert 1 galaxies such as NGC 4051 (Done et al 1990).
5 Acknowledgements
AJY thanks PPARC for support. ACF and CSC thank the Royal Society.
References
- [] Boller Th., Trümper J., Molendi S., Fink H., Schaeidt S., Caulet A., Dennefeld M., 1993, A&A, 279, 53
- [] Boller Th., Brandt W.N., Fabian A.C., Fink H.H., 1997, MNRAS, 289, 393
- [] Celotti A., Rees M.J., Fabian A.C., 1992, MNRAS, 255, 419
- [] Done C., Ward M.J., Fabian A.C., Kunieda H., Tsuruta S., Lawrence A., Smith M.G., Wamsteker W., 1990, MNRAS, 243, 713
- [] Di Matteo T., Celotti A., Fabian A.C., 1997, MNRAS, 291, 805
- [] Landolt A.U., 1992, Astr. J., 104, 340
- [] Mas-Hesse J.M., Rodríguez-Pascual P.M., Sanz Fernández de Córdoba L., Boller Th., 1994, A&A, 283, L9
- [] Rodríguez-Pascual P.M., Mas-Hesse J.M., Santos-Lleó M., 1997, A&A, 327, 72