[
Supercluster Magnetic Fields and Anisotropy of Cosmic Rays above eV
Abstract
We predict energy spectra and angular distributions of nucleons above eV that originate from sources distributed in the Local Supercluster, which is also supposed to contain a large scale magnetic field of strength G. We show that this model can explain all present-day features of ultra-high energy cosmic rays, at least for field strengths close to G. The large-scale anisotropy and the clustering predicted by this scenario will allow strong discrimination against other models with next generation experiments.
PACS numbers: 98.70.Sa, 98.62.En
]
Ryu & Biermann [1] have recently argued that the observational upper limit on the strength of an extra-galactic magnetic field (EGMF), obtained from Faraday rotation observations of distant sources [2, 3], reads: G, for fields contained inside the cosmological large-scale structure, such as the Local Supercluster. Such a strong magnetic field would have profound consequences on the propagation of charged ultra-high energy cosmic rays (UHECRs) with energy EeV (EeVeV) [4, 5, 6, 7]. In particular, for G, charged UHECRs with energies up to EeV would diffuse, while UHECRs of higher energies would propagate in nearly straight lines. This would allow to reproduce very nicely the observed energy spectrum of UHECRs for a single injection spectrum [5, 6]. Moreover, the associated angular deflection might explain why no astrophysical counterpart within Mpc could be associated to the highest energy events. The existence of a magnetic field of strength G could thus reconciliate models in which the UHECRs are protons accelerated in conventional astrophysical sources [8], with present-day observations.
The most recent results of the AGASA experiment [9] provide tight constraints on these ideas and more generally on any scenario of UHECR origin. In particular, this experiment now reports the detection of 7 events above EeV, scattered across half the sky, with no obvious association with the Supergalactic plane. A naive one-source model, as considered in Refs. [5, 6], which predicts an angular size of the image for EeV, is thus excluded. However, whereas AGASA found no significant large scale anisotropy, the data indicate significant small scale clustering. In this letter we demonstrate that both the observed spectrum and the angular distribution can be explained by a diffuse distribution of sources with a density proportional to the matter density in the Local Supercluster, provided this structure is permeated by magnetic fields of strength G, with power concentrated on Mpc scales. In this scenario, the large scale isotropy observed by AGASA is explained by diffusion, whereas the small scale clustering is due to magnetic focusing in the magnetic field structure. We discuss future observational tests of this scenario against other models, especially with regard to the strong increase in UHECR statistics anticipated from the Pierre Auger Observatory [10].
Energy spectrum and angular images. During their propagation, UHECR nucleons lose energy by pion production (for EeV), and pair production (protons only), on the cosmic microwave background. Charged UHECRs also acquire stochastic deflection, and hence time delays with respect to straight line propagation, in random magnetic fields. Detailed predictions for the energy spectrum and angular distribution of UHECRs propagating in a magnetic field can only be made through numerical Monte-Carlo simulations [5, 11, 12], in order to take into account stochastic energy losses, stochastic deflection, and effects of an anisotropic geometry. In order to correctly reproduce the small scale angular distribution of events in a given realization of the magnetic field, one needs to accomodate a very small solid angle, that represents the detector as seen from the source, with a reasonable consumption of CPU time. Each of the simulations presented below typically requires one to several weeks of CPU time on DEC ALPHA 500 computers. Details on our method can be found in Refs. [5, 11, 12].
We assume that the sources of UHECRs are distributed according to the matter density in the Local Supercluster, following a pancake profile with scale height of Mpc and scale length of Mpc; the observer is located Mpc away from the center of the density profile (the Virgo cluster), and within Mpc from the middle plane. Furthermore, we assume that no sources are present within 2 Mpc from the observer. This represents a reasonable modeling of our location in the Local Supercluster and of its shape. We also assume that the Local Supercluster is permeated by a random magnetic field of strength G, whose power spectrum follows a Kolmogorov law , with . The largest eddy, defined as the scale over which the phase of the magnetic field changes by , is Mpc, and the corresponding smallest eddy is Mpc. This latter value is limited by resolution, but it does not influence our results, as long as the power is concentrated on the largest scales. Some of the dependencies on the strength of the magnetic field, the power law index of the magnetic power spectrum, the small scale cut-off, and the offset of the observer position from the middle-plane, are discussed below.

For a diffuse source distribution, any value of the magnetic field strength, between G and G can provide a reasonable fit to the observed energy spectrum, for a single power-law injection spectrum . This is illustrated in Fig. 1, for the above two extreme values of . We note that the observed energy spectrum is well approximated by a power-law in the range EeV [9]. The difference in indices between the injected and the propagated spectrum in Fig. 1 results from the diffusion of UHECRs combined with energy losses [4, 5, 6]; in our present case, UHECRs with energies greater than EeV propagate in nearly straight lines, in which case the energy spectrum is unaffected by magnetic deflection, while UHECRs of lower energies diffuse. The interplay between propagation in the magnetic field and energy losses leads to a spectrum that is softer than the injection spectrum in the diffusive regime, but not in the rectilinear regime. This leads to reasonable fits of the UHECR spectrum above EeV. We emphasize that limiting the injection to an upper cut-off EeV would not change the spectral shape below EeV.
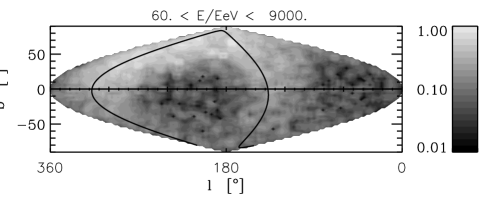
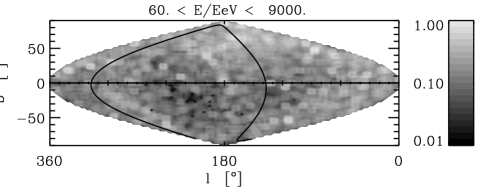
The angular distributions associated with these simulations are shown in Figs. 2, and 3, plotted in Galactic coordinates, for EeV. These images are averaged over different spatial realizations of the magnetic field inside the Local Supercluster. For the case of strong fields and large coherence lengths, images corresponding to different realizations are very different from each other due to cosmic variance, but cover more than half of the sky, consistent with the isotropy observed by AGASA.
For G, shown in Fig. 2, UHECR arrival directions are strongly clustered around the center of the Local Supercluster, i.e. approximately around the Virgo cluster, at , . Since AGASA recorded no event out of 47 for EeV within of this point, which is furthermore located near the peak of the AGASA exposure curve, one would exclude this scenario to a high degree of confidence. However, we note that radio-galaxies in the Supercluster seem to distribute rather uniformly with radius, i.e. there is no preferred center [15]. If the UHECR sources were to follow radio-galaxies, the sky distribution would be more isotropic, and further statistics would be needed to discriminate this scenario (see also below).
For a field strength G, the correlation with the Supergalactic plane disappears, as shown in Fig. 3. This effect is not trivial, as all UHECR sources in our scenario are located within the Supergalactic plane. Note as well that the resulting angular image in Fig. 3 reveals spikes of UHECR events even though the source is diffuse. These spikes are produced by magnetic lensing and give rise to small scale clustering. As we quantify below, we find that the amplitude of clustering depends on the spectrum of magnetic inhomogeneities; namely, for a scale-invariant spectrum , the spikes are much less pronounced. This is expected [16, 5], as the magnetic power in that case is concentrated on small spatial scales, whereas for the Kolmogorov spectrum, the power is concentrated on large scales.

In Fig. 4, we show the histogram of events plotted vs. Supergalactic latitude; this figure clearly illustrates the relative anisotropy of a scenario with G, with a distribution of sources strongly centered around Virgo, and the relative isotropy of a scenario with G. A similar plot for the observed AGASA events is given in Refs. [9].
Observational tests. A turbulent magnetic field of strength G in the Local Supercluster is not unrealistic [17]; it roughly corresponds to the expected equipartition value , where , , and respectively denote the temperature, baryon density and critical density [1]. The above scenario thus reopens a window for conventional astrophysical sources as origin of UHECRs, provided that such sources can indeed accelerate protons up to EeV [8]. In the following, we give several predictions and tests of the present scenario.
The most direct test would be to detect and measure a permeating magnetic field in the Local Supercluster, or at least obtain a trace of its presence via the observation of synchrotron emission. In this respect, we note the positive detection of a bridge of synchrotron emission in the plane of the Coma/Abell 1367 supercluster [18], which lends further support to our scenario. Unfortunately, synchrotron data does not yield the strength of the magnetic field, and measurements of Faraday rotation of polarized light from sources located in the Local Supercluster are needed to this end.
Our model predicts large-scale anisotropy, whose amplitude is expected to increase with energy above the pion production threshold, because of decreasing magnetic deflection, and because sources located beyond the Supergalactic plane, that we neglected here, and that would tend to make the distribution more isotropic, do not contribute for EeV [19]. We quantify this anisotropy in terms of dipole and quadrupole moments, assuming that there is full sky coverage, as planned for the Pierre Auger Observatory [10]. For instance, the detection of 64 events above EeV, corresponding to one year of one site of the Pierre Auger Observatory, would allow to detect anisotropy with a false alarm risk of 5% (resp. 1%) in % (resp. %) of cases if G, and in % (resp. %) of cases if G, where the ranges given correspond to variation of the source distribution, coherence length, , and observer position. These statistics are limited by the finite number or events, not by cosmic variance. We find that the anisotropy strongly decreases with increasing radius of the source distribution, and with increasing magnetic field strength. Finally, we emphasize that a correlation of UHECR statistics with Supergalactic latitude is not a proper measure of the predicted anisotropy when G, because this correlation starts to differ from the isotropic prediction only for EeV (see also Fig. 4).
Finally, the observation of a repeated number of clusters of UHECRs with arrival directions compatible within the angular resolution of future instruments will also allow to constrain severely the present model. A strong magnetic field leads to an almost isotropic arrival direction distribution on large angular scales. At the same time, magnetic lensing, illustrated in Ref. [5] in the case of a point source, leads to significant small scale clustering. Overall, for any source distribution the probability for clustering of UHECRs in the presence of a magnetic field is higher than for an isotropic arrival direction distribution, and (of course) smaller than in the absence of magnetic fields with point-like sources.
| AGASA prob.(%) | PAO prob.(%) | |
|---|---|---|
| (isotropic) | 0.29 | |
| 0.05 | ||
| 0.5 |
We quantify this in Table I by comparing clustering probabilities for our scenario and for a completely isotropic distribution, in two cases: in the first, we give probabilities corresponding to the numbers of UHECR events and clusters observed by the AGASA experiment [9]. To this end we simulated the finite angular resolution and sky coverage of the AGASA experiment, and calculated the probability of repeated occurences (multiplets). We call a multiplet a cluster of events such that all events fall within of the first event detected. In the second case, we give an example for numbers of multiplets that would strongly discriminate our scenario against uniform source distributions with much weaker magnetic fields, for one year of the Southern Pierre Auger site, assuming angular resolution. The range of values given corresponds to variation of the source density profile, , coherence length, and position of the observer.
These numbers indicate that the preference for strong fields increases with exposure. We also found that clustering increases with decreasing , with increasing radius of the source density profile, and with the coherence length of the field. Within our model, a rather coherent field, with power on the largest scales, such as a Kolmogorov spectrum is thus favored. Note that for a less diffuse source distribution with less abundant but more powerful sources, these probabilities would be larger. Our scenario, however, predicts the absence of correlations between the UHECR clusters and powerful sources associated with the large scale structure. This can be used to discriminate it also against models with highly structured source distributions and negligible magnetic fields [19]. A somewhat larger number of clusters and/or higher multiplicity than in Tab. I would rule out our scenario, e.g., for a cluster of nine events out of 64 showers above EeV, and G, the confidence level is %.
Acknowledgments. We warmly thank the late David Schramm for constant encouragement and collaboration in earlier work. We acknowledge P. Blasi and A. Olinto for discussions. We are grateful to the Max-Planck Institut für Physik, München (Germany), and the Institut d’Astrophysique de Paris, Paris (France), for providing CPU time. This work was supported, in part, by the DoE, NSF, and NASA at the University of Chicago.
REFERENCES
- [1] D. Ryu and P. L. Biermann, Astron. Astrophys. 335 (1998) 19; see also P. Blasi, S. Burles and A. V. Olinto, Astrophys. J., in press (1999) e-print astro-ph/9812487.
- [2] P. P. Kronberg, Rep. Prog. Phys. 57 (1994) 325.
- [3] J. P. Vallee, Fund. Cosm. Phys. 19 (1997) 1.
- [4] J. Wdowczyk and A. W. Wolfendale, Nature 281 (1979) 356; M. Giler, J. Wdowczyk, and A. W. Wolfendale, J. Phys. G 6 (1980) 1561; V. S. Berezinsky, S. I. Grigor’eva, and V. A. Dogiel, Zh. Eksp. Theor. Fiz. 96 (1989) 798 [Sov. Phys. JETP 69 (1989) 453].
- [5] G. Sigl, M. Lemoine, and P. L. Biermann, Astropart. Phys. 10 (1999) 141.
- [6] P. Blasi and A. V. Olinto, Phys. Rev. D 59 (1999) 023001.
- [7] G. Medina Tanco, Astrophys. J. 505 (1998) L79.
- [8] J. P. Rachen and P. L. Biermann, Astron. Astrophys. 272 (1993) 161; C. A. Norman, D. B. Melrose, and A. Achterberg, Astrophys. J. 454 (1995) 60; M. Ostrowski, Astron. Astrophys. 335 (1998) 1340; E. Boldt and P. Ghosh, Mon. Not. Roy. Astron. Soc., in press (1999) e-print astro-ph/9902342.
- [9] M. Takeda et al., Phys. Rev. Lett. 81 (1998) 1163; e-print astro-ph/9902239, submitted to Astrophys. J.
- [10] J. W. Cronin, Nucl. Phys. B (Proc. Suppl.) 28B (1992) 213; The Pierre Auger Observatory Design Report (2nd ed.) 14 March 1997.
- [11] G. Sigl and M. Lemoine, Astropart. Phys. 9 (1998) 65.
- [12] M. Lemoine, G. Sigl, A. V. Olinto, and D. N. Schramm, Astrophys. J. 486 (1997) L115; G. Sigl, M. Lemoine and A. V. Olinto, Phys. Rev. D 56 (1997) 4470.
- [13] M. A. Lawrence, R. J. O. Reid, and A. A. Watson, J. Phys. G Nucl. Part. Phys. 17 (1991) 733.
- [14] D. J. Bird et al., Phys. Rev. Lett. 71 (1993) 3401; Astrophys. J. 424 (1994) 491; ibid. 441 (1995) 144.
- [15] P. A. Shaver and M. Pierre, Astron. Astrophys. 220 (1989) 35.
- [16] E. Waxman and J. Miralda-Escudé, Astrophys. J. 472 (1996) L89.
- [17] R. M. Kulsrud, R. Cen, J. P. Ostriker and D. Ryu, Astrophys. J. 480 (1997) 481.
- [18] K. T. Kim, P. P. Kronberg, G. Giovannini, and T. Venturi, Nature 341 (1989) 720; see also T. A. Ensslin, P. L. Biermann, U. Klein and S. Kohle, Astron. Astrophys. 332 (1998) 395.
- [19] E. Waxman, K. B. Fisher, and T. Piran, Astrophys. J. 483 (1997) 1.