13(13.25.5, 08.14.1, 08.09.2 1E1743.1–2843)
and observations of the Galactic Bulge source 1E 1743.1-2843
Abstract
We report the results of and observations of the X–ray source 1E 1743.1–2843, located in the region of the galactic center, performed between 1993 and 1998. Observations spanning almost twenty years show that 1E 1743.1–2843 is a persistent X–ray source, most likely powered by accretion onto a compact galactic object. The absence of periodic pulsations and the relatively soft X–ray spectrum favour a Low Mass X–ray Binary containing a neutron star. However, no Type I X–ray bursts have been observed in more than 650 ks of observations, leaving other interpretations possible.
keywords:
X–Rays – Individual: 1E1743.1–28431 Introduction
The source 1E 1743.1–2843 was discovered during the first soft X–ray imaging observations of the galactic center region obtained with the Einstein Observatory (Watson et al. 1981). Its column density ( cm-2) is one of the highest observed in the X–ray sources of this region of sky, suggesting a distance similar or even greater than the galactic center. To power the observed luminosity 10 erg s-1 accretion onto a compact object is clearly required. Contrary to many other X–ray binaries in the galactic center region that are characterized by transient activity, 1E 1743.1–2843 is a persistent source, that has been detected in all the observations carried out up to now (Watson et al. 1981, [Skinner et al. 1987], Kawai et al. 1988, Sunyaev et al. 1991, Pavlinsky et al. 1994, Lu et al. 1996).
We have recently obtained a long pointing centered on 1E 1743.1–2843 in the context of our survey of the galactic center region with the satellite (Sidoli et al. 1998a). In addition, several other and serendipitous observations of this source are available, spanning the years from 1993 to 1998.
2 Observations and Data Analysis
In Table 1 we summarize the and observations of 1E 1743.1–2843 used in this work.
In addition to the 70.4 ks long pointing obtained on April 13-15, 1998,
for which 1E 1743.1–2843 was the main target (S4),
four other observations
are available: one pointed on the galactic center
(SgrA West, 100 ks) and
three shorter ones pointed at different locations along the galactic
plane in order to map the Sgr B2 molecular cloud.
Our analysis of the observations is based on data obtained with
the MECS instrument (Boella et al. 1997).
The MECS instrument consists of three position-sensitive
gas-scintillation proportional counters providing images in the
1.3–10 keV energy range within a field of view of 56’ diameter,
and with an angular resolution of 1’ (50% power radius of
75” at 6 keV, on-axis).
The MECS energy resolution is 8.5%
FWHM.
After the failure of MECS1 in May 1997, only two units are available.
The satellite (Tanaka, Inoue & Holt 1994) observed the region of sky containing 1E 1743.1–2843 several times. provides simultaneous data in four coaligned telescopes, equipped with two solid state detectors (SIS) and two gas scintillation proportional counters (GIS). However, since in most of these observations 1E 1743.1–2843 lies at large off-axis angles, only the GIS instruments, with a larger field of view (44’ diameter), provide useful data. 1E 1743.1–2843 was within the SIS field of view only in the observation performed on September 19, 1995. These data were analyzed to search for the presence of spectral features, exploiting the superior energy resolution of the CCD based detectors (FWHM 2% at 6 keV).
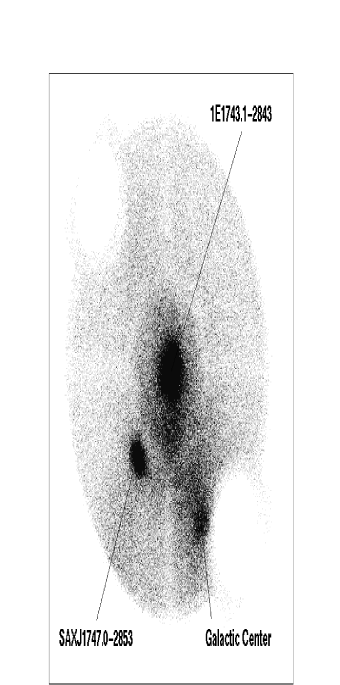
The image centered on 1E 1743.1–2843, obtained with the MECS
in April 1998, is shown in Fig. 1.
It is evident that 1E 1743.1–2843 lies in a region of diffuse emission,
associated both with the molecular cloud SgrB2
and with SgrA (Koyama et al. 1996; Sidoli et al. in preparation).
The fainter source 13’ to the SE of 1E 1743.1–2843 is SAX J1747.0–2853,
a transient low mass X–ray binary (Sidoli et al. 1998b).
The coordinates of 1E 1743.1–2843 derived with the MECS
are ,
(J2000) with an uncertainty of 1’. These are fully
consistent with those determined with the Einstein Observatory
(Watson et al. 1981).
| Obs.n. | Start date | Exposure | Count ratea | Off-axis | 2-10 keV Fluxb |
|---|---|---|---|---|---|
| time (ks) | (counts s-1) | angle (’) | (10-10 erg cm-2 s-1) | ||
| A1 | 30 Sep 1993 | 18.2 | 0.30 | 16 | 2.5 |
| A2 | 01 Oct 1993 | 18.5 | 0.40 | 15 | 2.6 |
| A3 | 01 Oct 1993 | 17.5 | 0.46 | 16 | 2.5 |
| A4 | 02 Oct 1993 | 19.5 | 0.71 | 17 | 2.6 |
| A5 | 15 Sep 1994 | 76.5 | 0.34 | 15 | 2.9 |
| A6 | 22 Sep 1994 | 55.2 | 0.40 | 18 | 2.9 |
| A7 | 24 Sep 1994 | 18.7 | 0.48 | 18 | 3.6 |
| A8 | 19 Sep 1995 | 64.4 | 0.54 | 6 | 1.1 |
| S1 | 05 Apr 1997 | 47.7 | 0.13 | 23 | 1.9 |
| S2 | 24 Aug 1997 | 99.6 | 0.14 | 21 | 2.0 |
| S3 | 03 Sep 1997 | 50.7 | 0.08 | 19 | 1.1 |
| S4 | 13 Apr 1998 | 70.4 | 0.38 | 0 | 1.6 |
| S5 | 26 Aug 1998 | 78.6 | 0.24 | 11 | 1.9 |
aIn GIS2 or MECS3, not corrected for vignetting.
bUnabsorbed flux of blackbody best fit model, corrected for vignetting.
2.1 Spectral Analysis
To study the source spectrum we concentrated mainly on the observation pointed on 1E 1743.1–2843 (S4), and on the one with SIS data (A8), in which we investigated the possible presence of emission lines.
To minimize the contamination from the diffuse emission we extracted the MECS2 and MECS3 counts within a small radius of 2’ from the source position. The spectra were then rebinned in order to have at least 20 counts per bin. The background spectrum was estimated from an annular region surrounding the source. In fact the standard MECS background spectra obtained from blank field observations underestimate the actual background present in the galactic center region. As can be seen in Fig. 1, 1E 1743.1–2843 lies in a region where the background due to the diffuse emission increases toward the direction of the galactic center. Our choice to use a circular corona is an effective way to estimate the likely background value at the source position. We verified that our main conclusions reported below do not vary significantly by extracting the background only from the northern or the southern half of the corona (i.e. respectively by slightly underestimating or overestimating the contribution of the diffuse emission).
A fit with an absorbed power law (photon index 2.2, absorbing column density NH cm-2) was unacceptable, yielding a reduced =1.49 (for 178 d.o.f.). A thermal bremsstrahlung gave a slightly better fit (=1.24) with temperature kT9 keV and NH cm-2. The observed 2–10 keV flux was erg cm-2 s-1, for both the power law and bremsstrahlung cases. A good description of the 1E 1743.1–2843 spectrum could be obtained with a blackbody model (=1.01 for 178 d.o.f.). The best fit parameters are kT=1.8 keV, NH=1.3 1023 cm-2 and flux 1.6510-10 erg cm-2 s-1 (2-10 keV, corrected for absorption). Taking into account the uncertainties resulting from the background subtraction, these parameters vary in the range kT1.7–1.9 keV, N(1.2–1.4)1023 cm-2.


The other four observations, as well as the GIS data provided spectra of lower quality, due to the off-axis position of 1E 1743.1–2843 and to the lower counting statistics. Their analysis gave results consistent with those of obs. S4, without evidence for spectral variations. The fluxes reported in Table 1 were therefore computed assuming for all the observations the best fit blackbody model.
During the September 1995 observation (A8), 1E1743.1-2843 was only 6’ off
axis and therefore within the field of view of all instruments.
The two SIS were working in 4 CCD mode with a time resolution of 16
seconds: the data were filtered with standard criteria,
including the
rejection of hot and flickering pixels and the event grade (0,2,3 and 4)
selection.
We extracted the source spectra from circular regions of
radius 2.5’, slightly smaller than usual, in order to extract source events
from the same CCD chip (S0C2 and S1C0) and to reduce the
background contribution.
The background spectra were extracted from source free regions of the
instruments during the same observation.
This procedure yielded more than 8000 counts for SIS0 and few less for
SIS1, with a background contribution of 12% of the total.
To improve the signal to noise ratio of our spectra we grouped the 512 original
channels into only 128 bins.
In the fits we ignored the
channels below 2 keV, where the background intensity was comparable to
that of the source itself.
After having created the appropriate response matrices (using SISRMG
v1.1 and ASCAARF v2.72), we fitted the spectra with the three single
component
models used for the data analysis.
Again, the results
indicate a thermal nature of the spectra (Fig. 3): the power law
fit ( 2.2, 2.3 cm-2)
and the thermal bremsstrahlung fit
(kT 8.3, 2.1 cm-2) yielded higher
values than the blackbody model, whose best fit parameters
(kT 1.65, 1.5 cm-2)
are similar to those obtained with the MECS,
except for the normalization.
In fact, the
SIS data (September 1995) yielded a flux about a factor two lower than
that observed with in April 1998.
Taking advantage of the better energy resolution available with the SIS,
we searched for the presence of iron line features. We obtained
negative results: though the limited statistics does not allow to
exclude the presence
of a broad line, we could put an upper limit of 100 eV on the
equivalent
width of a line narrower than the SIS resolution in the 6.4–7 keV energy
range.
2.2 Timing Analysis
The background subtracted light curves of 1E 1743.1–2843 obtained during all the and observations are presented in Fig. 4 and Fig. 5. Some variability on a time scale of hours is clearly visible during observations A5, A8 and S4. Note that the count rates of Fig. 4 and 5 are not corrected for vignetting effects resulting from the different off-axis angles. This causes most of the apparent variability between the different observations visible in the figure, but nevertheless the source does vary considerably. As it is shown in Table 1, the averaged and vignetting corrected fluxes of all the observations are not consistent with a constant value, but instead considerable variations up to a factor of 2 occur between different observations.
| Observation | Upper limits (99% c.l.) | |||||
|---|---|---|---|---|---|---|
| 20000 s | 10000 s | 103–102 s | 10–2 s | 1 s–200 ms | 100–10 ms | |
| (%) | ||||||
| A1–A4 | 42 | 21 | 11 | 11 | 11 | – |
| A5 | 55 | 30 | 10 | 10 | 10 | – |
| A6–A7 | – | 90 | 27–13 | 15 | 15 | – |
| A8 | 40 | 17 | 9 | 9 | 9 | – |
| S1 | 80 | 19 | 9 | 9 | 11–14 | 14–20 |
| S2 | 43 | 14 | 7 | 8 | 9 | 15 |
| S3 | 93 | 18 | 13 | 13 | 16–28 | 30–40 |
| S4 | 26 | 7 | 5 | 5 | 8–13 | 14–30 |
| S5 | 36 | 12 | 7 | 8 | 14 | 15–30 |


For each observation and detector, we searched for periodic modulations in the X–ray flux of the source using a Fourier analysis. In order to increase the search sensitivity we merged the data from contiguous observations: A1, A2, A3 and A4 as well as A6 and A7. For each data set, after converting the arrival times to the Solar System barycenter, we accumulated light curves binned at 5 ms and calculated a single power spectrum, correcting for the background, over the whole observation following the method outlined by Israel & Stella (1996). No significant periodicity was found in any of the power spectra at a 99% confidence level. In Table 2 we report the corresponding upper limits on the source pulsed fraction for selected values of the period.
We also looked for the presence of X-ray bursts, by examining the light curves binned at time resolutions of a few seconds, but no bursts were found. Though it is difficult to derive quantitative upper limits for such a kind of analysis, we note that a typical Type I X–ray burst with a peak luminosity close to the Eddington limit would have produced in 1E 1743.1–2843 an easily detectable count rate increase of a factor of a few hundreds.
3 Discussion
With the lack of an optical identification, which is hampered by the high interstellar absorption and the relatively large error region (ROSAT did not detect this source due to the high column density, see [Predehl & Truemper 1994] ), we must discuss the nature of 1E 1743.1–2843 only on the basis of its X–ray properties.
The first important thing to consider is the high column density derived
from the spectral fittings.
We notice that the X-ray source(s) at the position of the galactic center,
at an angular distance of only 16’ from 1E 1743.1–2843,
has N71022 cm-2 (Sidoli et al. 1998c).
Also the nearby (13’) LMXRB SAX J1747.0–2853 has a value of
N81022 cm-2. A likely distance of
the order of 10 kpc is indicated
by its persistent flux as well as by the peak luminosity during a Type I burst
(Sidoli et al. 1998b).
It is therefore very likely that also 1E 1743.1–2843 is at a distance
of at least several kiloparsecs, and is possibly close to (or even beyond) the
galactic center.
The resulting luminosity of 21036d
erg s-1
immediately rules out models involving coronal or wind emission from
normal stars, and strongly favours the presence of an accreting
compact object.
Kawai et al. (1988) suggested that 1E 1743.1–2843 could be a massive
binary system similar to Vela X-1 or GX301-2, and that part of the
measured absorption could be intrinsic. Instead, we believe that the
absence of coherent pulsations (and/or eclipses) and the relatively soft spectrum
are in favour of a low mass X-ray binary.
The observed variability is also compatible with such an interpretation.
We note in passing the striking similarity of the variability
pattern observed in
September 1994 and 1995 and in April 1998
(see the light curves A5 and A8 of Fig. 4 and S5 of Fig. 5).
Unfortunately, the available data are too
sparse to establish a possible orbital periodicity as the cause of
the observed variability pattern.
Most LMXRB containing neutron stars are characterized by the occurrence of Type I X–ray bursts. Up to now no bursts have been detected from 1E 1743.1–2843 despite it being active and repeatedly observed for over 20 years. The and observations reported here provide a total effective exposure of 656 ks, in which no bursts have been detected from 1E 1743.1–2843. Many other observations of this region of sky obtained in recent years with imaging detectors failed to detect bursts from this source (for instance the ART-P instrument collected 820 ks of data, Pavlinsky et al 1994). If 1E 1743.1–2843 is indeed a LMXRB, the lack of bursts is remarkable also because the most likely luminosity of this source (1036–1037 erg s-1) is in the typical range of X–ray bursters. The lack of bursting activity in LMXRB of higher luminosity is generally ascribed to the stable burning of H and He which occurs at luminosities close to the Eddington limit (Fujimoto et al. 1981). Such a high luminosity would require that 1E 1743.1–2843 is at a distance greater than several tens of kiloparsecs.
Finally, we cannot exclude that 1E 1743.1–2843 is an extragalactic source seen through the Galactic plane, which is similar to the case of GRS 1734–292 ([Marti et al. 1998]). An examination of the maps of the NVSS, NRAO VLA Sky Survey ([Condon et al. 1998]), did not reveal any possible radio counterpart at the position of 1E 1743.1–2843 with flux at 20 cm greater than 50 mJy. However, considering the wide range of X–ray to radio flux ratios observed in Active Galactic Nuclei, the lack of a radio counterpart similar to that observed for GRS 1734–292 does not exclude the possibility of an extragalactic origin for 1E 1743.1–2843.
Acknowledgements.
This research has made use of data obtained through the High Energy Astrophysics Science Archive Research Center Online Service, provided by the NASA/Goddard Space Flight Center.References
- [1] Boella G., Chiappetti L., Conti G., et al., 1997, A&AS 122, 327
- [Condon et al. 1998] Condon, J. J., Cotton, W. D., Greisen, E. W., Yin, Q. F., Perley, R. A., Taylor, G. B. & Broderick, J. J. 1998, AJ, 115, 1693
- [2] Fujimoto M.Y., Hanawa T. and Miyaji S. 1981, ApJ 246, 267
- [3] Israel, G.L. & Stella, L., 1996, ApJ, 468, 369
- [4] Kawai N. et al., 1988, ApJ 330, 130
- [5] Koyama K. et al. 1996, PASJ 48, 249
- [6] Lu F.J. et al. 1996, A&ASS 115, 395
- [Marti et al. 1998] Marti, J., Mirabel, I. F., Chaty, S. & Rodriguez, L. F. 1998, A&A, 330, 72
- [7] Pavlinsky M.N., Grebenev S.A., & Sunyaev R.A. 1994, ApJ 425, 110
- [Predehl & Truemper 1994] Predehl, P. & Truemper, J. 1994, A&A, 290, L29
- [8] Sidoli L. et al., 1998a, in ”The Active X-ray Sky - Results from and RXTE”, Nuclear Physics B (ProcSuppl.) 69/1-3, 88.
- [9] Sidoli L., Mereghetti S., Israel G.L., Cusumano G., Chiappetti L., & Treves A., 1998b, A&A 336, L81.
- [10] Sidoli L. et al., 1998c, in Proc. of ”3rd INTEGRAL Workshop”, Taormina Sept. 1998, in press
- [Skinner et al. 1987] Skinner, G. K., Willmore, A. P., Eyles, C. J., Bertram, D. & Church, M. J. 1987, Nature, 330, 544
- [11] Sunyaev R.A. et al. 1991, A&A 247, L29
- [12] Tanaka Y., Inoue H. & Holt S.S. ,1994 , PASJ 46, L37
- [13] Watson M.G. et al. 1981, ApJ 250,142