A simple model of cooling neutron stars with superfluid cores: comparison with observations
Abstract
Cooling of neutron stars (NSs) with superfluid cores is simulated taking into account neutrino emission produced by Cooper pairing of nucleons. Two cooling regimes of NSs composed of matter with the same moderately stiff equation of state are studied: the standard cooling (for a star, as an example) and the cooling enhanced by the direct Urca process (for a star). The critical temperatures of neutron and proton superfluidities, and , are assumed to be constant over the NS core, and treated as free parameters. They are constrained using the surface temperatures of isolated NSs (RX J0822-43, PSR 1055-52, 1E 1207-52, Vela, Geminga, PSR 0656+14, RX J0002+62), obtained by interpretation of observed thermal radiation either with black body spectrum or with hydrogen atmosphere models.
The temperatures given by the “atmospheric” interpretation for the last five objects can be explained by cooling of the same NS, with the same and for all objects. The confidence regions of and are rather narrow and depend on cooling regime. Standard cooling requires moderately strong neutron and proton superfluidities, while enhanced cooling requires moderate neutron and strong proton superfluidities. Adopting interpretation of observations with the black body spectrum, we can propose similar explanation only for three last objects. For the both, standard and enhanced, cooling regimes the confidence regions of , appear to be wider than in the case of the “atmospheric” values of and consist of two separate subregions. None of the models requires simultaneously strong neutron and proton superfluidities ( K), which is an argument against very soft equations of state in the NS cores.
1 Introduction
According to current theories, neutron stars (NSs) are born hot, and then gradually cool. The first – yr cooling proceeds via neutrino emission from the NS core, but later it goes via photon surface emission. Cooling depends on NS internal structure. Thus, comparison of cooling theory with observational data on NS surface temperatures enables one, in principle, to explore NS structure, particularly, properties of superdense matter in the NS cores. Among various properties of this matter, the critical temperatures of neutron and proton superfluidities, and , are of special interest. These quantities are sensitive to parameters of strong nucleon–nucleon interaction in superdense matter closely related to the main “mystery” of NSs, the equation of state in their cores (soft, moderate or stiff?). The softer equation of state, the weaker nucleon–nucleon repulsion at small separations, and the stronger is nucleon superfluidity (i.e., higher and ). The superfluidity affects the NS heat capacity and neutrino emission, and thus the stellar cooling. The aim of the present article is to continue our studies (e.g., Levenfish & Yakovlev 1996 and references therein) of cooling of NSs with superfluid cores. As in our previous articles, we assume, for simplicity, that the NS cores consist of neutrons (), with admixture of protons () and electrons ().
Superfluidity was introduced into the cooling theory by Tsuruta et al. (1972). However, it has not been regarded as a powerful cooling regulator for a long time, and it has been taken into account in a simplified manner (as discussed, for instance, by Levenfish & Yakovlev 1996). Page and Applegate (1992) were the first who emphasized the importance of superfluidity in cooling of massive NSs, where enhanced neutrino reactions of the direct Urca process are allowed:
| (1) |
The authors showed that the surface temperature of such a star was almost solely determined by the values of or in its core (they assumed the superfluidity of one nucleon species) in a wide interval of stellar ages, – yr. This means that NSs are good “thermometers” of nucleon superfluidity. Moreover, the superfluidity appears to be a powerful regulator of standard cooling of less massive NSs (see, e.g., Page 1994, Levenfish & Yakovlev 1996) determined by much weaker neutrino reactions of the modified Urca-processes
| (2) |
and the nucleon-nucleon scattering
| (3) |
where is a nucleon ( or ).
NS cooling is also greatly affected by neutrino emission due to direct interband transitions of nucleons whose dispersion relation contains a superfluid gap (Schaab et al. 1997, Page 1998, Yakovlev et al. 1998):
| (4) |
This process can be treated as neutrino generation due to Cooper pairing of (quasi)nucleons. It has been included into the cooling theory quite recently. Thus, previous cooling calculations have to be reconsidered.
Theoretical conclusion on the importance of superfluidity in NS cooling was made at about the same time when new observational data on NS surface temperatures appeared. Below we present new cooling calculations (Sect. 2) and compare them with observations (Sect. 3).
2 Cooling calculations
2.1 Cooling models
Our cooling simulations have been described by Levenfish & Yakovlev (1996). Here we point out some details. We use the models of NSs whose cores are composed of matter with moderately stiff equation of state proposed by Prakash et al. (1988) (the version with the compression modulus MeV and with the symmetry energy suggested by Page & Applegate 1992). The maximum NS mass, for a given equation of state, is . In order to study the enhanced and standard cooling we consider NS models with two masses . In the first case , the NS radius is km, and the central density g/cm3, while in the second case , km, and g/cm3. The adopted equation of state allows the direct Urca process to operate at densities g/cm3. Thus the NS suffers the enhanced cooling: the powerful direct Urca process (1) is allowed in a small central kernel of radius 2.32 km and mass , in addition to all the neutrino processes (2)–(4) operating in the entire core. On the other hand, the critical density is not reached in the NS, and the star has the standard neutrino luminosity determined by the processes (2)–(4). Notice that while composing the equation of state in our previous cooling calculations the parameter (saturation baryon number density) has been set equal to 0.165 fm-3. In the present simulations, we set fm-3. That is why the NS mass for the enhanced cooling models is slightly different from that adopted earlier ().
Numerous microscopic calculations of Cooper pairing in the NS cores (which use different models of nucleon–nucleon interaction and manybody theories; see, e.g., Takatsuka & Tamagaki 1997 and references therein) predict a very large scatter of superfluid critical temperatures of neutrons and protons, and (– K), and their different density dependence. Therefore we will make a simplified assumption that the critical temperatures and are constant within the stellar core and can be treated as free parameters. This is the main simplification of the present article. Let us assume that the proton superfluidity is produced by the singlet-state () pairing, while the neutron superfluidity is due to the triplet-state () pairing with zero projection of total Cooper–pair momentum onto quantization axis. We will study cooling for different and , and determine those and which are in better agreement with observations.

The heat capacity and neutrino luminosity in the reactions (1)–(3) in the superfluid NS cores have been calculated as prescribed by Levenfish & Yakovlev (1996), while the luminosity in the reaction (4) has been taken from Yakovelv et al. (1998). We have also incorporated the neutrino luminosity of the NS crust due to bremsstrahlung emission by electrons which scatter off atomic nuclei (using an approximate formula proposed by Maxwell 1979). The NS heat capacity has been determined as a sum of the capacities of , and in the stellar core; we have neglected the heat capacity of the crust due to the smallness of the crust mass in our NS models. While calculating the neutrino luminosity and heat capacity the effective masses of neutrons and protons in stellar matter, and , have been set equal to 0.7 of their bare masses.

As in our previous articles, we have used the NS cooling code based on the approximation of isothermal interior. The effects of General Relativity on NS structure and cooling have been incorporated explicitly. The isothermal approximation is justified for a NS of age – yr, when the internal thermal relaxation is over, and only a narrow layer of the outer NS crust is non-isothermal. In the isothermal region the quantity (which can be treated as the internal temperature corrected due to the local gravitational redshift) is constant at any moment of time . Here, is the real local temperature, is the dimensionless gravitational potential, and is a radial coordinate.
The photon NS luminosity depends on the effective local surface temperature . The relationship between and the internal temperature is determined by thermal insulation of the outer stellar envelope. We have ignored the effect of magnetic fields on NS cooling, and have used the relationship , obtained recently by Potekhin et al. (1997) for . We assume that the NS may possess a thin surface layer (of mass ) of hydrogen or helium. This layer cannot affect thermal insulation and cooling but can change spectrum of thermal emission. The effect of dipole surface magnetic fields G on NS cooling is not large (Shibanov & Yakovlev 1996). Therefore our calculations can be applied, at least qualitatively, for the NSs with such magnetic fields. In these cases, means the mean effective surface temperature which determines the total photon NS luminosity (non-redshifted), where is the Stefan–Boltzmann constant.
2.2 Effect of neutrino emission produced by Cooper pairing of nucleons
The main difference of the present simulations from our previous ones is in including the neutrino emission (4) due to Cooper pairing of nucleons. The process was suggested by Flowers et al. (1976) and independently by Voskresensky & Senatorov (1987), but it has been included into the cooling simulations only recently (see above). The reaction rates have been recalculated and improved by Yakovlev et al. (1998). As shown by the latter authors, neutrino emission produced by proton pairing is strongly suppressed due to numerical smallness of weak vector neutral currents of protons. The importance of the process for standard and enhanced NS cooling is illustrated in Figs. 1 and 2.
It has been widely recognized that the superfluidity onset at the neutrino cooling stage slows down the standard cooling. As seen from Fig. 1, superfluidity, on the contrary, can accelerate the cooling. The acceleration can be so large that by the end of the neutrino era the surface temperature falls below the value it would have for the enhanced cooling. This conclusion does not apply to the cases of purely proton superfluidity (proton pairing produces weak neutrino emission), and strong purely neutron superfluidity (neutrino emission due to neutron pairing dominates over the standard neutrino processes (2) and (3) only for K, see Yakovlev et al. 1998).
Neutrino emission due to pairing of neutrons affects also enhanced cooling of NSs with superfluid protons at (Fig. 2). In these cases, the proton superfluidity appears in the NS much earlier than the neutron one, and it has enough time to reduce the direct Urca process by the beginning of the neutron pairing. Therefore a splash of neutrino emission due to the neutron pairing appears to be quite substantial; the cooling does not slow down, as it would be without Cooper neutrinos, but strongly speeds up.
2.3 Results
We have calculated about 2000 cooling curves which give the dependence of the effective NS surface temperature (as detected by a distant observer, being the gravitational radius) on age . For and we have and 0.786, respectively. The critical temperatures of neutrons and protons in the NS cores have been varied in a wide interval from to K, compatible with the scatter predicted by microscopic theories (see Sect. 2.1).
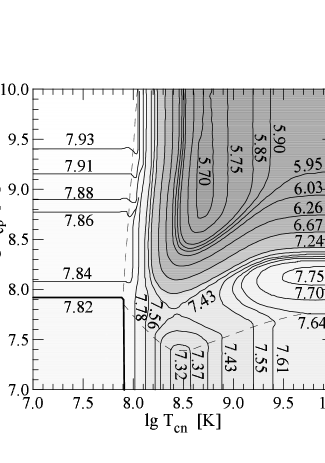
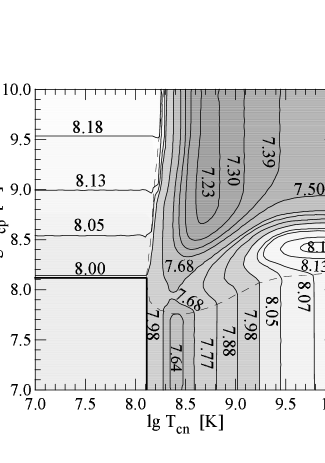
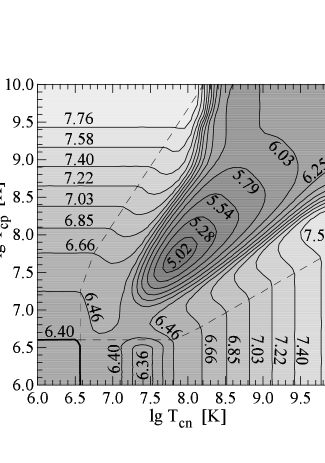
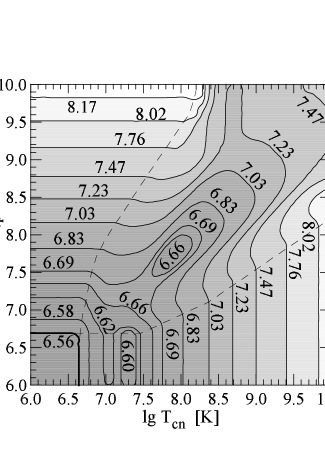
Cooling curves for some selected values of and are presented in Figs. 1 and 2. However it is inconvenient to analyse the results in the form of the cooling curves. It is more convenient to plot those values of (), which lead to a selected surface temperature of the NS at given age . Figures 3–6 are arranged in this manner. For example, we have chosen the values of which correspond to the ages of the Geminga pulsar ( yr, Figs. 3 and 5) and PSR ( yr, Figs. 4 and 6). Observational data on these and other cooling NSs are given in Sect. 3.
In order to simplify understanding of the figures let us outline the main properties of the heat capacity and neutrino emission from superfluid NSs (see Levenfish & Yakovlev 1996, Yakovlev et al. 1998, and references therein). The heat capacities of and constitute, respectively, and of the total heat capacity . Thus a strong proton superfluidity reduces by , while a strong neutron superfluidity reduces it by about 4 times. If the ratio of the inner temperature to the critical nucleon temperature in a cooling NS falls down from 0.3 to 0.1, the heat capacity of nucleons or decreases more than by three orders of magnitude, and becomes much lower than the heat capacity of electrons. Further reduction of the heat capacity of nucleons does not affect the total heat capacity. The appearance of a weak superfluidity of nucleons almost doubles their heat capacity due to the latent heat release at the phase transition. The heat capacity of nucleons remains higher than the heat capacity of normal nucleons when decreases from 1 to 0.3, i.e., as long as the difference of temperature logarithms is .
The effects of superfluidities of and on the neutrino reactions are also different. For the reactions (1)–(3) the difference is small. If we neglected neutrino emission due to Cooper pairing of nucleons the asymmetry of Figs. 3–6 with respect to the inversion of axes would be mainly explained by different contributions of and into the heat capacity. Cooper-pairing neutrinos noticeably amplify the asymmetry: the neutrino emission due to pairing of is weak, while the emission due to pairing of dominates over the standard neutrino energy losses at K and over the direct Urca process at . The main energy release in the process occurs while decreases from 0.96 to (when the difference of temperature logarithms is ).
Finally let us mention that for the enhanced cooling
the transition from the neutrino
to photon cooling stages
occurs somewhat later than for the standard cooling.
In a nonsuperfluid NS
which undergoes the standard cooling the neutrino era lasts
(1–3) yr.
A strong neutron superfluidity decreases
by a factor of 2–3, while a strong proton
superfluidity decreases by about
(20–30).
If the both superfluidities, and , are strong at once
yr.
| lg lg | 5.02 5.28 5.54 5.79 6.03 6.25 6.36 6.40 6.46 6.56 6.58 6.60 6.62 4.50 4.60 4.70 4.80 4.90 5.00 5.05 5.07 5.10 5.15 5.16 5.17 5.18 |
| lg lg | 6.66 6.69 6.83 6.85 7.03 7.22 7.23 7.40 7.47 7.58 7.76 8.02 8.17 5.20 5.22 5.29 5.30 5.40 5.50 5.51 5.60 5.64 5.70 5.80 5.95 6.03 |
| lg lg | 5.70 5.75 5.85 5.90 6.95 6.03 6.26 6.67 7.23 7.24 7.30 7.32 4.77 4.79 4.83 4.85 4.87 4.90 5.00 5.20 5.49 5.50 5.53 5.54 |
| lg lg | 7.37 7.39 7.43 7.50 7.55 7.61 7.64 7.68 7.70 7.75 7.77 7.82 5.57 5.58 5.60 5.64 5.67 5.70 5.72 5.74 5.75 5.78 5.79 5.82 |
| lg lg | 7.84 7.86 7.88 7.91 7.93 7.98 8.00 8.05 8.07 8.13 8.14 8.18 5.83 5.84 5.85 5.87 5.88 5.91 5.92 5.95 5.96 5.99 6.00 6.02 |
Enhanced cooling
Figures 3 and 4 illustrate
enhanced cooling of NSs of ages of the Geminga and
PSR pulsars, respectively (see Table 2 below).
Figure 3 shows isotherms of the internal temperature of a NS of the Geminga’s age versus and . Since is strictly related to the surface temperature these lines are also isotherms of (Table 1). Dashes show auxiliary lines which enclose the region of the joint superfluidity of nucleons. The region to the left of the upper dashed line corresponds to superfluidity of protons and normal neutrons, while the region to the right of the lower line corresponds to superfluidity of neutrons and normal protons. The dashed lines intersect at the isotherm of temperature K, to which a nonsuperfluid star would cool down at moment . This isotherm, plotted by the thick line, encloses the region where the nucleon superfluidity has not appeared by moment and does not affect the cooling. Notice that owing to General Relativity effects isotherms correspond to somewhat higher local temperatures of matter (see above). Thus, the isotherm K is associated with the values of which are slightly higher than .
First of all we discuss the behaviour of isotherms to the right of the lower auxiliary line. The vertical parts of isotherms reveal that NS cooling is governed by the only superfluidity of . With increasing at , the core temperature grows up which can be explained like this. The higher , the earlier the neutron superfluidity appears; accordingly the powerful direct Urca process is suppressed earlier, cooling delay is longer, and the NS is hotter at given . For low , the NS cools down in a nonsuperfluid state the main part of its history, and is sufficiently cold at age . The neutrino luminosity of such a star is rather weak and becomes comparable to the photon luminosity. Additional neutrino energy losses due to neutron pairing at slightly accelerate the cooling at . However at the acceleration is compensated by the latent heat release produced by the jump of the neutron heat capacity. The values 0.7 and 0.5 have been explained in the beginning of this section.
Vertical parts of isotherms intersect the auxiliary line at temperatures , at which the proton superfluidity appears. With further increase of , a newly born proton superfluidity slightly decreases the neutrino luminosity which is already reduced by the strong neutron superfluidity. The main effect will be caused by the heat capacity of protons which jumps up. The latent heat release will increase : in a strip of width 0.5 (in ) above the lower dashed line the isotherms shift to the left. With further growth of the heat capacity is strongly reduced, the NS becomes cooler and the isotherms shift to the right.
In a similar fashion, exchanging proton and neutron superfluidities, we can explain horizontal parts of the isotherms to the left of the upper auxiliary line. In this case NS cooling in the range does not appear because of the weakness of the neutrino emission produced by proton pairing. Strong proton superfluidity suppresses the heat capacity weaker than neutron superfluidity with the same critical temperature. Therefore, at high the star is warmer than for the same at vertical parts of isotherms in the lower right part of the figure.
The horizontal parts of the isotherms intersect the upper auxiliary line at temperatures which switch on the neutron superfluidity. This superfluidity induces the latent heat release and associated slight NS heating (dips on isotherms to the right of the auxiliary line). With increasing the NS heating produced by neutron superfluidity decreases and disappears (the dips vanish). The effect is caused by the neutrino emission due to neutron pairing which is more pronounced if the direct Urca process is strongly suppressed. At high the neutron pairing becomes the main neutrino emission mechanism. Since the neutrino emission due to neutron pairing is more efficient than the latent heat release the appearance of the neutron superfluidity with the growth of does not delay the cooling but, on the contrary, accelerates it. A noticeable NS cooling via Cooper-pairing neutrinos, takes place in a strip of width 0.7 (in ) to the right of the upper dashed line. Lower and to the right of this strip the cooling is associated with the reduction of the neutron heat capacity.
Now consider the region of , between the auxiliary lines in more detail. Some increase of at and is caused by the latent heat release at onset of weak superfluidity of and . Further growth of induces initially rapid decrease and then weak increase of . The decrease is explained by exponential reduction of the heat capacity by the joint superfluidity of and while the weak increase is associated with reduction of the direct Urca process at early cooling stages.
Figure 4 is analogous to Fig. 3,
but corresponds to a younger NS of age yr.
Comparing Figs. 3 and 4 we see
that one should have or
to support high surface temperature (or )
for a longer time.
Standard cooling
Standard cooling of a NS is illustrated in
Figs. 5 and 6 for the stars of
Geminga and PSR ages, respectively.
Isotherms are qualitatively different from
those for enhanced cooling
(cf. with Figs. 3 and 4):
even an approximate symmetry of the neutron and proton
superfluidities is absent. The asymmetry is attributed to
the weakness of the standard neutrino energy losses.
First, in the absence of such a powerful cooling regulator as
the direct Urca process the difference
of the heat capacities of and (see above) is more pronounced.
Second, Cooper-pairing neutrino emission becomes
more important on the background of the weaker neutrino emission
produced by other neutrino reactions; Cooper-pairing emission
is asymmetric itself being more efficient for neutrons
than for protons.
If the superfluidity is absent, a NS () enters the photon cooling stage at yr. Thus the PSR pulsar appears at the transition stage and Geminga is at the photon stage. The neutrino luminosity is already weak and superfluidity affects the cooling mainly either through the heat capacity or through the Cooper-pairing neutrino emission.
Consider, for instance, Fig. 5. Two dashed auxiliary lines enclose the domain of joint superfluidity of nucleons. To the left of the upper line protons are superfluid and neutrons not, while below the lower line only neutrons are superfluid. The lines intersect at the isotherm of the temperature , which a nonsuperfluid NS would have at age . The superfluidity with and has not appeared by moment and does not affect the cooling.
Horizontal parts of isotherms to the left of the upper dashed line show that cooling is regulated by the proton superfluidity alone. At K the superfluidity appears just before given moment and is weak. In the range it initiates the latent heat release and a weak increase of . At higher the proton heat capacity is reduced, and the total NS heat capacity decreases by . On the other hand, for high , the proton superfluidity onset is shifted to the neutrino cooling stage. The cooling delay produced by suppression of the neutrino luminosity in the neutrino era is somewhat stronger than the cooling acceleration produced by the effect of superfluidity on the heat capacity. Thus continues its growth with increasing .
Horizontal parts of isotherms end at temperatures K, at which the neutron superfluidity is switched on. The neutron pairing induces a splash of neutrino emission and cooling acceleration in a strip of the width 0.7 (in ) to the right of the auxiliary line. The minimum of takes place in the interval –, because at the neutrino energy losses are partly compensated by the latent heat release. The lowest temperatures are realized at K, when the nucleon heat capacity suffers the strongest suppression.
| Source | [yr] | Model [K] Confidence level Reference | |||||
|---|---|---|---|---|---|---|---|
| RX J0822-43 | 3.57 | Hydrogen atm. 95.5% Zavlin et al. (1999b) Black body 95.5% Zavlin et al. (1999b) | |||||
| 1E 1207-52 | 3.85 | Hydrogen atm. 90% Zavlin et al. (1998) Black body 90% Zavlin et al. (1998) | |||||
| RX J0002+62 | Hydrogen atm. 95.5% Zavlin et al. (1999a) Black body 95.5% Zavlin et al. (1999a) | ||||||
| PSR 0833-45 (Vela) | Hydrogen atm. 90% Page et al. (1996) Black body — Ögelman (1995) | ||||||
| PSR 0656+14 | 5.00 | Hydrogen atm. — Anderson et al. (1993) Black body 90% Possenti et al. (1996) | |||||
| PSR 0630+178 (Geminga) | 5.53 | Hydrogen atm. 90% Meyer et al. (1994) Black body 90% Halpern, Wang (1997) | |||||
| PSR 1055-52 | 5.73 | Black body — Ögelman (1995) | |||||
|
|||||||
On vertical parts of isotherms below the lower dashed line the cooling is regulated by the neutron superfluidity alone. With growing in this domain the temperature varies in a different manner than with growing in the domain of the purely proton superfluidity. This happens because at the neutrino emission due to the neutron pairing is important. It speeds up NS cooling in the range (see above). If 7.9 + 0.5 the neutrino cooling is partly compensated by the latent heat release. Therefore the minimum of takes place in the interval . It is not so deep as in the upper part of Fig. 5 since the nucleon heat capacity is suppressed only partly.
A strong neutron superfluidity reduces the heat capacity stronger and the neutrino luminosity weaker than a strong proton superfluidity. Owing to the weakness of the neutrino energy losses this difference is sufficient for a NS with high and normal to cool in a different way than at equally high and normal . Strong neutron superfluidity delays the cooling of those NSs which would be at the neutrino cooling stage or at the neutrino-photon transition stage in case they were nonsuperfluid. This is demonstrated in Fig. 6 (for PSR); in the absence of superfluidity, at yr this pulsar would be at the transition stage. Strong neutron superfluidity accelerates cooling of older NSs, e.g., of the Geminga’s age (Fig. 5).
Vertical parts of isotherms in Fig. 5 intersect the auxiliary line at temperatures , at which the proton superfluidity appears. This superfluidity leads to the latent heat release and to the growth of in a strip of width 0.5 in above the lower dashed line. With further growth of the heat capacity is strongly reduced and cooling is accelerated. For a very strong joint superfluidity of and ( K, K, the very right upper corner of Fig. 5), the nucleon heat capacity and the neutrino luminosity of the NS core are fully suppressed, and the cooling is governed by the electron heat capacity.
3 Comparison of calculations and observations
3.1 Observations and their interpretation
By now, thermal X-ray radiation has been detected from seven isolated NSs (Table 2). All the sources are reliably identified. Four of them (Vela, Geminga, PSR 0656+14 and PSR 1055-52) are radiopulsars. The other three NSs (1E 1207-52, RX J0002+62 and RX J0822-43) are radio silent, but are observed as point-like sources of soft X-rays in supernova remnants. Their identification as isolated NSs is confirmed by observations of coherent pulsations of X-ray emission with NS-spin periods (excluding 1E 1207-52) and smooth (modulation depth ) light curves, and also by small ratios of the optical to X-ray luminosities, which are not typical for accreting NSs in binaries.

As a rule, an X-ray spectrum from an isolated NS contains two components. The spectrum of the softer component is similar to the black body spectrum for a temperature – K. According to the cooling theory, the surface of a middle-aged NS, – yr, should have about the same temperature. It is assumed, therefore, that the main contribution into the soft component comes from the thermal surface emission. The hard component is associated either with a thermal emission from hot polar caps on the pulsar surface (heated by an inverse current of energetic particles from the magnitosphere) or with a non-thermal magnetospheric emission.
The thermal NS radiation is often fitted by the black body spectrum. However, the interpretations based on the spectra, which are obtained by modelling of the NS atmospheres, are more realistic. At the same effective temperature the black body spectrum appears to be softer. Therefore, while interpreting the same observations, the “black body” temperature is noticeably (typically, by a factor about 1.5–3) higher than the “atmospheric” temperature.
Construction of the atmosphere models in a practically important range of temperatures and surface magnetic fields has not been completed yet. Only the hydrogen-helium and iron atmosphere models with weak magnetic fields G are really reliable as well as the hydrogen-helium models with strong fields ( G) for K. If these conditions are fulfilled, the thermal radiation spectrum and the NS light curves are better described by the atmospheric model than by the black body model. Physical parameters inferred from atmospheric interpretations (radiating surface area, distance to a NS, column density of interstellar gas, etc.) are in better agreement with the data obtained from independent observations in other wavelengths (see, e.g., Page et al. 1996, Zavlin et al. 1998, 1999a,b). The black body interpretation often gives less realistic values of the parameters and meets some difficulties in explaining all sets of observational data.
In Table 2 the NSs, the sources of the thermal emission, are ordered according to their ages. For every NS, we present its age, the method of interpretation of thermal radiation, and the effective surface temperatures obtained by a given method. For the pulsars, we present the dynamic ages, while for the radio silent objects we give the ages determined from the associated supernova remnants. Although the values of and (and, therefore, of the gravitational redshift) used in our models (Sect. 2) differ slightly from those obtained (or adopted) from interpretation of observations, the temperatures from Table 2 can be compared with our cooling calculations due to the following reasons. First, our calculations are not very sensitive to variations of NS mass or radius (see Sect. 3.3 below). Second, the confidence ranges of and/or , obtained (adopted) from interpretation of observations, include, as a rule, our theoretical values.
Among the atmospheric interpretations presented in Table 2, the results for 1E 1207-52, RX J0002+62, RX J0822-43 and for the Vela pulsar seem to be more reliable. The advantage of interpretation of their spectra by the hydrogen-helium atmosphere models is additionally confirmed by the fact that fitting of observations by the iron atmosphere models or by the black body spectrum is of lower statistical significance. The Geminga and PSR 0656+14 pulsars are older and cooler. The important contribution into the spectral opacity of their atmospheres should come from the effects of motion of neutral and partly ionized atoms across magnetic fields (Potekhin & Pavlov 1997, Bezchastnov et al. 1998). However, only approximate atmosphere models have been used for interpretation so far, in which these effects have been ignored. The presence of the hydrogen atmosphere of the Geminga pulsar is additionally confirmed by a possible discovery of the proton cyclotron line in the optical spectrum (Bignami et al. 1996, Martin et al. 1998). The “atmospheric” temperatures of the Geminga and PSR 0656+14 pulsars are likely to be closer to the reality than the black body temperatures, but less reliable than for younger NSs.
We will assume that the atmospheric and black body interpretations are equally possible and analyze the values of and which can be inferred from these data.
3.2 Necessity of superfluidity for interpretation of observations
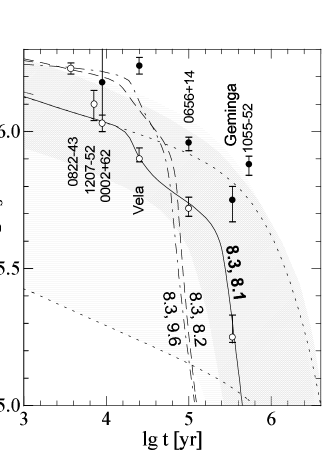
In Fig. 7 the cooling curves are compared with the data of Table 2. Diagonal and horizontal shadings show the ranges of the surface temperature filled, respectively, by different standard and enhanced cooling curves calculated by varying and from to K. Dashes show cooling of nonsuperfluid stars.
The “nonsuperfluid” curves are seen to be in poor agreement with observations. On the other hand, the observations can be explained by assuming superfluidity in the NS cores. This is illustrated (Fig. 7) by the standard cooling curve (the solid line). The values of and are chosen in such a way to hit the maximum number of observational points at once.
According to Fig. 7, all the “atmospheric” temperatures as well as the “black body” temperatures of RX J0002+62, PSR 0656+14 and Geminga hit the allowed regions of the standard and enhanced cooling of superfluid NSs. Thus our cooling calculations can be compared with the “atmospheric” and “black body” temperatures of these sources.
High black body surface temperatures of RX J0822-43, 1E 1207-52 (not presented in Fig. 7, but given in Table 7), Vela, and PSR 1055-52 are not explained by our models but can be explained by other models of cooling NSs, including the models with superfluid cores. For instance, observations of the Vela pulsar agree with the standard cooling of a superfluid NS ( K, K) possessing an outer envelope of mass composed of light elements (Potekhin et al. 1997). High black body temperatures of RX J0822-43, 1E 1207-52 and PSR 1055-52 may indicate the presence of some additional reheating mechanism inside these sources (see, e.g., Umeda et al. 1993) or the presence of superstrong ( G) magnetic fields (Heyl & Hernquist 1997). Finally, one cannot exclude the possibility that the black body interpretation of their spectra is incorrect (see above).
3.3 Results
As seen from Fig. 7, by assuming the presence of nucleon superfluidity in the NS cores, we can explain the majority of NS observations either by standard or by enhanced NS cooling. These observations include six “atmospheric” interpretations (RX J0822-43, 1E 1207-52, RX J0002+62, Vela, PSR 0656+14, Geminga) and three “black body” ones (RX J0002+62, PSR 0656+14, Geminga). For simplicity, we assume that the internal structure of these NSs is the same, and, particularly, the NSs have the same mass. Then the critical temperatures of nucleons in their cores are the same. Let us analyse the confidence regions of and constrained by observations. Including observations of several NSs allows us to reduce these regions.
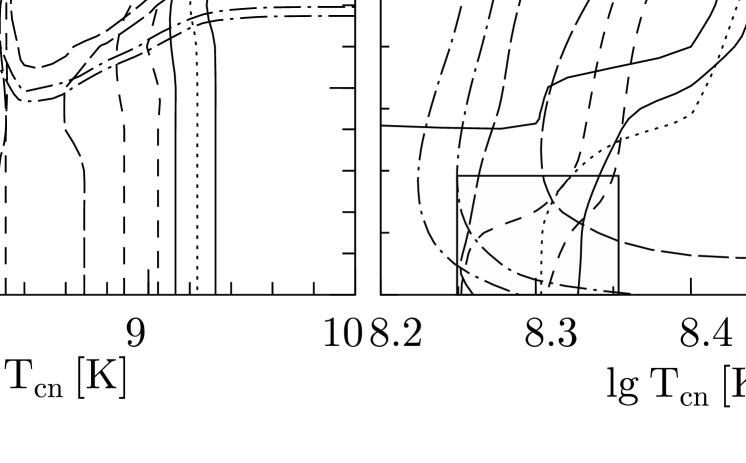
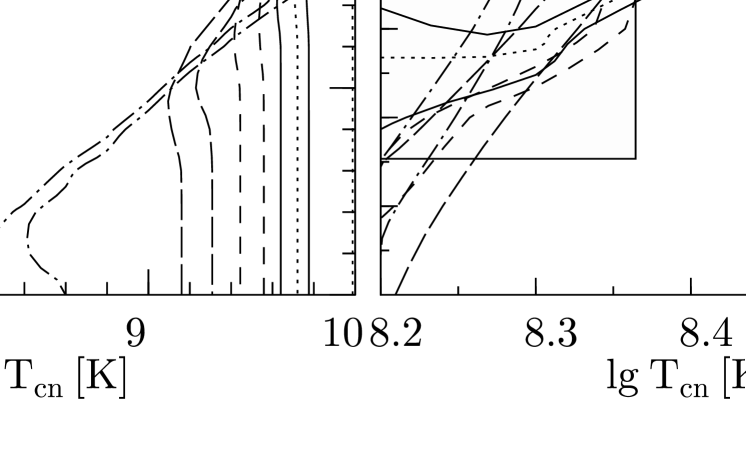
The regions in question are plotted in Figs. 8–10. Figure 8 corresponds to the standard and enhanced cooling of NSs (with masses and , respectively) with the black body spectrum. Figure 9 corresponds to the enhanced cooling of the stars () possessing hydrogen atmospheres. Finally, the standard cooling of NSs () with hydrogen atmospheres is shown in Fig. 10. In every figure, the lines of different type enclose the confidence regions of and associated with the error bars of the observed NS surface temperatures (Table 2). Correspondence of the lines to the selected NSs is displayed in Fig. 8. For the PSR 0656+14 and Geminga pulsars, isotherms are taken from Figs. 3–6. In each figure the actual overall confidence region of and lies at the overlap of the confidence regions of all objects.
Figures 8–10 show that observations of several NSs at once can be explained either by the standard or by the enhanced cooling, adopting either black body or atmospheric interpretations of the spectra. In all the cases there are the ranges of and close or joint for all NSs; they do not contradict to the microscopic theories of nucleon superfluidity in NSs (see Takatsuka & Tamagaki 1997 and references therein).
According to the left panel of Fig. 8, by adopting the enhanced cooling and the black body interpretation of observations we obtain two confidence regions of and ; each explains cooling of three objects at once. The first region corresponds to a moderate neutron superfluidity () and a strong proton superfluidity (); the second, wider region corresponds to a strong neutron superfluidity (–10.0) and a moderately weak proton superfluidity (). For the standard cooling of a NS with the black body spectrum (the right panel of Fig. 8) there are also two regions of and for the three NSs, but they are somewhat different than for the enhanced cooling. The first region corresponds to a moderate neutron superfluidity (–8.1) and a moderately strong proton superfluidity (–), while the second one is associated with a strong neutron superfluidity () and a moderately weak proton one ().
In the case of the enhanced cooling and the “atmospheric” surface temperatures (Fig. 9) there is the only region of joint or very close values of and for five NSs (the shaded rectangle on the right panel). It corresponds to a moderate neutron superfluidity (–8.35) and a strong proton superfluidity (–9.65). This superfluidity () allows us to describe the sixth object from the “atmospheric” set (RX J0822-43), if we assume that it possesses a thermally insulating envelope of light elements with the mass equal to (see Fig. 7). However even in the absence of the envelope the confidence region of and for this object is sufficiently close to the joint confidence region indicated above.
Finally, for the standard cooling and the “atmospheric” spectrum (Fig. 10), there is again the only confidence region of and , where the critical temperatures are nearly the same for the five NSs; it corresponds to a moderately strong superfluidity of and (–8.35, –8.4, shaded rectangle). The observations of RX J0822-43 can also be explained by the presence of the same superfluidity (, ) assuming that the object possesses an envelope of light elements of the mass (see Fig. 7). In the absence of the envelope, the confidence region of and lies outside of the joint confidence region since the error bar of for this object is situated at the boundary of the shaded region (filled by the cooling curves of superfluid NSs).
Therefore, the constraints on the critical temperatures and depend on cooling type and on interpretation of the NS thermal radiation. The fact that the NSs have actually different masses has little effect on our results as long as we assume that and are independent of density. The standard cooling curves of NSs with masses lower than the threshold mass (of switching on the direct Urca process) practically coincide. The same is true for the enhanced cooling curves of NSs () as long as their cores contain a moderate or strong superfluidity of and/or with K. With weakening of the superfluidity the difference between enhanced and standard cooling curves increases reaching maximum for nonsuperfluid NSs.
The existence of the same critical temperatures for several NSs at once is quite unexpected. We have expected different joint confidence regions of and for different pairs of NSs. The result is even more surprising taken into account simplicity of our cooling models. It would be interesting to confirm (or reject) these results using advanced cooling models and a larger number of objects.
As a whole, one needs stronger superfluidity of at least one nucleon species for the enhanced cooling models. In the case of the black body interpretation of NS radiation, the stellar cores may contain a strong neutron superfluidity, – K. In neither case one needs strong superfluidity of and simultaneously to explain the observations. This indicates that the equation of state of the NS cores cannot be too soft (the softness would mean weak nucleon–nucleon repulsion at small separations which would induce especially strong pairing).
Finally let us mention that we can satisfy observations by varying the only parameter, , if we assume the presence of neutron superfluidity with – K. For the standard cooling, this parameter should lie in the moderate range – K, while for the enhanced cooling it should be larger, – K.
4 Conclusions
Our results show that cooling of NSs is very sensitive to superfluid state of neutrons and protons in their cores. This confirms the possibility (Page & Applegate 1992) to explore the nucleon superfluidity in the NS cores, the fundamental property of matter of supranuclear density, from NS cooling. Our calculations confirm also that the neutrino emission due to nucleon pairing plays important role in NS cooling.
We have used the simplified NS models with two fixed masses, and , and nucleon critical temperatures constant over the stellar cores. Even in this case we have been able to explain the majority of observations of the thermal radiation from Vela, Geminga, PSR 0656+14, RX J0002+62, 1E 1207-52 by four models: by the standard or enhanced cooling of NSs using the black body or “atmospheric” interpretations of their spectra. For every model, we have obtained its own, sufficiently constrained confidence regions of the critical temperatures and .
Our results are preliminary. For obtaining more reliable conclusions on superfluidity and equation of state in the NS cores, one needs new cooling simulations (for different model equations of state and nucleon critical temperatures taking into account variation of and over the NS cores), new high-quality observations of NS thermal emission and new atmospheric models for interpretation of observations.
We are grateful to G.G. Pavlov and V.E. Zavliv
for providing us with the data on
RX J0822-43 and RX J0002+62 prior to publication.
The work is partly supported by the grants
of RFBR (96-02-16870a), DFG-RFBR (96-02-00177G) and INTAS (96-0542).
References
-
Anderson S.B., Córdova F.A., Pavlov G.G., Robinson C.R., Thompson R.J. ApJ, 1993, 414, 867.
-
Bezchastnov V.G., Pavlolv G.G., Ventura J. Phys. Rev. 1998, A58, 180.
-
Bignami G.F., Caraveo P.A., Mignani R., Edelstein J., Bowyer S. ApJ (Lett.) 1996, 456, L111.
-
Craig W.W., Hailey Ch.J., Pisarski R.L. ApJ 1997, 488, 307.
-
Flowers E.G., Ruderman M., Sutherland P.G. ApJ 1976, 205, 541.
-
Halpern J., Wang F. ApJ 1997, 477, 905.
-
Heyl J., Hernquist L. ApJ (Lett.) 1997, 489, L67.
-
Lyne A.G., Pritchard R.S., Graham-Smith F., Camilo F. Nature 1996, 381, 497.
-
Levenfish K.P., Yakovlev D.G. Astron. Lett. 1996, 22, 47.
-
Maxwell O.V. ApJ 1979, 231, 201.
-
Martin C., Halpern J.P., Schiminovich D. ApJ (Lett.) 1998, 494, L211.
-
Meyer R.D., Pavlov G.G., Mészàros P. ApJ 1994, 433, 265.
-
Ögelman H. In: Lives of Neutron Stars (eds. Alpar M.A. et al.), Dordrecht: Kluwer 1995, p. 101.
-
Page D. ApJ 1994, 428, 250.
-
Page D. In: The Many Faces of Neutron Stars (eds. Buccheri R., van Paradijs J., Alpar M.A.). Dordrecht: Kluwer 1998, p. 538.
-
Page D., Applegate J.H. ApJ (Lett.) 1992, 394, L17.
-
Page D., Shibanov Yu.A., Zavlin V.E. In: Röntgenstrahlung from the Universe (MPE Report No.263) (eds. Zimmermann H.U., Trümper J.E., Yorke H.). Garching: Max-Planck Institute für Extraterrestrische Physik 1996, p. 173.
-
Possenti A., Mereghetti S., Colpi M. A&A 1996, 313, 565.
-
Potekhin A.Y., Chabrier G., Yakovlev D.G. A&A 1997, 323, 415.
-
Potekhin A.Y., Pavlov G.G. ApJ 1997, 483, 414.
-
Prakash M., Ainsworth T.L., Lattimer J.M. Phys. Rev. Lett. 1988, 61, 2518.
-
Takatsuka T., Tamagaki R. Progr. Theor. Phys. 1997, 97, 345.
-
Umeda H., Shibazaki N., Nomoto K., Tsuruta S. ApJ 1993, 408, 186.
-
Tsuruta S., Canuto V., Lodenquai J., Ruderman M. ApJ 1972, 176, 739.
-
Shaab C., Voskresensky D., Sedrakian A.D., Weber F., Weigel M.K. A&A 1997, 321, 591.
-
Shibanov Yu.A., Yakovlev D.G. A&A 1996, 309, 171.
-
Voskresensky D., Senatorov A. Sov. J. Nucl. Phys. 1987, 45, 411.
-
Yakovlev D.G., Kaminker A.D., Levenfish K.P. In: Neutron Stars and Pulsars (ed. Shibazaki N. et al.). Tokyo: Universal Academy Press 1998, p. 195.
-
Zavlin V.E., Pavlov G.G., Trümper J. A&A 1998, 331, 821.
-
Zavlin V.E., Pavlov G.G., Trümper J. ApJ 1999a, in press.
-
Zavlin V.E., Trümper J., Pavlov G.G. 1999b (in preparation, to be submitted to ApJ).