Global velocity field and bubbles in the BCD Mrk86
Abstract
We have studied the velocity field of the Blue Compact Dwarf galaxy Mrk86 (NGC 2537) using data provided by 14 long-slit optical spectra obtained in 10 different orientations and positions. This kinematical information is complemented with narrow-band ([OIII]5007Å and H) and broad-band (, , Gunn- and ) imaging. The analysis of the galaxy global velocity field suggests that the ionized gas could be distributed in a rotating inclined disk, with projected central angular velocity of km s-1 kpc-1. The comparison between the stellar, HI and modeled dark matter density profile, indicates that the total mass within its optical radius is dominated by the stellar component. Peculiarities observed in its velocity field can be explained by irregularities in the ionized gas distribution or local motions induced by star formation.
Kinematical evidences for two expanding bubbles, Mrk86–B and Mrk86–C, are given. They show expanding velocities of 34 km s-1 and 17 km s-1, H luminosities of 3 erg s-1 and 1.7 erg s-1, and physical radii of 374 and 120 pc, respectively. The change in the [SII]/H, [NII]/H, [OII]/[OIII] and [OIII]/H line ratios with the distance to the bubble precursor suggests a diminution in the ionization parameter and, in the case of Mrk86–B, an enhancement of the shock-excited gas emission. The optical-near-infrared colours of the bubble precursors are characteristic of low metallicity star forming regions (0.2 Z☉) with burst strengths of about 1 per cent in mass.
keywords:
galaxies: irregular – galaxies: compact – galaxies: individual: Mrk86 – galaxies: kinematics and dynamics1 Introduction
The study of the global velocity field of Blue Compact Dwarf galaxies (BCD hereafter; Thuan & Martin 1981) provides important clues about their gravitational potential, since these systems are rotationally supported (e.g. van Zee et al. 1998).
High spatial resolution HI observations have shown that the rotation curves of Blue Compact Dwarf galaxies (Meurer, Staveley-Smith & Killeen 1998; van Zee et al. 1998) and dwarf irregulars (dI hereafter; Moore 1994; Flores & Primack 1994) are nearly flat in the galaxy outer regions and have nearly constant velocity gradients within their optical radius. Also, optical studies of the velocity field of the ionized gas in BCDs obtain constant velocity gradients, characteristic of a solid-body rotation law (see Petrosian et al. 1997 for I Zw 18).
Although the neutral (see van Zee et al. 1998 and references therein) and molecular hydrogen (Young & Knezek 1989; Israel, Tacconi & Bass 1998) are quite abundant in Blue Compact Dwarfs and dwarf irregulars, they are not enough to reproduce the flattening of the rotation curve. Like in spiral galaxies, the existence of this flattening in the rotation curve of dwarf galaxies has been related with the presence of large amounts of dark matter in galaxy outer regions (Carignan & Freeman 1988; Carignan & Beaulieu 1989; Broeils 1992). The dark matter content derived indicates that dark matter is even more abundant in dwarfs that in more massive galaxies (see Moore 1994 and references therein). In fact, standard cold dark matter (CDM hereafter) models predict that low-mass halos are denser than more massive systems, because their higher formation redshift (Navarro, Frenk & White 1997, NFW hereafter). The density profiles of the simulated CDM halos fall with radius as . This is density profile expected for a flat rotation curve body.
The competition between the dark matter and the stellar mass components within the optical radius difficults the analysis of solid-body portion of the rotation curve. Several works have argued that dark matter in dwarf galaxies dominates the total mass density profile even within their optical radius (Carignan & Beaulieu 1989; Broeils 1992), showing a constant density dark matter core (Moore 1994; Flores & Primack 1994; Salucci & Persic 1997). On the other hand, Lo, Sargent & Young [Lo et al. 1993] and Staveley-Smith, Davies & Kinman [Staveley-Smith et al. 1992] deduced reasonable virial mass to blue light ratios, lower than 7 M☉/L☉, for a large fraction of their samples. Loose & Thuan [Loose & Thuan 1986] found that the virial mass of Haro 2 can be reproduced just adding the stellar and HI mass components. Also the study of Swaters [Swaters 1998] of the rotation curves of 44 dwarf galaxies indicates that the mass of a large fraction of these galaxies could be dominated by the stellar component, even at distances larger than three disk scale lengths.
One of the main sources of uncertainty in all these studies is the mass-to-light ratio adopted for the stellar component (Meurer, Staveley-Smith & Killeen 1998; Swarters 1998). Therefore, high quality optical and near-infrared imaging and spectroscopy in order to obtain the physical parameters of the stellar populations and derive reasonable mass-to-light ratios is mandatory to prevent this inconvenient which is inherent to this kind of kinematical studies.
Superimposed on the regular solid-body portion of the velocity field, peculiar motions of the ionized gas have been observed in many star forming dwarf galaxies (Tomita et al. 1997; Petrosian et al. 1997). They have been commonly explained as infalling motions of HII regions [Saitō et al. 1992], multiple clouds merging [Skillman & Kennicutt 1993] and local peculiar gas motions induced by violent star formation events [Petrosian et al. 1997]. Very high star formation rates associated with these intense star forming events have been demonstrated to be able to produce a cavity of shock-heated gas due to the energy input provided by supernovae and stellar winds (Chevalier & Clegg 1985; Vader 1986, 1987). This hot gas will accelerate the ambient interstellar medium resulting in a collective supernova-driven wind. In fact, several galactic supernova-driven winds phenomenae have been found to be associated with violent star formation places in dwarf galaxies (Roy et al. 1991; Izotov et al. 1996; Martin 1996, 1998, CM98 hereafter). They have been generally detected as holes in the neutral hydrogen distribution (Puche et al. 1992; Brinks 1994), bubbles or shells in H emission (Marlowe et al. 1995, MHW hereafter) or from their hot gas X-ray emission [Bomans, Chu & Hopp 1997].
The existence of these phenomenae could produce the loss of a significant fraction of the galaxy interstellar medium. Depending on the final destination of the accelerated gas, these structures could produce no mass loss, -, only affecting the galaxy chemical evolution, or - processes, with a significant loss of interstellar mass (Young & Gallagher 1990; CM98; Mac Low & Ferrara 1998). Consequently, these supernova-driven galactic winds are accepted to be a key parameter in the dwarf galaxy formation (Silk et al. 1987; Mori et al. 1997) and evolution (MHW; Mac Low & Ferrara 1998).
Blue Compact Dwarf galaxies, with intense recent or ongoing star forming activity, are those systems where the interplay between star formation and the interstellar medium is more feasible to be studied. However, although the majority of the BCD galaxies are iE type BCDs (70 per cent; Thuan 1991), with star formation spreading over the whole galaxy, the effects of the supernova-driven winds have been mainly studied in dwarf amorphous galaxies (see, e.g. MHW), which show nuclear star forming activity.
The galaxy Mrk86=NGC 2537 (Shapley & Ames 1932; Markarian 1969), also known as Arp 6 [Arp 1966], constitutes an excellent laboratory to test the properties and effects of the supernova-driven winds on the interstellar medium of dwarf galaxies, as a nearby prototype of the iE BCD galaxies class.
After introducing Mrk86 in Sect. 2, we describe the observations and data reduction in Sect. 3. Results on the global velocity field of Mrk86 are given in Sect. 4. In Sect. 5.1 we describe the evolutionary synthesis models applied. Then, we show the physical properties of the Mrk86–A (CM98) expanding bubble (Sect. 5.2), and the new bubbles detected Mrk86–B and Mrk86–C (Sect. 5.3 & 5.4). The velocity dispersion measured in Mrk86–C is also discussed in Sect. 6. Finally, summary and conclusions are given in Sect. 7. We have used =50 km s-1 Mpc-1 and =0.5 through this paper.
2 Mrk86
The galaxy Mrk86 ( (1950)= 08h 09m 43s; (1950)= +46° 08′ 33″), as a prototype of the iE type BCD galaxies, is characterized by a smooth elliptical low surface brightness underlying stellar component on which several irregular knots of star formation are superimposed. See Figure 1 for a -band image. Up to 50 different knots have been detected (Gil de Paz et al. 1999, G99 hereafter). In the Figure 2 we show those line-emitting regions with H surface brightness higher than 1.5 erg s-1 cm-2. Assuming a receding velocity of 443 km s-1 (de Vaucouleurs & Pence 1980), the distance to Mrk86 would be 8.9 Mpc and the physical scale 42.9 pc/″. Mrk86 has an absolute magnitude of MB=, and it has been detected on 1.2, 2.8 and 6.3 cm (Klein, Wielebinski & Thuan 1984, Klein, Weiland & Brinks 1991); the galaxy is a source of HI 21 cm emission (Thuan & Martin 1981; Bottinelli et al. 1984; WHISP survey, Kamphuis, Sijbring & van Albada 1996); also it was detected in CO (Verter 1985; Sage et al. 1992); it is a strong IRAS source (Lonsdale et al. 1985; Dultzin-Hacyan, Masegosa & Moles 1990); near-infrared data were obtained by Thuan [Thuan 1983]; optical images were obtained by Hodge & Kennicutt [Hodge & Kennicutt 1983], Loose & Thuan [Loose & Thuan 1985] and Ojha & Joshi [Ojha & Joshi 1991]; and, finally, ultraviolet spectra has been analyzed by Fanelli, O’Connell & Thuan [Fanelli et al. 1988] and Longo et al. [Longo et al. 1991].
Papaderos et al. (1996a, 1996b; P96a & P96b hereafter) obtained the physical parameters of the , and photometric components. These components have been related with three different stellar populations (respectively, currently forming, 1 Gyr and 7 Gyr old; Gil de Paz, Zamorano & Gallego 1998, G98 hereafter).
| Spectroscopic observations | ||||
| Exp. | Slit | Spectral | Disper. | |
| Telescope | time (s) | range(nm) | (Å/pix.) | |
| CAHA 2.2-m | 3600 | 1,2,4,6b | 330-580 | 2.65 |
| CAHA 2.2-m | 1800 | 5b | 330-580 | 2.65 |
| CAHA 2.2-m | 3600 | 1,2,4,5,6r | 435-704 | 2.65 |
| CAHA 2.2-m | 3600 | 3 | 390-650 | 2.65 |
| INT 2.5-m | 1800 | 7,8R | 637-677 | 0.39 |
| INT 2.5-m | 900 | 9R | 637-677 | 0.39 |
| Image observations | ||||
| Exp | Filter | Scale | PSF | |
| Telescope | time (s) | (″/pixel) | (arcsec) | |
| JKT 1.0-m | 600 | 033 | 10 | |
| CAHA 1.5-m | 2400 | 033 | 16 | |
| CAHA 2.2-m | 600 | Gunn- | 027 | 19 |
| INT 2.5-m | 900 | H | 057 | 23 |
| INT 2.5-m | 900 | [OIII] | 057 | 25 |
| UKIRT 3.8-m | 100 | 060 | 14 | |
3 Observations and reductions
We have obtained a total of 14 long-slit optical spectra in 10 different orientations and positions (see Figure 1). Journal of spectroscopic observations is given in Table LABEL:log. Low-intermediate resolution spectra (FWHM=6Å in the light of H) with dispersion 2.65 Å/pixel were obtained with the Boller & Chivens spectrograph at the Cassegrain focus of the 2.2-m telescope at Calar Alto (Almería, Spain) in January 1993. We used a 10241024 Tek 24m CCD. High resolution spectra (FWHM=0.9Å in H and 0.39 Å/pixel; slits #7R, #8R and #9R) were obtained using the IDS instrument at the Isaac Newton Telescope (INT) of the Observatorio del Roque de los Muchachos (La Palma, Spain) in January 1998. The detector was a 10241024 Tek 24m CCD. The spectra were reduced, wavelength and flux calibrated, using standard figaro (January 1993) and IRAF111IRAF is distributed by the National Optical Astronomy Observatories, which are operated by the Association of Universities for Research in Astronomy, Inc., under cooperative agreement with the National Science Foundation. procedures (January 1998), and making use of the corresponding standard stars and lamp calibration spectra. Line fluxes were measured using the IRAF task splot, obtaining errors lower than 15 per cent.
| d (kpc) | (km s-1 kpc-1) | (km s-1 kpc-1) | Slit |
|---|---|---|---|
| Steep/flat comp. | Steep/flat comp. | ||
| 1.03 | 554/83 | 565/83 | #9R |
| 0.85 | 695/182 | 705/192 | #7R |
| 0.73 | 214 | 214 | #2r |
| 0.73 | 225 | 225 | #2b |
| 0.00 | 345 | ||
| 0.12 | 334 | 334 | #4r |
We have also obtained , , and -band images in different observing runs as described in Table LABEL:log. Gunn- band image was obtained at the 2.2-m telescope at Calar Alto in February 1992 with a GEC CCD with 8001156 30m pixels. The Johnson- band image was obtained at the 1.52m telescope at Calar Alto in December 1993 with a 10241024 19m pixels CCD. band image was obtained at the 1-m Jacobus Kapteyn Telescope (JKT) at the Observatorio del Roque de los Muchachos in November 1997 with a 24m 10241024 pixels Tek CCD. Finally, the near-infrared -band image was obtained at the 3.8-m UKIRT telescope at Mauna Kea observatory in April 1993. We used the 6258 InSb array camera IRCAM. Broad band images were reduced using standard MIDAS and IRAF procedures. The procedures described by Aragón-Salamanca et al. [Aragón-Salamanca et al. 1993] were employed for the reduction of the -band near-infrared image. All the broad-band images were calibrated observing standard stars at different airmasses.
Additional narrow-band images were secured for us during service time at the 2.5-m Isaac Newton Telescope at the Observatorio del Roque de los Muchachos in December 1993. The detector was an EEV CCD with 12801180 22.5m pixels. [OIII]5007Å (=5014Å; FWHM=50Å) and on/off H (=6556Å, FWHM=60Å; =6607Å, FWHM=53Å) images were obtained. The continuum subtraction was performed using, respectively for [OIII] and H, the -band and off-H images.
The [OIII] and H images were flux calibrated as follows. First, we convolved the (-; see Table LABEL:log) spectra with the [OIII] filter and the (-) spectra with the H filter (see Table LABEL:log & Figure 1). Then, we collapsed these spectra in wavelength, obtaining the flux calibrated spatial profile of the [OIII] and H emission. Now, we cropped and averaged in the [OIII] and H images those regions covered by the and slits, obtaining the [OIII] and H spatial profiles given by the images. Comparing these spatial profiles with those obtained from the spectra we calibrated both the [OIII] and H images. Finally, these calibration relations were corrected for the sensitivity of the filters at the corresponding wavelength and, in the case of the H emission, from the contribution of the [NII]6548Å and 6583Å lines. The reliability of this method was demonstrated after applying it to all the - and - spectra, obtaining similar results within an error of 10 per cent.
4 Global velocity field
We have obtained the spatial variation of the ionized gas velocities using the long-slit spectra. We have used the rvidlines IRAF task measuring the [OII]3727Å, H, [OIII]4959Å and [OIII]5007Å line velocities for the - spectra, and [OIII]4959Å, [OIII]5007Å, [NII]6548Å, H, [NII]6583Å, [SII]6717Å and [SII]6731Å for the - spectra, weighted with their relative intensities. No significant differences were observed using allowed and forbidden lines separately. Errors in the velocity were estimated there where several emission lines could be measured (see Figure 3).
From the velocities determined in the spectra, and the slit positions given in Figure 1, we have reconstructed a 2D velocity map (see Figure 2) using the IRAF task xyztoim. A careful examination of the interpolated 2D velocity field yield a global solid-body velocity field of maximum velocity gradient =34 km s-1 kpc-1 and orientation PA12° (rotation axis PA78°). The heliocentric velocity measured at the galactic centre, as given by the -band outer isophotes centre, is about 470 km s-1. Although De Vaoucoleurs & Pence [De Vaucouleurs & Pence 1980] gave a median heliocentric velocity of 443 km s-1, a detailed examination of their Fabry-Perot interferogram shows that the velocity close to the galactic center is significantly higher, between 450-460 km s-1.
In Figure 3 we show the velocity profiles measured along the slits #9R, #7R, #2b, #2r, #4b and #4r, those positioned closer to PA=12°. The six panels have been arranged in slit position order, from West to East, where slit #4b is that closely crosses the galactic centre, as defined by the -band outer isophotes ( (1950)= 08h 09m 4256; (1950)= +46° 08′ 338). Northernmost part of the slit is represented at the leftside of each panel.
The panels a) and b) (slits #9R and #7R) show two different velocity components, one very steep gradient and a second flatter velocity gradient. The steeper components seem to be associated with regions of enhanced -band luminosity and relatively high star forming activity (EW100Å), the emission knots #15 ( (1950)= 08h 09m 4117; (1950)= +46° 08′ 451; G99) and #16 ( (1950)= 08h 09m 4100; (1950)= +46° 08′ 430; G99; see Figure 3). This increase in the radial velocity gradient could be due to an enhancement of the mass density over the global mass density distribution, related with the presence of these massive star forming regions. However, a merging with another dwarf galaxy or gas cloud with an independent velocity field, as it has been proposed to explain the velocity field of I Zw 18 [Skillman & Kennicutt 1993] and II Zw 40 [Van Zee et al. 1998], should not be ruled out. In that case, this merging could be responsible for the triggering of the star formation in the emission knots #15 and #16 (G99).
On the other hand, the #9R and #7R flat components and the gradients measured along the slits #2b, #2r and #4r should be related with a more relaxed global velocity field. In Table LABEL:gradients we give these velocity gradients, being the gradients measured along the slits and the values projected to PA=12°, i.e. =(PA12°). Velocities affected by local motions, such as supernova-driven winds (see Sect. 5) have not been included in the calculus of the velocity gradients. From Table LABEL:gradients we see that the flat component of the velocity gradient grows from 10-20 km s-1 kpc-1 in the outer galaxy regions to 34 km s-1 kpc-1 close to the galactic centre.
4.1 Mass density profile
We will assume that the motion of the HII regions which produce the
line-emission observed is due to rotation. The slit #4r was placed
very close (3″) along the galactic equator. Therefore,
we could compare its velocity profile with the radial component of
the circular velocity curve [Binney & Tremaine 1987]. We will parameterize the
mass distribution of the galaxy (stellar and dark matter, and
neutral and molecular hydrogen). We have assumed that the
photometric centre, given by the -band outer isophotes,
coincides with the kinematical centre (see Östlin et al.
1998). In order to compare the velocity curve obtained along the
slit #4r with the radial component of the circular velocity curve
we will adopt the radial velocity measured close to the galactic
center as the sistemic velocity.
Stellar. From the analysis of the surface brightness profiles of 14 Blue Compact Dwarf galaxies, P96a found that these profiles can be fitted using three distinct components, the underlying, plateau and starburst components. Using a numerical deprojection procedure, they obtained the central luminosity densities and scale lengths for these components. G98 estimated the ages for the starburst and underlying components to be, respectively, 1 and 7 Gyr, with one fifth solar metallicity. Then, we have taken the mass-to-light ratios predicted by the Bruzual & Charlot [Bruzual & Charlot 1996] evolutionary synthesis models for these ages and metallicities, under the assumption of instantaneous star formation and using an Scalo IMF [Scalo 1986]. These mass-to-light ratios result in M/LB=0.5 M☉/L☉ for the starburst component and M/LB=2.6 M☉/L☉ for the underlying component. Although quite significant in luminosity, the plateau component represents a very small fraction in mass because its luminosity is produced by regions with star formation more recent than 20 Myr (G99) and mass-to-light ratios lower than M/LB=0.08 M☉/L☉ [Bruzual & Charlot 1996].
Finally, using the parameters given by P96a for the Mrk86 starburst and underlying components we obtain
| (1) | |||
| (2) |
where
=20 atH cm-3
=1.0 kpc
=31 atH cm-3
=0.14 kpc
Neutral hydrogen. If we assume that the HI distribution, as given by the WHISP survey222http://thales.astro.rug.nl/whisp/Database/, falls approximately as an exponential function, and using the same deprojection procedure that for the optical data (see P96a), we obtain
| (3) |
where
0.7 atH cm-3
2.0 kpc
Molecular hydrogen. Sage et al. [Sage et al. 1992] gave a
M(H2)/M(HI) ratio for
Mrk86 of 0.03. Therefore, we can assume negligible the effect of
the molecular hydrogen in the gravitational potential of Mrk86.
Dark matter. Finally, we have considered the effect of the dark matter distribution over the global velocity field. Following the most recent observational works (Salucci & Persic 1997; Flores & Primack 1994; Moore 1994) and the study of Navarro et al. [Navarro, Eke & Frenk 1996] concerning the effects of supernova-driven winds over standard CDM profiles, we have assumed the existence of a central core in our dark matter density profile. Both the density distribution of a modified isothermal sphere (see Binney & Tremaine 1987) and the universal profile given by Burkert [Burkert 1995] include this central core and reproduce reasonably the observations. We have used for this work the simplier modified isothermal profile, also following Mac Low & Ferrara [Mac Low & Ferrara 1998],
| (4) |
Burkert (1995; see also Mac Low & Ferrara 1998) has shown that the central density is related with the scale radius through the expression
| (5) |
Thus, this profile has only one free parameter, .
In Figure 4 we show the total and DM mass density profiles for =0.5 kpc and 3 kpc. In both cases we see that the total mass density profile is dominated by the stellar component within the central 4 kpc.
Now, we could compare the radial component of the circular velocity curve derived from the total density profile with the radial velocity data obtained along the slit #4r, placed close along the galactic equator. However, since the ionized gas emission is produced in several individual HII regions, the projected radial component of the modelized circular velocity will depend on the position of the corresponding HII region.
4.2 Ionized gas geometry
We will compare the velocity data obtained along the equatorial slit #4r with the projection of the rotation curve adopting several geometries.
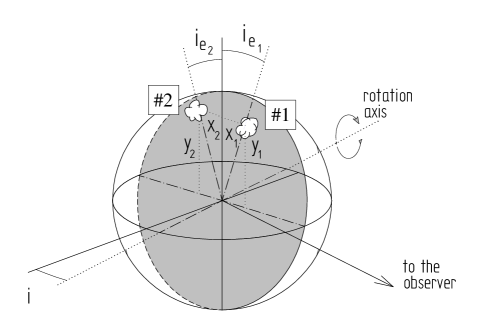
We will assume that the ionized gas is distributed in a thin-disk with inclination . This angle measures the inclination of its rotation axis with regard to the plane of the sky (i.e. =0° for a edge-on disk; see Figure 5). In the Figure 5 we also show how the angles and and the coordinates and describe the position in the disk of an HII region. Under the hypothesis of thin-disk, if 0° only those regions with angle 0° will be observed through the slit #4r. This is the case shown in the Figure 6.
However, if the galaxy would have an inclination close to =0°, HII regions with different position angle, , could be observed through the slit. In this situation, we could observe regions with different radial velocity at the same apparent position (regions #1 & #2 in Figure 5). For example, if we consider the mass density profile given in Sect. 4.1 (with =1 kpc), we could measure changes in the radial velocity of 15 km s-1 between two regions with =0 kpc and =3 kpc for =2.5 kpc (see Figure 5). Therefore, the existence of inhomogeneities in the ionized gas distribution in the galaxy could also produce short scale variations in its velocity field.
The emitting HII regions can have, in principle, any position angle 180°. In fact, a region with a given at present, would evolve toward larger angles in the future. Had all the HII regions be placed in planes of constant angle , the resulting rotation curves would be the ones shown in Figure 7.
From the Figure 4 we see that the stellar mass density component dominates at the inner 4 kpc. However, the radial velocity data can be fitted adopting different geometries for the ionized gas distribution (see Figures 6 and 7). We could reproduce the velocities measured if =0° and 30°70°, or if 40°and =0°.
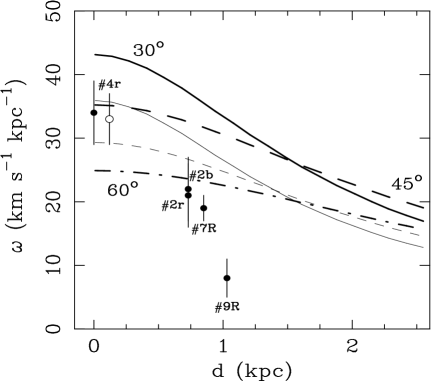
On the other hand, the way the velocity gradient perpendicular to the rotation axis, , decrease from the equator to galactic outer regions (see Table LABEL:gradients) resembles the velocity fields observed in spiral galaxies with intermediate inclination (e.g. Giovanelli & Haynes 1988). We will test this point assuming that the emission observed effectively comes from a rotating thin-disk with gravitational potential that given by the mass distribution described before (Sect. 4.1). Then, using this gravitational potential we have estimated the expected radial velocity gradients for different distances, d, along the rotation axis (see Table LABEL:gradients). In Figure 8 we show the gradients expected, measured as the change in radial velocity of their inner two kiloparsecs. Data points have been taken from Table LABEL:gradients. The value obtained for the slit #9R is very uncertain since the small number of points used to fit its velocity gradient (see Figure 3). The zero value represents the gradient along the galactic equator obtained from the interpolated 2D velocity map. From this figure we note that, although a decreasing in the velocity gradient is effectively observed, we cannot reproduce the values measured. The more feasible explanation is that the ionized gas is probably distributed in a relatively thick-disk. However, the use of a steeper mass density profile could also reproduce the velocity gradients measured (see Figure 8).
Therefore, we conclude that the observed global velocity field of Mrk86 can be reproduced if the stellar component dominates the total mass profile within its optical radius, and if the emitting ionized gas is distributed in a probably thick inclined disk. The inclination of the disk with regard to the plane of the sky will be about 50° (40°).
5 Kinematical evidences for supernova-driven winds
Several under-kiloparsec-scale kinematical structures are observed superimposed on the global velocity gradients previously described. These kind of kinematical disturbances have been widely observed in dwarf galaxies (see Tomita et al. 1997; Petrosian et al. 1997). Different mechanisms could properly explain these disturbances, including infalling motions of HII regions [Saitō et al. 1992] or inhomogeneities in the ionized gas distribution (see Sect. 4). However, in our case, the deep minima (see Figures 3b, 3e, 3f, 12a and 12b) and velocity maximum (Figure 3e) observed are clearly spatially correlated with intense star forming knots, indicating the existence of supernova-driven winds (see Sect. 5.2, 5.3 & 5.4).
5.1 Description of the evolutionary synthesis models
In order to determine the physical properties of the star forming knots, in particular, those associated with supernova-driven wind phenomenae, we have made use of the Leitherer and Heckman (1995; LH hereafter) models. These single burst models do not take into account any contribution from the old underlying population neither that from emission lines (i.e. [OIII]5007Å, H).
Optical and near infrared colours measured in the outer galaxy regions (=0.8, =0.0, =2.5; G98), where the exponential underlying population dominates (P96a), allow to estimate an age of about 7 Gyr (G98 using the Bruzual & Charlot 1996 models) for this underlying component. Assuming different burst-strength values, ranging from 0.001 (0.1 per cent in mass) to 1, we have rebuilt a complete set of LH instantaneous burst models of 0.25 and 0.1 Z☉ metallicities, Salpeter IMF [Salpeter 1955] with m=2.35, Mlow=1 M☉ and Mup=100 M☉. Then, the relation [Kent 1985],
| (6) |
has been applied in order to transform from Johnson- to Gunn- magnitudes. Finally, using the H equivalent widths measured from the spectra, we have corrected the Gunn- magnitudes from H emission.
5.2 Previously detected Mrk86–A bubble
Using long–slit echelle spectra in H+[NII] with 11 km s-1 resolution (FWHM), CM98 inferred the presence of an expanding bubble extending 22″ (940 pc) westward of the galaxy west end. The physical parameters of this bubble are given in Table LABEL:parameters. In Figure 9 we show the A-big bubble region in H and -band. Following CM98, we have taken the knot marked in Figure 9 as Asb (#31 emission knot in G99) as the starburst precursor.
For this region and for the Mrk86–B and C bubble precursors, we have determined physical apertures using the program cobra (G99). This program determines and subtracts the underlying emission. The apertures include those pixels with emission more intense than 1/e times the emission maximum. Optical-nIR colours have been obtained for these apertures and corrected for internal extinction applying the relation given by Calzetti [Calzetti 1997], =0.44 . Using the H-H Balmer decrements and assuming a Mathis [Mathis 1990] extinction law, colour excesses have been obtained. The corrected colours are given in Table LABEL:parameters. These colours allow to estimate the mean physical properties, i.e. age, metallicity and burst strength for these regions. In Table LABEL:parameters we show the physical parameters of the LH model that better fits the colours measured.
In the Mrk86–A case, the colours measured yield a LH model with 0.25 Z☉ metallicity, burst strenght of 1 per cent and age of about 14 Myr (see Table LABEL:parameters). This value is slightly different from the dynamical time deduced by CM98 (converted to =50 km s-1 Mpc-1), that is 12 Myr. This discrepancy could be explained taking into account that describes the age of the expanding bubble, that differs from the starburst age in a time similar to the more massive stars main sequence phase duration. After the red super giant phase has started (4 yr after the starburst for 40 M☉; Maeder 1990), massive stars winds and later supernova explosions would commence to take place and a cavity of shock-heated gas could begin to form.
5.3 Mrk86–B
A local velocity maximum and minimum is observed along the #4b slit velocity profile (see Figure 3e). They differ 68 km s-1 in velocity and are 10″ (430 pc) apart. These features are compatible with the approaching (north lobe) and receding parts (south lobe) of a bipolar expanding structure with a characteristic projected expansion velocity of 34 km s-1. The approaching velocity minimum is also observed in the #4r slit velocity profile (see Figure 3f). Associated with these kinematical features a clear bubble-like structure is observed in the H narrow band image (see Figure 10). Assuming a distance of 8.9 Mpc, a physical size of 750510 pc2 is obtained. This structure resembles those observed in I Zw 18 [Martin 1996], M82 [Heckman et al. 1990] and NGC 1705 (MHW). The difference in size between both lobes could be related with a strong ambient density gradient, with higher density toward the south lobe region.
| A(big)333CM98, converted to =50 km s-1 Mpc-1 | B (N/S lobes) | C | |||||
| RA(B1950) | 08h09m400 | 08h09m423 | 08h09m411 | ||||
| DEC(B1950) | 46°08′250 | 46°08′65 | 46°08′526 | ||||
| (pc) | 944 | 558/190 | 110 | ||||
| (km s-1) | 47 | 40/28 | 17 | ||||
| (Myr) | 12 | 6.5 | 4 | ||||
| dE/dtkin | (erg s-1) | 1.2 | 2.5/0.1 | 8 | |||
| LHα | (erg s-1) | 7 | 0.5/2.5 | 1.7 | |||
| E | 0.30 | (0.13) | 0.16 | 0.73 | |||
| (knot) | 17.12 | 17.77 | 17.65 | ||||
| 0.220.06 | (0.27) | 0.170.08 | (0.19) | 0.130.08 | (0.12) | ||
| 0.040.02 | (0.10) | 0.110.04 | (0.17) | 0.050.04 | (0.00) | ||
| 2.340.09 | (2.29) | 2.10.2 | (2.11) | 1.730.17 | (1.75) | ||
| Burst age | (Myr) | 14.2 | 11.5 | 7.7 | |||
| Burst strength | 0.01 | 0.01 | 0.01 | ||||
| Burst metallicity | (Z☉) | 0.25 | 0.10 | 0.10 | |||
| dE/dtkin | (erg s-1) | 2.2 | 1.4 | 9 | |||
| LHα coliss. | (erg s-1) | 9 | 2.4/1.7 | 2.3 | |||
| Mass | (M☉) | 11 | 6 | 5 |

At 3″ (130 pc) to the NE from the bubble geometrical centre (origin of coordinates in Figure 10) an optical emission knot (#49 in G99) is observed in the , , and bands (Figure 10, left panel). If we compare the instantaneous burst evolutionary synthesis LH models to the colours measured (see Sect. 5.1 and Table LABEL:parameters), considering an age for the old underlying population of 7 Gyr (G98), the best fit obtained yields an starburst age of about 11.5 Myr, a burst strength of 1 per cent and a metallicity of about 0.1 Z☉. We are confident with the instantaneous burst assumption because we are dealing with single star forming regions (LH). From the -band total luminosity, and taking into account the burst strength derived, we estimate the involved total burst mass to be about 6.3 M☉.
Assuming that the kinematical features observed represent the foreground and receding parts of the expanding bubble, the dynamical age for this bubble, obtained as =0.6, will be about 6.5 Myr, quite similar to the evolution time deduced for the starburst region, if we consider the massive stars main sequence time, i.e. about 4-5 Myr, subtracting it from the starburst age (11.5 Myr).
Generally, the H luminosity observed in expanding bubbles is accepted to be produced by photoionization from massive stars of the starburst precursor (MHW; Lehnert & Heckman 1996; Martin 1997). Then, the predicted collisionally excited H contribution should be irrelevant to the total H emission in the expanding lobes. The H luminosities measured for both lobes are L=4.7 erg s-1 and L=2.5 erg s-1. Considering that both lobes are well reproduced by ellipsoids of revolution, we can obtain the lobe surface areas, that allow to estimate the colissionally produced H luminosity
| (7) |
where is the HI ambient density, the bubble expansion velocity, is the number of H photons produced per shocked proton, and is the frequency of the H photons. The predicted collisionally excited luminosities are L=2.4 erg s-1 and L=1.6 erg s-1, less than the 10 and 1 per cent of the total H luminosity. We have assumed that approximately 0.1 H photons are produced per shocked proton. This is the value predicted by the Shull & McKee [Shull McKee 1979] models for a 50 km s-1 shock. We have also adopted a HI ambient density of 0.3 cm-3, that is the same value adopted by MHW for a sample of dwarf amorphous galaxies. This value is obtained considering the galactocentric distance of the Mrk86–B bubble, 1.2 kpc, and the galaxy HI density profile given by the equation 3.
Due to the uncertainties present in the HI total mass and scale measurements, we could be dealing with significantly higher HI ambient densities (e.g. 1 cm-3), that could enhance the predicted collisional H luminosity. In any case, this contribution would not dominate the total H luminosity in the north lobe (%), and would be negligible in the south lobe case (%).
Then, if the emission is photoionization dominated, the ratio between the luminosity of both lobes has to be related with the solid angle subtended from the starburst by each lobe. In fact, assuming revolution symmetry for both lobes, the solid angle ratio obtained is =5.5 (=6.6 sr and =1.2 sr), very close to the ratio L=5.3. In the right panel of Figure 10 we show the aperture angles assumed, and the position of the ionizing radiation source (#49 knot in G99).

In order to estimate the relevance of the shock excitation mechanism, we have also studied the [OII]3727Å/[OIII]5007Å, [OIII]5007Å/H, [NII]6583Å/H and ([SII]6717Å6731Å)/H line ratios across both lobes (see Figures 11a & 11b). For the south lobe region we obtain low excitation, log([OIII]/H)0.3, but with moderate log([OII]/[OIII])0.3 values. These values can be explained using photoionization models with low ionization parameter (log U4; Martin 1997). However, for the more remote north lobe regions the very high log([OII]/[OIII])0.6 (Figure 11a) and high log([NII]/H)0.5 and log([SII]/H)0 (Figure 11b) values obtained imply that an additional excitation mechanism should be present (Lehnert & Heckman 1996; Martin 1997). These line ratios are well reproduced taking into account the emission predicted from the models of Shull & McKee [Shull McKee 1979] with shock velocities of 90 km s-1. This result is consistent with the higher collisional H luminosity predicted for the north lobe of the bubble.
5.4 Mrk86–C
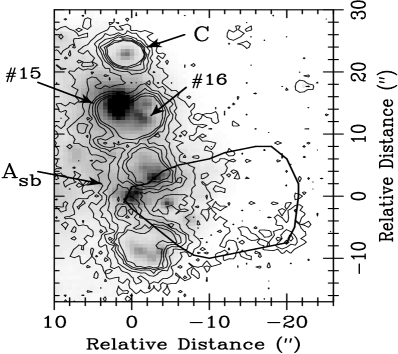
From the high-resolution spectra #7R and #8R we infer the presence of deep velocity minima close to the G99 #9 knot emission maximum (C region in Figures 1 and 9). These minima observed in both spectra #7R and #8R (see Figures 12a & 12b) are well understood if we are dealing with the foreground part of a highly extinct expanding bubble, with median parameters, =110 pc and =17.3 km s-1 (4 Myr). These parameters (see Table LABEL:parameters) are obtained fitting the radial velocity profiles (global velocity gradient subtracted; ) to an isotropic expanding structure velocity law (see Figures 12a & 12b)
| (8) |
The central starburst should have a high extinction, large enough to obscure the H emission of the receding part of the bubble. In order to test this hypothesis we should estimate the physical properties, extinction included, of the starburst which has originated this collective wind.
The Mrk86–C bubble has similar appearance in all the optical and nIR images, including the H image (see Figure 9), in contrast with the B bubble case, probably due to its lower dynamical time. Its H emission is slightly more extended along the W-E than that observed in broad-band filters. The corresponding optical and nIR colours measured for the starburst are given in the Table LABEL:parameters and are fully compatible with a 7.7 Myr old and Z=0.1 Z☉ metallic region, adopting, in order to better fit the colours measured, an colour excess of E=0.73.
From these parameters, and the total absolute magnitude measured, applying the LH results we obtain a starburst mass of about 4.7 M☉. In addition, because the total H luminosity measured for Mrk86–C, 1.7 erg s-1, is 6 times higher than that predicted for the collisional case, 2.7 erg s-1, we can conclude that the line emission is also in Mrk86–C mainly due to photoionized gas.
Finally, we have studied the [NII]/H and [SII]/H line ratios measured from the high resolution spectra. They change between 0.10 in regions close to the starburst centre, and 0.25 and 0.30, respectively, in the external low H surface brightness bubble regions (see Figures 12a & 12b). The increase in line ratios values towards bubble outer regions seems again to indicate a decrease in the ionization parameter due to the dilution of the radiation from the centralized source [Martin 1997]. The values obtained are compatible with a pure low-metallicity HII region photoionization mechanism (see, e.g. Shields & Filippenko 1990).
6 Velocity dispersion in Mrk86–C
We have measured the ionized gas velocity dispersion for the #7R and #8R high-resolution spectra. From the calibration lamp and night sky lines we have estimated the spectral resolution in =16.42.1 km s-1. Then, we have obtained the velocity dispersion of the Mrk86–C bubble from these spectra, subtracting to the value of . The spatial variation of these velocity dispersion measured is shown in Figure 12. The velocity dispersion obtained for the whole () bubble C were =162 km s-1 and =152 km s-1. In addition, we have obtained the mean velocity dispersion for the whole emitting region, averaging the values measured in intervals of 033, 1″ and 2″ along the spatial direction. We have estimated 173 and 14.91.6 km s-1, respectively for the #7R and #8R spectra and 033 intervals, 185 and 15.40.5 km s-1 for 1″ intervals, and finally, 195 and 15.20.3 km s-1 for 2″ intervals.
We observe that there is no significant differences between local and total velocity dispersion values, i.e. the velocity widths obtained for regions of size are similar to that obtained for an important fraction of the whole emitting region (), and that they do not change with the considered spatial interval.
We have now considered the expresion for the mass of a virialized system given by Guzmán et al. (1996, 1997; see also Bender, Burstein & Faber 1992 and Gallego et al. 1998),
| (9) |
If we take for Mrk86–C the -band effective radius of the starburst measured with cobra, 36 pc, and 15 km s-1, we obtain a virialized mass (Eq. 9) for Mrk86–C of about M☉.
Let us compare this result with the Mrk86–C starburst total mass estimated from the mass in newly formed stars (=5.3 M☉), underlying stellar population, gas and dark matter present in this region. Considering the mass density profile given in Sect. 4 we can estimate the mass content inside the effective radius of the Mrk86–C starburst precursor. Assuming the most favourable case, i.e. =0° and a dark matter model with =2, the density expected at a galactocentric distance, =1.0 kpc, will be about 9 atH cm-3. Therefore, the mass content inside should be about 105 M☉. We can conclude that the burst total mass is significantly lower that the virialized mass deduced. The similarity of the velocity dispersion measured pixel by pixel rules out the global velocity gradient as origin for the observed velocity dispersion. First reason for Mrk86–C not to be bound arises from the existence of local gas motions induced by the Mrk86–C supernova-driven wind. Another argument is Mrk86–C is not placed at the galactic centre and, therefore, is subject of strong tidal forces that prevents it to be virialized.
We have obtained the turbulent velocity dispersion 444Turbulent velocity dispersion is defined as the line broadening obtained after subtracting instrumental and thermal broadening. (see, e.g. Fuentes-Masip 1997), applying the expression
| (10) |
that yields a 10.7 km s-1 and 10.0 km s-1, respectively for #7R and #8R spectra, assuming for H an =7.1 km s-1 [Hippelein 1986], and a temperature, =104 K. Adopting a sound velocity for the ionized gas in HII regions of about 12.8 km s-1 [Dyson & Williams 1980], the corresponding is approximately 8 km s-1 [Fuentes-Massip 1997]. Thus, we can conclude that the velocity dispersion in this region is sonic or slightly supersonic.
7 Summary and conclusions
-
1.
The global velocity field in Mrk86 has a central angular velocity of about 34 km s-1 kpc-1 with orientation PA12° (rotation axis PA78°). This velocity gradient shows a progressive diminution towards outer galaxy regions, from 34 km s-1 kpc-1 at the galactic centre to 10 km s-1 kpc-1 at 1 kpc. The density profiles of the different mass components indicate that the underlying stellar component dominates the total mass within its optical radius. The velocity gradients measured for different distances along the galactic rotation axis indicate that the ionized gas is probably distributed in a inclined rotating disk, with inclination in relation to the plane of the sky of about 50°.
-
2.
High velocity gradients of about 70 km s-1 kpc-1 associated with intense star forming regions have been observed. Both, a high mass concentration or a recent merger could be responsible for these local, steep velocity gradients.
-
3.
Our observations have revealed the existence of two bubbles, Mrk86–B and Mrk86–C. They present of 34 and 17 km s-1 and of 374 and 120 pc, respectively. These structures are driven by supernovae and massive stars winds originated in two low metallicity (Z0.1 Z☉) HII regions 11 and 8 Myr old, with masses of 6.3 and 5.3 M☉. The H emission is dominated by photoionization mechanisms, contributing at least with the 90 per cent of the total H luminosity. Moreover, the optical line ratios measured agree with photoionization mechanisms as the origin for their emission.
-
4.
In addition, we have studied the physical properties of the starburst precursor of the Mrk86–A bubble described by Martin [Martin 1998]. The optical-nIR colours measured for these region are well described by a 14 Myr old, low metallicity (Z0.25 Z☉), 105 M☉ massive starburst.
The predicted starburst ages agree quite well with the dynamical times measured if we assume a delay of 4 Myr between the starburst formation and the time when the bubble begins to inflate. In fact, the one tenth solar metallicity Leitherer & Heckman [Leitherer & Heckman 1995] models predict an increment of about 1.5dex in the deposition rate of mechanical energy 4 Myr after the star formation burst.
-
5.
The global velocity dispersion obtained for Mrk86–C does not trace the total mass of the burst. The turbulent velocity dispersion obtained for the Mrk86–C bubble is sonic or slightly supersonic, with 10 km s-1. These values do not show significant changes across the region.
Acknowledgements
Based on observations made with the Jacobus Kapteyn and Isaac Newton telescopes operated on the island of La Palma by the Royal Greenwich Observatory in the Spanish Observatorio del Roque de los Muchachos of the Instituto Astrofísico de Canarias. Based also in observations collected at the German-Spanish Astronomical Centre, Calar Alto, Spain, operated jointly by the Max-Plank-Institut für Astronomie (MPIA), Heidelberg, and the Spanish National Commission for Astronomy. The United Kingdom Infrared Telescope is operated by the Joint Astronomy Centre on behalf of the U.K. Particle Physics and Astronomy Council. We would like to thank C. Sánchez Contreras and L. F. Miranda for obtaining the high resolution H spectra, C. Jordi and D. Galadí for obtaining the image, and A. Aragón-Salamanca who provided the image. We also thank J. Cenarro and C. E. García-Dabó for stimulating conversations. We are indebted to the referee, Dr. A. Burkert, for many helpful comments and corrections. A. Gil de Paz acknowledges the receipt of a Formación del Profesorado Universitario fellowship from the Spanish MEC. This research was supported by the Spanish Programa Sectorial de Promoción General del Conocimiento under grant PB96-0610.
References
- [Aragón-Salamanca et al. 1993] Aragón-Salamanca A., Ellis R. S., Couch W. J., Carter D., 1993, MNRAS, 262, 764
- [Arp 1966] Arp H. 1966, Atlas of Peculiar Galaxies, California Institute of Technology, Pasadena
- [Bender, Burstein & Faber 1992] Bender R., Burstein D., Faber S. M., 1992, ApJ, 399, 462
- [Binney & Tremaine 1987] Binney J.,Tremain S., 1987, in Galactic Dynamics, ed. J. P. Ostriker, Princeton University Press
- [Blok et al. 1996] de Blok W. J. G., McGaugh s. s., van der Hulst J. M., 1996, MNRAS, 283, 18
- [Bomans, Chu & Hopp 1997] Bomans D. J., Chu Y.-H., Hopp U., 1997, AJ, 113, 1678
- [Bottinelli et al. 1984] Bottinelli L., Gouguenheim L., Paturel G., de Vaucouleurs G., 1984, A&AS, 56, 381
- [Brinks 1994] Brinks E., 1994, in Violent Star Formation: From 30 Doradus to QSOs, ed. G. Tenorio-Tagle, 1st. IAC-RGO meeting, La Palma, p. 145
- [Broeils 1992] Broeils A. H., 1992, Ph. D. Thesis, Rijksuniversiteit Groningen
- [Bruzual & Charlot 1996] Bruzual G., Charlot S., 1996, unpublished
- [Burkert 1995] Burkert A., 1995, ApJ, 447, 25
- [Calzetti 1997] Calzetti D., 1997, to appear in The Ultraviolet Universe at Low and High Redshift, preprint
- [Carignan & Beaulieu 1989] Carignan C., Beaulieu S., 1989, ApJ, 347, 760
- [Carignan & Freeman 1988] Carignan C., Freeman K. C., 1988, ApJ, 332, L33
- [Castor et al. 1975] Castor J., McCray R., Weaver R., 1975, ApJ, 200, L107
- [Chevalier & Clegg 1985] Chevalier R., Clegg A., 1985, Nature, 317, 44
- [De Vaucouleurs & Pence 1980] De Vaucouleurs G., Pence W. D., 1980, ApJ, 242, 18
- [De Young & Gallagher 1990] De Young D. S., Gallagher J. S., 1990, ApJ, 356L, 15
- [Dultzin-Hacyan et al. 1990] Dultzin-Hacyan D., Masegosa J., Moles M., 1990, A&A, 238, 28
- [Dyson & Williams 1980] Dyson J. E., Williams D. A., 1980, in The Physics of the Interstellar Medium (Manchester: Manchester University Press)
- [Fanelli et al. 1988] Fanelli M.N., O’Conell R.W., Thuan T.X., 1988, ApJ, 334, 665
- [Fernie 1983] Fernie J. D., 1983, PASP, 95, 782
- [Flores & Primack 1994] Flores R. A., Primack J. R., 1994, ApJ, 427, L1
- [Fuentes-Massip 1997] Fuentes-Masip O., 1997, Ph. D. Thesis, Universidad de La Laguna
- [Gallego et al. 1998] Gallego J., Zamorano J., García-Dabó C. E., Aragón-Salamanca A., 1998, in The Young Universe, ASP conference series, 146, 235
- [Gil de Paz et al. 1998] Gil de Paz A., Zamorano J., Gallego J., 1998, in Dwarf Galaxies and Cosmology. XVIII Reencontres de Moriond, eds: T.V., Thuan T. X., Balkowski C., Cayatte V., and Van T. T., Les Arcs. (G98)
- [Gil de Paz et al. 1999] Gil de Paz A., Zamorano J., Gallego J., Aragón-Salamanca A., Domínguez, F. de B., 1999, in prep. (G99)
- [Guzmán et al. 1996] Guzmán R., Koo D. C., Faber S. M., et al., 1996, ApJ, 460, L5
- [Guzmán et al. 1997] Guzmán R., Gallego J., Koo D. C., et al., 1997, ApJ, 489, 559
- [Heckman et al. 1990] Heckman T. M., Armus L., Miley G. K., 1990, ApJS, 74, 833
- [Hippelein 1986] Hippelein H., 1986, A&A, 160, 374
- [Hodge & Kennicutt 1983] Hodge , Kennicutt R. C., 1983, ApJ, 265, 132
- [Israel et al. 1995] Israel F. P., Tacconi L. J., Baas F., 1995, A&A, 295, 599
- [Izotov et al. 1996] Izotov Y. I., Dyak A. B., Chaffee F. H., et al., 1996, ApJ, 458, 524.
- [Kamphuis et al. 1996] Kamphuis J. J., Sijbring L. G., van Albada T. S., 1996, A&AS, 116, 15
- [Kent 1985] Kent S. M., 1985, PASP, 97, 165
- [Klein et al. 1984] Klein U., Wielebinski R., Thuan T.X., 1984, A&A, 141, 241
- [Klein et al. 1991] Klein U., Weiland H., Brinks E., 1991, A&A, 246, 323
- [Leitherer & Heckman 1995] Leitherer C., Heckman T. M., 1995, ApJS, 96, 9 (LH)
- [Lehnert & Heckman 1996] Lehnert M. D., Heckman T. M., 1996, ApJ, 462, 651
- [Lo et al. 1993] Lo K. Y., Sargent W. L. W., Young K., 1993, AJ, 106, 507
- [Longo et al. 1991] Longo G., Capaccioli M, Ceriello A., 1991, A&AS, 90, 375
- [Lonsdale et al. 1985] Lonsdale C.J., Helou G., Good J.C., Rice W., 1985, Catalogued Galaxies and Quasars Observed in the IRAS Survey. Jet Propulsion Lab., Pasadena.
- [Loose & Thuan 1985] Loose H.-H., Thuan T.X., 1985, in Star-Forming Dwarf Galaxies, eds. Kunth D., Thuan T.X., and Van J.T.T. Editions Frontières.
- [Loose & Thuan 1986] Loose H.-H., Thuan T.X., 1986, ApJ, 309, 59
- [Mac Low & Ferrara 1998] Mac Low M.-M., Ferrara A., 1998, preprint, astro-ph/9801237
- [Maeder 1990] Maeder A., 1990, A&AS, 84, 139
- [Markarian 1969] Markarian B. E., 1969, Afz, 5, 443
- [Marlowe et al. 1995] Marlowe A., Heckman T. M., Wyse R. F. G., Schommer R., 1995, ApJ, 438, 563 (MHW)
- [Martin 1996] Martin C. L., 1996, ApJ, 465, 680
- [Martin 1997] Martin C. L., 1997, ApJ, 491, 561
- [Martin 1998] Martin C. L., 1998, ApJ, preprint, astro-ph/9804165 (CM98)
- [Mathis 1990] Mathis J. S., 1990, ARA&A, 28, 37
- [Meurer et al. 1998] Meurer G. R., Staveley-Smith L., Killeen N. E. B., 1998, MNRAS, preprint, astro-ph/9806261
- [Moore 1994] Moore B., 1994, Nature, 370, 629
- [Mori et al. 1997] Mori M., Yuzuru Y., Takuji T., Ken’ichi N., 1997, ApJ, 478, L21
- [Navarro, Eke & Frenk 1996] Navarro J. F., Eke V. R., Frenk C. S., 1996, MNRAS, 283, 72
- [Navarro, Frenk & White 1997] Navarro J. F., Frenk C. S., White S. D. M., 1997, ApJ, 490, 493
- [Ojha & Joshi 1991] Ojha D.K., Joshi S.C., 1991, Ap&SS, 183, 245
- [Östlin et al. 1998] Östlin G., Amram P., Masegosa J., Bergvall N., Boulesteix J., 1998, preprint, astro-ph/9812283
- [Papaderos et al. 1996a] Papaderos P., Loose H.-H., Thuan T. X., Fricke K. J., 1996a, A&AS, 120, 207 (P96a)
- [Papaderos et al. 1996b] Papaderos P., Loose H.-H., Fricke K. J., Thuan T. X., 1996b, A&A, 314, 59 (P96b)
- [Petrosian et al. 1997] Petrosian A. R., Boulesteix J., Comte G., Kunth D., LeCoarer E., 1997, A&A 318, 390
- [Pryor & Kormendy 1990] Pryor C., Kormendy J., 1990, AJ, 100, 127
- [Puche et al. 1992] Puche D., Westphal D., Brinks E., Roy J. R., 1992, AJ, 103, 1841
- [Roy et al. 1991] Roy J. R., Boulesteix J., Joncas J., Grundseth B., 1991, ApJ, 367, 141
- [Sage et al. 1992] Sage L. J., Salzer J. J., Loose H.-H., Henkel C., 1992, A&A, 265, 19
- [Saitō et al. 1992] Saitō M., Sasaki M., Ohta K., Yamada T., 1992, PASJ, 44, 593
- [Salpeter 1955] Salpeter, E. E., 1955, ApJ, 121, 161
- [Salucci & Persic 1997] Salucci P., Persic M., 1997, in Dark and Visible Matter in Galaxies, eds. M. Persic & P. Salucci, ASP conference series, 117,
- [Scalo 1986] Scalo J. M., 1986, Fund. Cosmic Phys., 11, 1
- [Shapley & Ames 1932] Shapley H., Ames A., 1932, in Annals of the Harvard College Obs. 88, No. 2
- [Shields & Filippenko 1990] Shields G. A., Filippenko A. V., 1990, AJ, 100, 103
- [Shull McKee 1979] Shull S. M., McKee C., 1979, ApJ, 227, 131
- [Silk, Wyse & Shields 1987] Silk J., Wyse R. F. G., Shields G., 1987, ApJ, 322, L59
- [Skillman & Kennicutt 1993] Skillman E. D., Kennicutt R. C., 1993, ApJ, 411, 655
- [Staveley-Smith et al. 1992] Staveley-Smith L., Davies R. D., Kinman T. D., 1992, MNRAS, 258, 334
- [Swaters 1998] Swaters R., 1998, in Galaxy Dynamics, Rutgers University, preprint, astro-ph/9811010
- [Thronson et al. 1989] Thronson H., Tacconi L., Kenney J., et al., 1989, ApJ, 344, 747
- [Thuan 1983] Thuan T. X., 1983, ApJ, 268, 667
- [Thuan 1991] Thuan T. X., 1991, in Massive Stars in Starburst, eds. C. Leitherer, N. R. Walborn, T. M. Heckman, C. A. Norman, StSci Symposium series 5, Baltimore, p. 183
- [Thuan & Martin 1981] Thuan T. X., Martin G. E., 1981, ApJ, 247, 823
- [Tomita et al. 1997] Tomita A., Ohta K., Nakanishi K., Takeuchi T. T., Saitō M., 1997, AJ, 116, 131
- [Vader 1986] Vader J. P., 1986, ApJ, 305, 669
- [Vader 1987] Vader J. P., 1987, ApJ, 317, 128
- [Van Zee et al. 1998] Van Zee L., Skillman E. D., Salzer J. J., 1998, preprint, astro-ph/9806246
- [Verter 1985] Verter F., 1985, ApJS, 57, 261
- [Young & Knezek 1989] Young J. S., Knezek P., 1989, ApJ, 347, L55