The ROSAT Brightest Cluster Sample (BCS): – III. Optical spectra of the central cluster galaxies
Abstract
We present new spectra of dominant galaxies in X-ray selected clusters of galaxies, which combine with our previously published spectra to form a sample of 256 dominant galaxies in 215 clusters. 177 of the clusters are members of the ROSAT Brightest Cluster Sample (BCS; Ebeling et al. 1998), and 18 have no previous measured redshift. This is the first paper in a series correlating the properties of brightest cluster galaxies and their host clusters in the radio, optical and X-ray wavebands.
27 per cent of the central dominant galaxies have emission-line spectra, all but five with line intensity ratios typical of cooling flow nebulae. A further 6 per cent show only [NII] with H in absorption. We find no evidence for an increase in the frequency of line emission with X-ray luminosity. Purely X-ray-selected clusters at low redshift have a higher probability of containing line emission. The projected separation between the optical position of the dominant galaxy and its host cluster X-ray centroid is less for the line-emitting galaxies than for those without line emission, consistent with a closer association of the central galaxy and the gravitational centre in cooling flow clusters.
The more H-luminous galaxies have larger emission-line regions and show a higher ratio of Balmer to forbidden line emission, although there is a continuous trend of ionization behaviour across four decades in H luminosity. Galaxies with the more luminous line emission (L(H)) show a significantly bluer continuum, whereas lower-luminosity and [NII]-only line emitters have continua that differ little from those of non-line emitting dominant galaxies. Values of the Balmer decrement in the more luminous systems commonly imply intrinsic reddening of E(B-V), and when this is corrected for, the excess blue light can be characterized by a population of massive young stars. Several of the galaxies require a large population of O stars, which also provide sufficient photoionization to produce the observed H luminosity. The large number of lower-mass stars relative to the O star population suggests that this anomalous population is due to a series of starbursts in the central galaxy.
The lower H-luminosity systems show a higher ionization state and few massive stars, requiring instead the introduction of a harder source of photoionization, such as turbulent mixing layers, or low-level nuclear activity. The line emission from the systems showing only [NII] is very similar to low-level LINER activity commonly found in many normal elliptical galaxies.
keywords:
surveys – galaxies: clusters: general – cooling flows – galaxies: elliptical and lenticular, cD – galaxies: stellar content – X-rays:galaxies.1 Introduction
We have compiled the ROSAT Brightest Cluster Sample (BCS; Ebeling etal 1998, hereafter Paper I), which is a 90 per cent flux-complete sample of the 201 X-ray brightest clusters of galaxies in the northern extragalactic hemisphere (∘and ∘) within 0.3. The clusters were selected from their X-ray emission in the ROSAT All-Sky Survey (RASS; Voges 1992), and include both clusters listed in optical catalogues and systems newly discovered through their X-ray properties (Crawford et al. 1995; Paper I). The BCS is now redshift-complete at unabsorbed fluxes greater than in the keV ROSAT band (Paper I). Paper I also tabulates a further two clusters with that fulfil all the other BCS criteria (RXJ1532.9+3021 and Z1953). The BCS is the largest statistically complete X-ray selected sample of clusters to date, and has been used to derive the cluster log N-log S distribution (Paper I), the cluster-cluster correlation function (Edge et al. 1999a), and also the X-ray luminosity function out to a redshift of 0.3 (Ebeling et al. 1997, Paper II). The BCS forms a unique statistical sample to define the characteristics of clusters at other wavebands and their dependence on the global cluster properties, without the biases inherent in optically- or radio-selected samples.
As part of the selection and compilation of the BCS, we have published optical spectra of central dominant galaxies in both Abell and Zwicky clusters without a previously known redshift, and also of the new ROSAT-discovered clusters (Allen et al. 1992, Crawford et al. 1995; hereafter A92 and C95 respectively). Preliminary analyses of the spectra of these galaxies show that around one-third of them display anomalies such as a spectrum featuring luminous emission lines and an excess ultraviolet/blue continuum. Such features are well-known to be associated with galaxies at the centres of cooling flows (Hu, Cowie & Wang 1985; Johnstone, Fabian & Nulsen 1987 (hereafter JFN); Heckman et al. 1989; Romanishin 1987; Donahue, Stocke & Gioia 1992; McNamara & O’Connell 1989, 1992, 1993), and preferentially with those that contain a radio source (Heckman et al. 1989, C95). The blue continuum is directly attributable to a modest amount of recent massive star formation, which can also power some of the luminous line emission (Allen 1995).
This paper is the first in a series in which we compile and correlate the properties of the brightest cluster galaxies (BCG) and their host clusters in three wavebands. We present optical spectra of the dominant galaxies of 87 per cent of the BCS; subsequent papers will compile results from optical and radio images (Edge et al. 1999b, 1999c) and the cluster X-ray properties (Crawford et al. 1999; Ebeling et al. 1999) in order to perform a full statistical analysis of the sample. A value of the Hubble constant of and a cosmological deceleration parameter of have been used throughout this paper; where cluster properties are quoted from the literature, we convert them to this assumed cosmology.
2 Observations and Data reduction
2.1 Target selection and samples
The BCS is comprised of clusters culled from a positional cross-correlation of X-ray sources detected in the RASS with the optical cluster catalogues of Abell and Zwicky (Abell 1958; Abell, Corwin & Olowin 1989; Zwicky et al. 1961-1968), as well as systems detected as extended X-ray sources in the RASS and confirmed as clusters using the Palomar Observatory Sky Survey (POSS) and deep optical CCD imaging (Paper I). The latter, purely X-ray selected systems are referred to in this paper by the ROSAT X-ray source name, eg RXJ0107.4+3227. (Any more commonly used names are referred to in the notes accompanying the tables). We identified the dominant galaxies from comparison of the X-ray emission centroid and extent (using ROSAT pointed observations where possible rather than the limited information available from the RASS) against the POSS and maps provided by the Automated Plate Measuring Machine at Cambridge. Our previous work (A92 and C95) showed that the BCG is usually found within 1-2 arcmin of the centroid of the X-ray emission from the cluster. Where there is no simple identification of a single dominant galaxy near the X-ray centroid, we aimed to observe all possible candidates, and in cases where the cluster is known or suspected to be part of a multiple cluster system (eg A2249, A2256), to observe both (or more) dominant galaxies. For detailed information about the best candidate dominant galaxies within a cluster, and for the positions of good candidates remaining unobserved due to lack of time, see the notes appended to the log of observations presented in Tables 1 and 2. In the course of compiling the BCS we have taken spectra of the BCG in several clusters that were not included in the final sample. These extra clusters were selected from the RASS using exactly the same (original) criteria, but were eventually discarded due to their faint X-ray flux, low Galactic latitude or negative declination. As they are a natural extension to the BCS, we include their BCG spectra in this paper to enlarge our sample, but list them separately from the ‘true’ BCS in the log of observations (Table 2).
2.2 Previous data
Optical spectra of 88 dominant galaxies in 79 clusters have already been presented by us in A92 and C95. The majority of these observations were taken using the Faint Object Spectrograph (FOS) on the 2.5m Isaac Newton Telescope (INT) on La Palma, with the primary aim of determining the redshift of BCS clusters. The FOS yields low-resolution spectra in two orders, with dispersion of 5.4Å/pixel over 3500–5500Å and 10.7Å/pixel over 5000–10500Å, taken from a 6 arcsec-long slit. Observations were usually made at the parallactic angle to minimize the effects of atmospheric dispersion, and the slit width was matched to the seeing of typically around 1.2 arcsec FWHM. The FOS spectra were reduced using an automated optimal extraction package, and thus spatially extended spectral information is not available for these galaxies. The short slit length may also mean that the sky-subtraction is less accurate for the lower-redshift galaxies. The final spectra were corrected for atmospheric extinction and Galactic reddening, and flux calibrated. C95 also includes ten spectra at moderate resolution (5Å/pixel) taken using the Intermediate dispersion Spectroscopic and Imaging System on the William Herschel Telescope (WHT). All the previous spectra are included in the log of observations given in Tables 1 and 2, although the reader is referred to A92 and C95 for a more detailed account of the observations and data reduction. The reference for the paper containing the first publication of the spectrum is listed in the tenth column of Tables 1 and 2 (A92, C95 and W94 for White et al. 1994).
A92 contains an observation of what was thought to be the central cluster galaxy in the ‘sub’-BCS cluster A2552. This galaxy (at RA 23 11 31.1, Dec 03 37 55; J2000) had a peculiar spectrum, with narrow emission lines, curious line ratios and an exceptionally strong blue continuum with no obvious stellar absorption features. Subsequent optical imaging has since shown that this galaxy has a peculiar morphology, and is too bright to be the dominant galaxy for the surrounding cluster (Edge et al. 1999c). The best candidate for the dominant cluster galaxy is the double system at RA 23 11 33.3, Dec 03 38 05 (J2000), at a redshift of 0.3025 (Ebeling, private communication). Reconsideration of our noisy spectrum of another nearby galaxy at RA 23 11 33.3 and Dec 03 38 05 (J2000) gives a tentative redshift of ; this galaxy was originally assigned a redshift of 0.137 in C95 based on an erroneous identification of [NII] emission.
2.3 New observations
The majority of the optical spectra presented in this paper were acquired during two week-long runs during 1995 May 03 – 09 and 1996 Dec 29 – 1997 Jan 03. A further six galaxies were observed during service time on 1998 Mar 16 and 29. The observations were made using the Intermediate Dispersion Spectrograph (IDS) on the INT at La Palma, with the R150V grating on the 235mm camera to yield an intermediate resolution spectrum with dispersion of 6.5Å/pixel. In combination with the TEK3 CCD detector the spectra covered the observed wavelength range 3300–9500Å with a dispersion of 0.7 arcsec/pixel in the spatial direction. The weather was clear for nine of the fourteen nights, with seeing conditions of typically 1.2 arcsec, varying between 1–1.5 arcsec. The long slit was set at a width of 1.3 arcsec and usually oriented at the parallactic angle, except where a more favourable orientation would include a second dominant galaxy in the same observation (those galaxies known to be observed with the slit not at parallactic angle are marked by a dagger in column 9 of Tables 1 and 2). Exposures were routinely of 1000s, and three or four observations of flux standards were made during each night with the slit opened up to 5.5 arcsec.
The data were reduced using standard procedures in the software package IRAF. After subtraction of a bias frame, the data were flat-fielded using a normalised flat created from long exposures of a tungsten lamp. Any spatial dispersion of the spectrum due to atmospheric refraction was corrected at this stage so that the continuum intensity peaked in the same row along the detector. The data were wavelength-calibrated using exposures of copper-argon and copper-neon arc-lamps, flux-calibrated, and corrected for atmospheric extinction. The Galactic reddening expected toward each galaxy was calculated from neutral hydrogen columns (Stark et al. 1992) using the formula of Bohlin, Savage & Drake (1978), and the spectra corrected using the law of Cardelli, Clayton & Mathis (1989) by the amount listed in column 8 of Tables 1 and 2. The data were sky-subtracted using background regions selected to be well outside the galaxy extent, as determined from fitting spatial profiles of the galaxy continuum. The slit was sufficiently long to achieve good sky subtraction for all but M87, the dominant galaxy of the most nearby cluster in our sample, RXJ1230.7+1220 (Virgo). Although we also took short exposures of a nearby F8 star after each galaxy observation with the aim of removing atmospheric absorption features from the galaxy spectra, we eventually decided that such correction might introduce more uncertainty in the final emission line fluxes. Thus we have not applied this correction, but throughout the paper we note where detection of an emission line will be affected by atmospheric absorption; the galaxies most affected are those in the redshift ranges 0.0440.048 and 0.1580.170.
2.4 Overview of observations
A full log of observations is presented in Tables 1 and 2. Observations of dominant galaxies in clusters from the BCS are presented first in Table 1, with the remainder listed in Table 2. ‘Sub’-BCS clusters that fulfil all the BCS criteria except that the RASS flux falls below the threshold for inclusion (and lies in the range ) are marked as such in the final column of Table 2, as are the clusters included in an X-ray selected sample of Abell clusters (marked XBACS; Ebeling et al. 1996). Galaxies are identified by the name of their host cluster in column 1, with their individual catalogued names listed in the final column and notes to the table. Where more than one galaxy in a cluster is observed, each is labelled a, b with an indication of their relative position (North, South, etc) following in brackets. Further elaboration on the properties of the individual galaxies (including if one is a better candidate for the dominant cluster galaxy) and their host clusters are given in the notes to the tables. The coordinates of the galaxy observed are given in columns 2 and 3, as measured to better than one arcsec from the Space Telescope Science Institute Digitized Sky Survey (DSS), and the galaxies are presented in RA order within each table. The redshift is given in column 4, and is in bold type if it is newly determined (see section 3.1), and in brackets if uncertain due to insufficient signal-to-noise in the spectrum. Column 5 shows whether or not the galaxy has optical H-line emission ( or ), or is marked by an ‘N’ if there is only [NII]6548,6584 line emission (see section 3.3). Clusters marked by [] show no obvious line emission, but the expected H and [NII] complex falls within a region of atmospheric absorption, and we cannot completely rule out very low level [NII]6548,6584 emission in these cases. Columns 6–9 show the total exposure, airmass, magnitude of expected Galactic reddening and slit position angle respectively for the new observations. A in column 9 marks an observation where the position angle of the slit is known not to be at the parallactic angle. Column 10 gives either the run of the new IDS observations (M95 for May 1995, D96 for December 1996, M98 for March 1998) or the reference for the first publication of the spectrum (A92, C95 or W94; see section 2.2).
2.5 Supplementary data from the literature
Twenty-seven clusters remain for which we have not observed the BCG, and these are listed in Table 3. The identification of the possible BCG for each cluster has been made by us from comparison of the X-ray properties with the digitized POSS in the same way as for the observed galaxies; the notes accompanying the table indicate which of the galaxies listed could be the BCG. Eight clusters have galaxies observed by Ebeling, Henry & Mullis (1999), and we have used NED to search the literature for basic information (ie whether the BCG has optical emission lines or not) on the remainder. Only five clusters remain for which we do not have any spectral information for the BCG (A75, A84, A104, A1235 and A2108). In Table 3 we list the cluster name, galaxy coordinates and redshift in columns 1–3 respectively. Where possible we list the redshift of the individual galaxy if known from the literature; otherwise we list the cluster redshift and mark it as such in the final column. Whether or not the galaxy is known to have H-line emission is marked in column 4, with a reference to the source for the redshift (and emission-line properties) in column 5. Individual names are given in the final column, with more detailed information in the notes to the table.
| Cluster | RA | DEC | Redshift | Lines? | Exp | Airmass | A(V) | p.a. | Ref | Notes | |
| (J2000) | (J2000) | (sec) | (mag) | (deg) | |||||||
| A7 | 00 11 45.2 | 32 24 57 | 0.1017 | 1000 | 1.096 | 0.374 | 272 | D96 | |||
| A21 | a (SE) | 00 20 37.5 | 28 39 30 | 0.0967 | 1000 | 1.529 | 0.293 | 155 | D96 | ||
| b (NW) | 00 20 37.2 | 28 39 36 | 0.0966 | ′′ | ′′ | ′′ | ′′ | ′′ | |||
| A76 | 00 39 55.9 | 06 50 55 | 0.0407 | 1000 | 2.194 | 0.258 | 62 | D96 | IC1568 | ||
| Z235 | 00 43 52.1 | 24 24 22 | 0.083 | C95 | |||||||
| A115 | 00 55 50.5 | 26 24 39 | 0.1970 | 1000 | 2.065 | 0.363 | 70 | D96 | |||
| RXJ0107.4+3227 | 01 07 24.9 | 32 24 46 | 0.0175 | 1000 | 1.004 | 0.359 | 316 | D96 | NGC383 | ||
| A168 | 01 14 57.5 | 00 25 52 | 0.0443 | [] | 1000 | 1.904 | 0.226 | 234 | D96 | UGC797 | |
| RXJ0123.2+3327 | 01 23 11.6 | 33 27 36 | 0.0141 | N | 1000 | 1.512 | 0.349 | 259 | D96 | NGC499 | |
| RXJ0123.6+3315 | 01 23 39.8 | 33 15 22 | 0.0169 | 1000 | 1.945 | 0.349 | 70 | D96 | NGC507 | ||
| A193 | 01 25 07.6 | 08 41 59 | 0.0484 | [] | 1000 | 1.488 | 0.307 | 238 | D96 | UGC977 | |
| A267 | 01 52 41.9 | 01 00 27 | 0.230 | C95 | |||||||
| A262 | 01 52 46.5 | 36 09 08 | 0.0166 | 1000 | 1.043 | 0.358 | 245 | D96 | NGC708 | ||
| A272 | 01 55 10.5 | 33 53 50 | 0.0898 | 1000 | 1.347 | 0.373 | 85 | D96 | |||
| RXJ0228.2+2811 | 02 28 03.6 | 28 10 34 | 0.0351 | 1000 | 1.608 | 0.522 | 70 | D96 | IC227 | ||
| A376 | 02 46 04.0 | 36 54 21 | 0.0482 | [] | 1000 | 1.960 | 0.449 | 255 | D96 | UGC2232 | |
| A400 | a (N) | 02 57 41.5 | 06 01 37 | 0.0238 | N | 1000 | 1.210 | 0.630 | 355 | D96 | MCG+01-08-027 |
| b (S) | 02 57 41.6 | 06 01 22 | 0.0253 | N | ′′ | ′′ | ′′ | ′′ | ′′ | ′′ ′′ | |
| A399 | 02 57 53.1 | 13 01 52 | 0.0699 | 1000 | 1.296 | 0.727 | 259 | D96 | UGC2438 | ||
| A401 | 02 58 57.8 | 13 34 59 | 0.0737 | N | 1000 | 1.382 | 0.700 | 243 | D96 | UGC2450 | |
| Z808 | 03 01 38.2 | 01 55 15 | 0.169 | C95 | |||||||
| A407 | 03 01 51.5 | 35 50 30 | 0.0484 | [] | 1000 | 1.668 | 0.820 | 79 | D96 | UGC2489 | |
| A409 | 03 03 21.1 | 01 55 34 | 0.153 | C95 | |||||||
| RXJ0338.7+0958 | 03 38 40.5 | 09 58 12 | 0.0338 | 1000 | 1.387 | 1.187 | 331 | D96 | |||
| RXJ0341.3+1524 | 03 41 17.5 | 15 23 49 | 0.029 | C95 | |||||||
| RXJ0352.91941 | 03 52 58.9 | 19 41 00 | 0.109 | C95 | |||||||
| A478 | 04 13 25.3 | 10 27 56 | 0.086 | 1000 | 1.058 | 0.670 | 315 | W94 | |||
| RXJ0419.6+0225 | 04 19 37.9 | 02 24 35 | 0.0133 | 1000 | 1.389 | 0.767 | 49 | D96 | NGC1550 | ||
| RXJ0439.0+0715 | 04 39 00.6 | 07 16 05 | 0.2452 | 1000 | 1.265 | 0.747 | 70 | D96 | |||
| RXJ0439.00520 | 04 39 02.2 | 05 20 45 | 0.208 | C95 | |||||||
| A520 | 04 54 03.8 | 02 53 33 | (0.2024) | 1000 | 2.161 | 0.520 | 240 | D96 | |||
| A523 | 04 59 12.9 | 08 49 42 | 0.1036 | 1000 | 1.343 | 0.800 | 57 | D96 | |||
| RXJ0503.10608 | 05 03 07.0 | 06 07 58 | 0.088 | C95 | |||||||
| A566 | 07 04 28.6 | 63 18 41 | 0.0945 | 1000 | 1.224 | 0.348 | 344 | D96 | MCG+11-09-031 | ||
| A576 | a | 07 21 21.5 | 55 48 40 | 0.0368 | 1000 | 1.123 | 0.381 | 7 | D96 | ||
| b | 07 21 32.5 | 55 45 28 | 0.0408 | 1000 | 1.123 | 0.381 | 7 | D96 | MCG+09-12-061 | ||
| A586 | 07 32 20.4 | 31 38 02 | 0.1702 | 1000 | 1.027 | 0.343 | 333 | D96 | |||
| RXJ0740.9+5526 | 07 40 58.2 | 55 25 39 | 0.0340 | 1000 | 1.298 | 0.309 | 296 | M95 | UGC3957 | ||
| RXJ0751.3+5012 | a (S) | 07 51 17.7 | 50 10 46 | 0.0218 | 1000 | 1.265 | 0.339 | 113 | M95 | UGC4051 | |
| b (N:E) | 07 51 21.1 | 50 14 10 | 0.0236 | 1000 | 1.268 | 0.339 | 265 | M95 | UGC4052 | ||
| c (N:W) | 07 51 18.8 | 50 14 07 | 0.0228 | ′′ | ′′ | ′′ | ′′ | ′′ | |||
| A602 | a (NW) | 07 53 16.5 | 29 24 06 | 0.0601 | 1000 | 1.078 | 0.290 | 267 | D96 | ||
| b (SE) | 07 53 26.4 | 29 21 35 | 0.0600 | 1000 | 1.048 | 0.290 | 267 | D96 | |||
| RXJ0819.6+6336 | 08 19 25.7 | 63 37 28 | 0.1186 | 1000 | 1.371 | 0.272 | 305 | M95 | |||
| A646 | 08 22 09.6 | 47 05 54 | 0.1268 | 1000 | 1.218 | 0.269 | 290 | D96 | |||
| Z1665 | 08 23 21.7 | 04 22 22 | 0.0311 | N | 1000 | 1.100 | 0.182 | 351 | D96 | IC505 | |
| A655 | 08 25 28.9 | 47 08 01 | 0.129 | 1000 | 1.153 | 0.266 | 300 | M95 | |||
| A667 | 08 28 05.8 | 44 46 03 | 0.145 | C95 | |||||||
| A671 | 08 28 31.5 | 30 25 54 | 0.051 | N | 1000 | 1.293 | 0.262 | 66 | M95 | IC2378 | |
| A665 | 08 30 57.3 | 65 50 32 | 0.1824 | 1000 | 1.385 | 0.282 | 310 | M95 | |||
| A689 | 08 37 24.6 | 14 58 22 | 0.2793 | C95 | |||||||
| A697 | 08 42 57.5 | 36 22 01 | 0.282 | C95 | |||||||
| A750 | 09 09 12.6 | 10 58 29 | (0.177) | N | 1000 | 1.184 | 0.253 | 66 | M95 | ||
| A763 | 09 12 35.3 | 16 00 03 | 0.0892 | 1000 | 1.080 | 0.233 | 225 | D96 | |||
| A757 | 09 13 07.8 | 47 42 32 | 0.0520 | 1000 | 1.058 | 0.109 | 175 | D96 | |||
| A773 | a (S) | 09 17 53.4 | 51 43 39 | 0.216 | C95 | ||||||
| b (N) | 09 17 53.5 | 51 44 03 | 0.224 | C95 | |||||||
| A795 | 09 24 05.3 | 14 10 22 | 0.1355 | 1000 | 1.042 | 0.234 | 210 | D96 | |||
| Z2701 | 09 52 49.2 | 51 53 06 | 0.215 | C95 | |||||||
| Z2844 | 10 02 36.6 | 32 42 26 | 0.0502 | 1000 | 1.138 | 0.101 | 270 | D96 | |||
| A961 | 10 16 23.0 | 33 38 19 | 0.124 | 1000 | 1.190 | 0.113 | 90 | M98 | |||
| A963 | 10 17 03.6 | 39 02 51 | 0.2059 | 1000 | 1.038 | 0.093 | 232 | D96 |
| Cluster | RA | DEC | Redshift | Lines? | Exp | Airmass | A(V) | p.a. | Ref | ||
| (J2000) | (J2000) | (sec) | (mag) | (deg) | |||||||
| A980 | 10 22 28.4 | 50 06 21 | 0.158 | [] | 1000 | 1.144 | 0.070 | 128 | M95 | ||
| Z3146 | 10 23 39.6 | 04 11 12 | 0.2906 | A92 | |||||||
| A990 | 10 23 39.8 | 49 08 39 | 0.142 | C95 | |||||||
| Z3179 | 10 25 58.0 | 12 41 09 | 0.1432 | A92 | |||||||
| A1033 | 10 31 44.3 | 35 02 30 | 0.1259 | A92 | |||||||
| A1068 | 10 40 44.4 | 39 57 12 | 0.1386 | A92 | |||||||
| A1132 | 10 58 23.5 | 56 47 43 | 0.1365 | 1000 | 1.141 | 0.042 | 166 | M95 | |||
| A1177 | 11 09 44.4 | 21 45 34 | 0.0323 | 1000 | 1.008 | 0.077 | 113 | M95 | NGC3551 | ||
| A1185 | a (N) | 11 10 38.3 | 28 46 03 | 0.0348 | 1000 | 1.005 | 0.115 | 45 | M95 | NGC3550 | |
| b (S,NW) | 11 10 42.9 | 28 41 36 | 0.0331 | 1000 | 1.027 | 0.115 | 332 | M95 | NGC3552 | ||
| c (S,SE) | 11 10 47.9 | 28 39 37 | 0.0288 | ′′ | ′′ | ′′ | ′′ | ′′ | NGC3554 | ||
| A1190 | 11 11 43.6 | 40 49 15 | 0.0772 | 1000 | 1.693 | 0.112 | 260 | M95 | |||
| A1201 | 11 12 54.4 | 13 26 10 | 0.1679 | [] | 1000 | 1.040 | 0.107 | 10 | D96 | ||
| A1204 | 11 13 20.3 | 17 35 41 | 0.1706 | A92 | |||||||
| A1246 | 11 23 58.8 | 21 28 48 | 0.1904 | A92 | |||||||
| A1302 | 11 33 14.6 | 66 22 46 | 0.1148 | 1000 | 1.264 | 0.071 | 5 | D96 | |||
| A1314 | 11 34 49.2 | 49 04 41 | 0.0337 | 1000 | 1.095 | 0.112 | 144 | M95 | IC712 | ||
| A1361 | 11 43 39.5 | 46 21 22 | 0.1167 | A92 | |||||||
| A1366 | 11 44 36.7 | 67 24 20 | 0.1155 | 1000 | 1.281 | 0.090 | 0 | M95 | |||
| A1413 | 11 55 17.8 | 23 24 20 | 0.1427 | 1000 | 1.005 | 0.146 | 180 | M95 | |||
| A1423 | 11 57 17.2 | 33 36 41 | 0.213 | C95 | |||||||
| A1437 | a (N) | 12 00 25.3 | 03 20 50 | 0.1336 | 1000 | 1.112 | 0.122 | 10 | M95 | ||
| b (S) | ′′ | ′′ | 0.1315 | ′′ | ′′ | ′′ | ′′ | ′′ | |||
| Z4803 | 12 04 26.8 | 01 53 45 | 0.0194 | 1000 | 1.166 | 0.125 | 210 | M95 | NGC4073 | ||
| RXJ1205.13920 | 12 05 10.2 | 39 20 49 | 0.037 | C95 | |||||||
| RXJ1206.5+2810 | 12 06 38.8 | 28 10 27 | 0.0281 | 1000 | 1.009 | 0.113 | 275 | D96 | NGC4104 | ||
| Z4905 | 12 10 16.8 | 05 23 11 | 0.0766 | N | 1000 | 1.108 | 0.099 | 20 | M95 | ||
| Z5029 | 12 17 41.0 | 03 39 23 | 0.0767 | 1000 | 1.110 | 0.115 | 190 | M95 | |||
| RXJ1223.0+1037 | 12 23 06.6 | 10 37 17 | 0.0259 | 1000 | 1.625 | 0.149 | 300 | D96 | NGC4325 | ||
| A1553 | a (NW) | 12 30 43.3 | 10 34 44 | 0.1634 | [] | 1000 | 1.272 | 0.133 | 303 | D96 | MCG+02-32-109 |
| b (SE) | 12 30 48.9 | 10 32 48 | 0.1715 | [] | 1000 | 1.355 | 0.133 | 303 | D96 | ||
| RXJ1230.7+1220 | 12 30 49.5 | 12 23 22 | 0.0036 | 500 | 1.271 | 0.163 | 240 | M95 | M87 | ||
| Z5247 | 12 34 17.5 | 09 46 00 | 0.229 | 1000 | 1.140 | 0.125 | 220 | M98 | |||
| A1589 | 12 41 17.4 | 18 34 30 | 0.0709 | 1000 | 1.018 | 0.127 | 180 | M95 | MCG+03-32-083 | ||
| A1656 | 12 59 35.6 | 27 57 35 | 0.0237 | 1000 | 1.010 | 0.061 | 262 | M95 | NGC4874 | ||
| A1668 | 13 03 46.6 | 19 16 18 | 0.0640 | 1000 | 1.014 | 0.147 | 180 | M95 | IC4130 | ||
| A1677 | 13 05 50.7 | 30 54 20 | 0.1845 | A92 | MCG+05-31-128 | ||||||
| A1682 | a | 13 06 45.7 | 46 33 31 | 0.2190 | A92 | ||||||
| b | 13 06 49.8 | 46 33 35 | 0.2330 | A92 | |||||||
| RXJ1320.1+3308 | a (W) | 13 20 14.6 | 33 08 39 | 0.0360 | 1000 | 1.016 | 0.070 | 250 | D96 | NGC5096 | |
| b (E) | 13 20 17.6 | 33 08 44 | 0.0377 | ′′ | ′′ | ′′ | ′′ | ′′ | NGC5098 | ||
| RXJ1326.3+0013 | 13 26 17.6 | 00 13 17 | 0.0821 | 1000 | 1.403 | 0.122 | 230 | M95 | |||
| A1758a | 13 32 38.4 | 50 33 38 | 0.2792 | A92 | |||||||
| A1763 | 13 35 20.1 | 41 00 05 | 0.2280 | 1000 | 1.023 | 0.061 | 3 | M95 | |||
| A1767 | 13 36 08.1 | 59 12 24 | 0.0715 | N | 1000 | 1.160 | 0.119 | 180 | M95 | MCG+10-19-096 | |
| A1775 | a (SE) | 13 41 50.5 | 26 22 15 | 0.0700 | 1000 | 1.004 | 0.070 | 123 | M95 | UGC8669 | |
| b (NW) | 13 41 49.1 | 26 22 27 | 0.0758 | ′′ | ′′ | ′′ | ′′ | ′′ | |||
| A1773 | 13 42 09.6 | 02 13 39 | 0.0763 | 1000 | 1.140 | 0.118 | 200 | M95 | |||
| A1795 | 13 48 52.5 | 26 35 37 | 0.062 | 1000 | 1.011 | 0.077 | 165 | M95 | MCG+05-33-005 | ||
| A1800 | 13 49 23.5 | 28 06 27 | 0.0750 | 1000 | 1.000 | 0.080 | 330 | M95 | UGC8738 | ||
| A1809 | 13 53 06.3 | 05 08 59 | 0.0796 | 1000 | 1.704 | 0.136 | 300 | D96 | |||
| A1831 | 13 59 15.0 | 27 58 34 | 0.0760 | 1000 | 1.007 | 0.093 | 80 | M95 | MCG+05-33-033 | ||
| A1835 | 14 01 02.0 | 02 52 45 | 0.2523 | 1000 | 1.189 | 0.150 | 214 | M95 | |||
| ′′ | ′′ | ′′ | A92 | ||||||||
| ′′ | ′′ | ′′ | 1000 | 1.111 | 0.155 | 180 | M95 | ||||
| A1885 | 14 13 43.6 | 43 39 45 | 0.090 | C95 | |||||||
| Z6718 | 14 21 35.8 | 49 33 05 | 0.071 | C95 | |||||||
| A1902 | 14 21 40.6 | 37 17 31 | 0.160 | [] | C95 | ||||||
| A1914 | 14 25 56.8 | 37 49 00 | 0.170 | [] | 1000 | 1.023 | 0.064 | 238 | M95 | ||
| A1918 | 14 25 22.5 | 63 11 55 | 0.139 | 1000 | 1.212 | 0.117 | 183 | M98 | |||
| A1927 | 14 31 06.6 | 25 38 02 | 0.0967 | 1000 | 1.253 | 0.147 | 67 | D96 | |||
| A1930 | 14 32 37.9 | 31 38 49 | 0.1316 | 1000 | 1.011 | 0.077 | 290 | M95 |
| Cluster | RA | DEC | Redshift | Lines? | Exp | Airmass | A(V) | p.a. | Ref | Notes | |
| (J2000) | (J2000) | (sec) | (mag) | (deg) | |||||||
| RXJ1440.6+0327 | a (SE) | 14 40 42.9 | 03 27 58 | 0.0274 | 1000 | 1.108 | 0.189 | 285 | M95 | NGC5718 | |
| b (NW) | 14 40 39.0 | 03 28 13 | 0.0268 | ′′ | ′′ | ′′ | ′′ | ′′ | IC1042 | ||
| RXJ1442.2+2218 | 14 42 19.4 | 22 18 13 | 0.0970 | 1000 | 1.563 | 0.173 | 289 | D96 | UGC9480 | ||
| A1978 | 14 51 09.5 | 14 36 45 | 0.1468 | 1000 | 1.031 | 0.118 | 2 | M95 | |||
| A1983 | a (S) | 14 52 55.4 | 16 42 11 | 0.0442 | [] | 1000 | 1.357 | 0.136 | 194 | D96 | MCG+03-38-044 |
| b (N) | 14 52 57.0 | 16 43 40 | 0.0459 | [] | ′′ | ′′ | ′′ | ′′ | ′′ | ||
| A1991 | 14 54 31.4 | 18 38 34 | 0.0595 | 1000 | 1.020 | 0.163 | 148 | M95 | NGC5778 | ||
| Z7160 | 14 57 15.1 | 22 20 35 | 0.2578 | A92 | |||||||
| A2009 | 15 00 19.6 | 21 22 11 | 0.1532 | 1000 | 1.023 | 0.221 | 46 | M95 | |||
| A2034 | a | 15 10 10.2 | 33 34 03 | 0.115 | C95 | ||||||
| b | 15 10 11.6 | 33 29 13 | 0.111 | C95 | |||||||
| A2029 | 15 10 56.2 | 05 44 43 | 0.0786 | 1000 | 1.088 | 0.204 | 170 | M95 | IC1101 | ||
| A2033 | 15 11 26.6 | 06 20 58 | 0.078 | N | 1000 | 1.115 | 0.198 | 243 | M95 | UGC9756 | |
| A2050 | 15 16 18.0 | 00 05 22 | 0.118 | 1000 | 1.140 | 0.316 | 165 | M98 | |||
| A2052 | 15 16 44.6 | 07 01 18 | 0.0351 | 1000 | 1.103 | 0.195 | 30 | M95 | UGC9799 | ||
| A2055 | a (SE) | 15 18 45.8 | 06 13 57 | 0.1019 | N | 1000 | 1.087 | 0.214 | 286 | M95 | |
| b (SW) | 15 18 40.7 | 06 14 19 | 0.1031 | ′′ | ′′ | ′′ | ′′ | ′′ | |||
| c (N) | 15 18 45.0 | 06 16 28 | 0.1056 | 1000 | 1.112 | 0.214 | 210 | M95 | |||
| A2064 | 15 20 52.2 | 48 39 40 | 0.0741 | 1000 | 1.538 | 0.123 | 269 | D96 | |||
| A2061 | a (S) | 15 21 11.1 | 30 35 03 | 0.0753 | 1000 | 1.048 | 0.128 | 272 | M95 | MCG+08-28-020 | |
| b (N) | 15 21 20.5 | 30 40 16 | 0.077 | 1000 | 1.002 | 0.128 | 242 | M95 | |||
| RXJ1522.0+0741 | 15 21 51.9 | 07 42 32 | 0.0451 | [] | 1000 | 1.115 | 0.202 | 115 | M95 | NGC5920 | |
| A2065 | a (W) | 15 22 24.1 | 27 42 53 | 0.0698 | 1000 | 1.046 | 0.195 | 110 | M95 | MCG+05-36-020 | |
| b | 15 22 27.7 | 27 42 36 | 0.0710 | ′′ | ′′ | ′′ | ′′ | ′′ | |||
| c (E) | 15 22 29.2 | 27 42 28 | 0.0749 | ′′ | ′′ | ′′ | ′′ | ′′ | |||
| A2063 | 15 23 05.4 | 08 36 35 | 0.0342 | 1000 | 1.066 | 0.199 | 180 | M95 | MCG+02-39-020 | ||
| A2069 | a (SE) | 15 24 08.4 | 29 52 56 | 0.1138 | 1000 | 1.148 | 0.134 | 331 | M95 | ||
| b (NW) | 15 24 07.4 | 29 53 20 | 0.1098 | ′′ | ′′ | ′′ | ′′ | ′′ | |||
| c (NW) | ′′ | ′′ | 0.1135 | ′′ | ′′ | ′′ | ′′ | ′′ | |||
| A2072 | 15 25 48.7 | 18 14 11 | 0.127 | 1000 | 1.025 | 0.262 | 210 | M95 | |||
| RXJ1532.9+3021 | 15 32 53.8 | 30 21 00 | 0.3615 | 1000 | 1.036 | 0.147 | 270 | M95 | |||
| A2107 | 15 39 39.1 | 21 46 57 | 0.042 | 1000 | 1.021 | 0.298 | 230 | M95 | UGC9958 | ||
| A2111 | a (NW) | 15 39 40.4 | 34 25 28 | 0.2317 | 1000 | 1.334 | 0.129 | 340 | D96 | ||
| b (SE) | 15 39 41.8 | 34 24 44 | 0.2300 | ′′ | ′′ | ′′ | ′′ | ′′ | |||
| A2110 | 15 39 50.8 | 30 43 05 | 0.0976 | 1000 | 1.004 | 0.159 | 180 | M95 | |||
| A2124 | 15 44 59.1 | 36 06 35 | 0.0663 | 1000 | 1.035 | 0.118 | 297 | M95 | UGC10012 | ||
| A2142 | a (SE) | 15 58 20.0 | 27 14 02 | 0.089 | 1000 | 1.044 | 0.262 | 301 | M95 | ||
| b (NW) | 15 58 13.3 | 27 14 55 | 0.095 | ′′ | ′′ | ′′ | ′′ | ′′ | |||
| A2147 | 16 02 17.0 | 15 58 30 | 0.0357 | 1000 | 1.030 | 0.226 | 200 | M95 | UGC10143 | ||
| A2151a | 16 04 35.7 | 17 43 19 | 0.035 | 1000 | 1.115 | 0.227 | 240 | M95 | NGC6041 | ||
| RXJ1604.9+2356 | 16 04 56.6 | 23 55 58 | 0.0324 | 1000 | 1.024 | 0.330 | 63 | M95 | NGC6051 | ||
| A2175 | 16 20 31.2 | 29 53 29 | 0.0961 | 1000 | 1.041 | 0.166 | 270 | M95 | |||
| A2199 | 16 28 38.5 | 39 33 05 | 0.031 | 1000 | 1.096 | 0.058 | 289 | M95 | NGC6166 | ||
| A2204 | 16 32 46.9 | 05 34 33 | 0.1514 | 1000 | 1.093 | 0.378 | 317 | M95 | |||
| A2219 | a | 16 40 12.9 | 46 42 43 | 0.2250 | A92 | ||||||
| b | 16 40 19.6 | 46 42 43 | 0.2248 | A92 | |||||||
| c | 16 40 21.9 | 46 42 48 | 0.2344 | A92 | |||||||
| RXJ1657.8+2751 | 16 57 58.1 | 27 51 16 | 0.035 | 500 | 1.526 | 0.284 | 105 | M98 | NGC6269 | ||
| A2244 | 17 02 42.5 | 34 03 39 | 0.0980 | 500 | 1.012 | 0.134 | 310 | M95 | |||
| A2256 | a (SE) | 17 03 35.6 | 78 37 46 | 0.0541 | 500 | 1.565 | 0.275 | 300 | M95 | NGC6331 | |
| b (SE) | 17 03 33.7 | 78 37 49 | 0.0565 | ′′ | ′′ | ′′ | ′′ | ′′ | ′′ | ||
| c (NW) | 17 03 29.0 | 78 37 57 | 0.0599 | ′′ | ′′ | ′′ | ′′ | ′′ | |||
| d (E) | 17 04 26.9 | 78 38 27 | 0.0596 | 1000 | 1.573 | 0.275 | 155 | M95 | MCG+13-12-018 | ||
| A2249 | 17 09 48.6 | 34 27 34 | 0.0873 | 1000 | 1.005 | 0.166 | 0 | M95 | |||
| A2255 | a (NE) | 17 12 34.8 | 64 04 16 | 0.0845 | 1000 | 1.235 | 0.170 | 229 | M95 | ||
| b (SW) | 17 12 28.7 | 64 03 40 | 0.0750 | ′′ | ′′ | ′′ | ′′ | ′′ | |||
| RXJ1715.3+5725 | 17 15 22.6 | 57 24 43 | 0.0282 | 1000 | 1.150 | 0.169 | 160 | M95 | NGC6338 | ||
| A2254 | 17 17 45.8 | 19 40 51 | 0.178 | C95 | |||||||
| Z8197 | 17 18 11.8 | 56 39 56 | 0.1140 | 1000 | 1.132 | 0.176 | 0 | M95 | |||
| A2259 | 17 20 09.6 | 27 40 09 | 0.164 | [] | C95 | ||||||
| RXJ1720.1+2638 | 17 20 10.1 | 26 37 32 | 0.1611 | 1000 | 1.001 | 0.262 | 0 | M95 | |||
| A2261 | 17 22 27.2 | 32 07 58 | 0.224 | C95 |
| Cluster | RA | DEC | Redshift | Lines? | Exp | Airmass | A(V) | p.a. | Ref | Notes | |
| (J2000) | (J2000) | (sec) | (mag) | (deg) | |||||||
| A2294 | 17 24 11.3 | 85 53 13 | 0.178 | C95 | |||||||
| RXJ1733.0+4345 | 17 33 02.1 | 43 45 35 | 0.0331 | 1000 | 1.036 | 0.164 | 190 | M95 | IC1262 | ||
| RXJ1740.5+3539 | a (NE) | 17 40 34.4 | 35 39 14 | 0.0416 | 1000 | 1.015 | 0.176 | 226 | M95 | MCG+06-39-010 | |
| b (SW) | 17 40 32.1 | 35 38 47 | 0.0448 | [] | ′′ | ′′ | ′′ | ′′ | ′′ | MCG+06-39-009 | |
| Z8276 | 17 44 14.5 | 32 59 30 | 0.075 | 1000 | 1.010 | 0.240 | 297 | M95 | |||
| RXJ1750.2+3505 | 17 50 16.9 | 35 04 59 | 0.1712 | 1000 | 1.014 | 0.205 | 310 | M95 | |||
| Z8338 | 18 11 05.2 | 49 54 34 | 0.047 | 600 | 1.629 | 0.284 | 90 | M98 | NGC6582 | ||
| A2318 | 19 05 11.0 | 78 05 38 | 0.1405 | A92 | |||||||
| RXJ2114.1+0234 | 21 13 56.0 | 02 33 56 | 0.0497 | 700 | 2.579 | 0.437 | 60 | D96 | IC1365 | ||
| RXJ2129.6+0005 | 21 29 39.9 | 00 05 23 | 0.2346 | 1000 | 1.593 | 0.272 | 310 | M95 | |||
| A2390 | 21 53 36.7 | 17 41 45 | 0.2328 | 1000 | 1.754 | 0.453 | 68 | D96 | |||
| A2409 | 22 00 52.6 | 20 58 10 | 0.1470 | A92 | |||||||
| A2443 | 22 26 08.0 | 17 21 25 | 0.1105 | 1000 | 2.157 | 0.349 | 65 | D96 | |||
| A2457 | 22 35 40.9 | 01 29 07 | 0.0592 | 1000 | 1.913 | 0.383 | 60 | D96 | |||
| A2495 | 22 50 19.6 | 10 54 13 | 0.0808 | 1000 | 1.759 | 0.353 | 60 | D96 | MCG+02-58-021 | ||
| Z8852 | 23 10 22.3 | 07 34 52 | 0.0399 | 600 | 2.510 | 0.325 | 60 | D96 | NGC7499 | ||
| A2572a | a (NE) | 23 17 13.5 | 18 42 30 | 0.0400 | 1000 | 2.050 | 0.316 | 222 | D96 | NGC7578B | |
| b (SW) | 23 17 11.9 | 18 42 05 | 0.0400 | ′′ | ′′ | ′′ | ′′ | ′′ | NGC7578A | ||
| A2572b | 23 18 30.3 | 18 41 21 | 0.0370 | 1000 | 1.774 | 0.313 | 247 | D96 | NGC7597 | ||
| A2589 | 23 23 57.4 | 16 46 39 | 0.0407 | 1000 | 1.154 | 0.277 | 240 | D96 | NGC7647 | ||
| A2593 | 23 24 20.1 | 14 38 50 | 0.0423 | 600 | 2.409 | 0.279 | 65 | D96 | NGC7649 | ||
| A2626 | a (NE) | 23 36 30.7 | 21 08 49 | 0.0556 | 1000 | 1.383 | 0.289 | 212 | D96 | IC5338 | |
| b (SW) | ′′ | ′′ | 0.0552 | ′′ | ′′ | ′′ | ′′ | ′′ | |||
| A2627 | a (N) | 23 36 42.1 | 23 55 30 | 0.127 | N | C95 | |||||
| b (S) | 23 36 42.5 | 23 54 46 | 0.122 | N | C95 | ||||||
| A2634 | 23 38 29.3 | 27 01 53 | 0.0298 | 1000 | 1.253 | 0.338 | 257 | D96 | NGC7720 | ||
| A2657 | 23 44 57.3 | 09 11 36 | 0.0401 | 1000 | 1.123 | 0.377 | 220 | D96 | MCG+01-60-030 | ||
| A2665 | 23 50 50.6 | 06 09 00 | 0.0567 | 1000 | 1.712 | 0.409 | 60 | D96 | MCG+01-60-039 | ||
| A2675 | 23 55 42.6 | 11 20 35 | 0.0746 | 1000 | 2.211 | 0.321 | 65 | D96 |
| Cluster | RA | DEC | Redshift | Lines? | Exp | Airmass | A(V) | p.a. | Ref | Notes | |
| (J2000) | (J2000) | (sec) | (mag) | (deg) | |||||||
| Z353 | 01 07 40.7 | 54 06 33 | (0.109) | C95 | low | ||||||
| A291 | 02 01 43.1 | –02 11 47 | 0.196 | C95 | |||||||
| A531 | 05 01 16.3 | –03 33 47 | 0.094 | C95 | |||||||
| RXJ0510.70801 | 05 10 47.8 | –08 01 44 | 0.217 | C95 | |||||||
| Z1121 | 06 31 22.7 | 25 01 07 | 0.083 | N | C95 | low , 3C162 | |||||
| Z1133 | 06 38 04.0 | 47 47 56 | 0.174 | C95 | low | ||||||
| A611 | 08 00 56.7 | 36 03 25 | 0.288 | N | C95 | sub-BCS | |||||
| A621 | 08 11 12.2 | 70 02 30 | 0.223 | C95 | sub-BCS | ||||||
| RXJ0821.00752 | 08 21 02.4 | 07 51 47 | 0.110 | C95 | sub-BCS | ||||||
| A761 | 09 10 35.9 | –10 35 00 | 0.091 | C95 | XBACS | ||||||
| RXJ1000.54409 | a | 10 00 25.1 | 44 09 14 | 0.155 | C95 | ||||||
| b | 10 00 31.1 | 44 08 44 | 0.153 | C95 | |||||||
| A971 | 10 19 52.0 | 40 59 19 | 0.093 | C95 | sub-BCS | ||||||
| A1023 | 10 27 58.5 | –06 47 56 | 0.1165 | N | A92 | ||||||
| A1035 | 10 32 14.0 | 40 16 17 | 0.078 | 1000 | 1.120 | 0.093 | 110 | M95 | sub-BCS | ||
| A1045 | 10 35 00.1 | 30 41 39 | 0.1381 | A92 | sub-BCS | ||||||
| A1084 | 10 44 32.9 | –07 04 08 | 0.1329 | A92 | XBACS | ||||||
| A1173 | 11 09 15.2 | 41 33 43 | 0.0767 | 1000 | 1.028 | 0.102 | 342 | M95 | sub-BCS | ||
| Z3916 | 11 14 21.9 | 58 23 20 | 0.204 | C95 | |||||||
| Z4673 | 11 56 55.6 | 24 15 37 | 0.1419 | A92 | sub-BCS | ||||||
| Z5604 | 12 57 21.6 | 69 30 20 | 0.227 | C95 | |||||||
| A1651 | 12 59 22.4 | –04 11 44 | 0.0860 | A92 | XBACS | ||||||
| A1664 | 13 03 42.5 | –24 14 41 | 0.1276 | A92 | XBACS | ||||||
| A1672 | 13 04 27.1 | 33 35 16 | 0.1882 | A92 | |||||||
| A1703 | a | 13 15 05.1 | 51 49 04 | 0.2836 | A92 | ||||||
| b | 13 15 11.0 | 51 49 04 | 0.2336 | A92 | |||||||
| RXJ1449.5+2746 | 14 49 27.9 | 27 46 51 | 0.0311 | N | 1000 | 1.723 | 0.133 | 287 | D96 | sub-BCS, MCG+05-35-018 | |
| A2104 | 15 40 08.0 | –03 18 16 | 0.1554 | A92 | XBACS | ||||||
| A2146 | 15 56 13.8 | 66 20 55 | 0.2343 | A92 | sub-BCS | ||||||
| Z7833 | 16 10 00.7 | 67 10 15 | 0.2136 | A92 | |||||||
| A2187 | 16 24 13.9 | 41 14 38 | 0.1839 | A92 | sub-BCS | ||||||
| A2201 | 16 26 58.8 | 55 28 30 | 0.130 | C95 | |||||||
| A2208 | 16 29 38.8 | 58 31 52 | 0.1329 | A92 | |||||||
| A2228 | 16 48 00.8 | 29 56 59 | 0.1013 | A92 | Also AGN at same redshift | ||||||
| Z8193 | 17 17 19.1 | 42 26 59 | 0.1754 | A92 | |||||||
| A2292 | 17 57 06.7 | 53 51 38 | 0.119 | C95 | |||||||
| Z8451 | 19 57 14.0 | 57 51 27 | 0.0884 | A92 | low | ||||||
| Z8503 | 21 22 19.8 | 23 10 33 | 0.1430 | A92 | low | ||||||
| A2426 | 22 14 31.5 | –10 22 26 | 0.0990 | A92 | |||||||
| A2428 | 22 16 15.6 | –09 20 00 | 0.0846 | A92 | XBACS | ||||||
| A2631 | 23 37 41.1 | 00 17 06 | 0.278 | C95 | sub-BCS |
Notes on individual entries in Tables 1 and
2:
A21 Two galaxies form a double system in the slit, separated in projection by 6.8 arcsec (16kpc).
Galaxy a (to the SE) is the brighter, but galaxy b has an asymmetric diffuse envelope (see Porter,
Schneider & Hoessel 1991).
A115 The central cluster galaxy contains the radio source
3C28.
The ROSAT HRI image of this cluster shows two components to the X-ray
morphology, suggesting it to be a double cluster. The smaller
component to the south is centred on a galaxy at RA 00 56 00, Dec
26 20 37 (J2000) but we have taken a spectrum
for 3C28 at the centre of the main X-ray component.
RXJ0107.4+3227 This cluster is also known as the group IV Zw 038, and the
galaxy observed (NGC383) is associated with the
radio source 3C31. Colina & Perez-Fournon (1990) note a central dust lane in this galaxy.
A168 The observed galaxy is offset by 3–4′ from the X-ray centroid,
but the X-ray image of the cluster is broad with no tight core, and the
galaxy observed is clearly the brightest cluster galaxy.
RXJ0123.2+3327 (NGC499) and RXJ0123.6+3315 (NGC507) form a double system.
A262 The central cluster galaxy is known from ground-based images
to be bifurcated by a central dust lane (Colina & Perez-Fournon 1990),which splits the galaxy
continuum light in our slit into two components
separated in projection by 1.6 arcsec (0.8kpc). The
line emission is spatially centred exactly on the dust lane separating
these two components.
A272 We have taken a spectrum of the brightest dominant galaxy, although
a second candidate dominant galaxy lies 2.4 arcmin to the N.
A400 The dominant galaxies are a dumbell system separated by 16.2 arcsec
(kpc) in projection, and are associated with the twin radio
source 3C75.
Z808 The observed galaxy is associated with the radio source 4C01.06.
A407 Several bright galaxies appear to be embedded in a diffuse optical
halo within a region of diameter 60kpc. We present the spectrum only of the brightest galaxy.
RXJ0338.7+0958 is the cluster 2A 0335+096.
RXJ0341.3+1524 The observed galaxy is catalogued as III Zw 054.
A520 This is a bimodal cluster, and we have observed the
brightest (to the SW of the cluster) of three
dominant galaxies. This cluster was detected in the Einstein Medium
Sensitivity Survey (EMSS; Stocke et al. 1991).
A566 is associated with the radio source 4C63.10.
A576 Galaxy b, the more southerly of the two dominant galaxies observed
is the more probable central cluster galaxy.
A586 Two galaxies lie on our slit separated only by 5.1 arcsec (20kpc) in
projection. We present only the spectrum of the main galaxy
to the NW of the two.
RXJ0751.3+5012 This cluster has a disturbed X-ray morphology. The three galaxies
for which we have spectra are the bright more southerly galaxy (a)
and both components of a dumbell system to the north
(galaxy b to the E and c to the W of the pair; separated in
projection by 22.1 arcsec (15kpc)).
A602 We have taken the spectrum of each of the two equally bright dominant
galaxies in this double cluster.
A671 We have taken the spectrum only of the larger, brighter galaxy
surrounded by diffuse optical emission, which we assume is the BCG. A second very bright dominant
galaxy lies 3.1 arcmin to the SE.
A665 There is a second, less bright galaxy also within the slit,
10.6 arcsec (42kpc) to the SE of the dominant galaxy. We present
only the spectrum of the dominant galaxy.
A689 This galaxy was observed in C95, but the redshift given
in that paper is wrong. The spectrum is very noisy, and shows a
very blue galaxy with uncertain stellar absorption features. The new redshift has been
determined by Ebeling, Henry & Mullis (1999), and is confirmed as the
redshift of the cluster from spectra of two other galaxies.
The X-ray source
is coincident with a moderately bright radio source, which could contribute significantly to the X-ray flux of
the total cluster emission.
A750 The cluster contains an AGN at the same redshift. There are
two equally bright dominant galaxies, separated by 94 arcsec, but we
only present a spectrum of the galaxy to the SE; the other lies at RA 09 09
07, Dec 10 67 51 (J2000). This cluster and the
AGN were detected in the EMSS (Stocke et al. 1991).
A763 The identification of this source is confused. Our optical
identification of the point-like object at the X-ray centroid
(RA 09 12 31.0, Dec 15 55 25; J2000) is of a
star, despite it being associated with a moderate, spatially extended
radio source. The spectrum presented in this paper is of the
dominant galaxy 4.7 arcmin to the N of this star, which despite being the
nearest obvious BCG, is probably too far to be associated with the X-ray source.
A773 The two galaxies appear to be equally dominant.
RXJ1000.5+4409 Galaxy a is the more likely central dominant galaxy.
Z3179 There is an IRAS-detected, foreground () spiral galaxy 110′′ to the NW
of the observed galaxy.
A1023 Position of observed galaxy revised from A92.
A1035 The cluster is contaminated by a foreground group at
(Maurogordato et al. 1997).
A1185 This X-ray source is very extended. Galaxy a is the brightest of
the three observed, and agrees with the X-ray centroid.
A1190 We have taken a spectrum only of the brighter of two nearby dominant
galaxies, that to the SE of the pair; the radio
source 4C41.23. is associated with the other galaxy.
A1201 We have taken a spectrum of the galaxy closest to the X-ray centroid.
A brighter galaxy to the SE probably belongs to a foreground cluster.
A1204 Note that the declination given in A92 is incorrectly
given as .
A1361 The observed galaxy is associated with the radio source 4C46.23.
A1413 A second, smaller galaxy also lies on the slit, at a separation of only
9.5 arcsec (31kpc) to the N. We present the spectrum only of the main galaxy.
Maurogordato et al. (1997) note the presence of a small foreground group of
galaxies at .
A1437 The main galaxy is close dumbell, of separation 3.2 arcsec (10 kpc)
Z4803 This source is also catalogued as the poor group MKW4.
RXJ1206.5+2810 The observed galaxy (NGC4104) is a double galaxy in
the group MKW4s, the two components separated by
2.8 arcsec (2.2kpc). The emission line system
spans the two systems. The cluster is an EMSS source (Stocke et al. 1991).
Z4905 The observed galaxy has a very large and asymmetric halo on the POSS.
Z5029 The observed galaxy is not associated with the radio source 4C04.41 which lies in this cluster.
Notes on individual entries in Tables 1 and
2 continued:
RXJ1223.0+1037 The observed galaxy (NGC4325) may have nuclear activity as the X-ray source
is barely extended in archival PSPC data, although the line emission is
quite muted. Alternatively it could be an example of a
highly focussed cooling flow in a low luminosity group.
A1553 We have taken the spectrum of each of the two equally dominant
bright galaxies in
this double cluster.
RXJ1230.7+1220 is M87 in the Virgo cluster, and associated with the
radio source 3C274.
A1656 This is the Coma cluster, and we have taken the spectrum only of
the more Western of the two dominant galaxies, NGC4874 .
A1668 The measured redshift is significantly different from that in
Rhee & Katgert (1988).
A1672 Position of observed galaxy revised from A92.
A1677 Previously noted in A92 as Z5694. Position revised from original.
A1682 The two galaxies are equally dominant.
A1703 Galaxy a is the more likely central dominant galaxy.
RXJ1320.1+3308 Two equally bright galaxies lie along our slit position,
with a projected separation of 38.1 arcsec (38kpc).
A1758 This double cluster has its two components listed separately in Paper I.
We list here the dominant galaxy associated only with
A1758a, which produces approximately 40 per cent of the combined luminosity; there is a
bright less dominant galaxy also at RA 13 32 51.9, Dec 50 31 36 (J2000).
A1763 The observed galaxy is associated with the radio source 4C41.26.
A1775 The two dominant galaxies form a double system, separated in projection by 21.1
arcsec (kpc); they are associated with the radio source
4C26.41.
A1795 The observed galaxy is associated with the radio source 4C26.42.
A1831 The cluster shows a foreground cluster at
(Maurogordato et al. 1997).
A1835 We present three different observations of the same central cluster galaxy, one
from A92, and two from our May observing run at slightly different position angles.
A1914 This is a complex binary cluster, and we have only taken a
spectrum of the brighter
(to the SW) of the two dominant galaxies.
The radio source 4C38.39 is probably a radio halo and hence not associated with the
observed galaxy.
RXJ1440.6+0327 The source is also catalogued as the poor group MKW8 and the two galaxies observed are
also catalogued as Arp171. The galaxy (a) to the SE is probably the dominant
galaxy; the two galaxies on the slit are separated in projection by
by 59.2 arcsec (44kpc).
RXJ1449.5+2746 The observed galaxy is offset
from the centroid of this relatively
compact X-ray source, indicating that it may well be unrelated to the X-ray
emission.
A1983 Two equally bright dominant galaxies lie along the slit position, separated by 92.6 arcsec (112kpc)
Z7160 This cluster is the EMSS cluster MS1455+223 (Stocke et al. 1991).
A2009 The cluster contains the radio source 4C21.44 which
is, however, is unlikely
to be associated with the observed galaxy.
A2034 Galaxy b is the more likely central dominant galaxy.
A2029 The observed galaxy is associated with the radio source 4C06.53.
A2033 There are two galaxies along the slit; we take the spectrum of the
main galaxy to the NE as the central dominant galaxy. The galaxy 38
arcsec to the SW is a foreground AGN at a redshift of
0.038.
A2052 The observed galaxy is associated with 3C317.
A2055 There are three equally bright dominant galaxies;
a and b lie along the same slit position, separated in
projection by 80 arcsec (200kpc). None of these redshifts agrees with the
previously published redshift of 0.053 in Struble & Rood (1991).
A2064 The redshift of the observed galaxy is inconsistent with the
previously published redshift of 0.1074 from Owen, White & Thronson (1988)
from which the cluster redshift has been derived. We find no evidence
to support the previous redshift in our spectrum.
A2061 This bimodal cluster is highly extended.
We have observed the two equally bright dominant galaxies either side of the
X-ray centroid.
RXJ1522.0+0741 The source is also catalogued as the poor group MKW3s.
The central galaxy (NGC5920) is associated with the radio source 3C318.1.
A2065 There are three galaxies along our chosen slit position; galaxy a
is 52 arcsec to the NW, and galaxy c lies 21 arcsec to the SE of
the much less bright galaxy b. Galaxies a and c are both dominant galaxies.
A2069 This cluster is particularly extended and
the X-ray centroid lies between two bright galaxies; one the central dominant
galaxy in A2069 (galaxy a). Our spectrum of the second bright galaxy
at RA 15 24 22.7 and Dec 29 57 25 (J2000) shows it to be a foreground
active galaxy at a redshift of 0.076. This galaxy may be a weak
contributor to the total X-ray emission from the cluster, and we note that
its redshift suggests that it may be a outlying member of the nearby
cluster A2061. Also along our slit position for galaxy a
are two other cluster galaxies (b and c) 26 arcsec to the NW of galaxy a, and separated from each other by
only 4.1 arcsec (11kpc). This cluster is an EMSS cluster.
A2072 The X-ray centroid is offset by from the observed galaxy,
which is the nearest obvious BCG.
A2111 This cluster has two equally dominant central galaxies, separated by 47 arcsec (220kpc) in
projection. The X-rays from this cluster are elongated (Wang, Ulmer & Lavery 1997).
A2142 We have taken the spectrum of each of the two equally bright dominant galaxies in
this binary cluster. They lie along the same slit position, separated by
104 arcsec (238kpc).
A2146 The emission line ratios of the observed galaxy and a pointed
X-ray observation of the cluster show that this galaxy
contains an AGN (Allen 1995), but the deep ROSAT HRI image shows that the
majority of the flux is from extended cluster gas.
A2151 This cluster is resolved into two components by the RASS because
of its low redshift. We list here the dominant galaxy in A2151a, which
produces 93 per cent of the combined luminosity of the system.
RXJ1604.9+2356 The source is also catalogued as the poor group AWM4. The
observed galaxy is associated with the radio source 4C24.36.
A2199 The observed galaxy (NGC6166) is associated with 3C338.
A2204 Two galaxies lie along our slit position, separated by 4 arcsec
(14kpc). The galaxy to the SE has the strong extended line emission
associated with it, and we present the spectrum of only this galaxy.
Notes on individual entries in Tables 1 and
2 continued:
A2219 Galaxy b is the most likely central dominant galaxy.
A2228 The X-ray flux and centroid of the cluster source is likely to be
significantly affected by the presence of an AGN within, but not at the
centre of the cluster (see A92).
RXJ1657.8+2751 This source is also catalogued as the poor group AWM5.
A2256 This cluster is a well-known binary system. Galaxies a and b form a common system,
separated by 6.6 arcsec (10kpc), and galaxy c is a further 19 arcsec
to the NW along this slit. Galaxy d is a bright dominant galaxy to the E
of galaxies a,b and c, and the best candidate for a single central cluster
galaxy.
A2249 This cluster is a binary system and relatively extended in the X-ray. We have only taken a spectrum of one of the
two dominant giant elliptical galaxies (the more eastern) as it is in
better agreement with the X-ray centroid. The cluster is associated with
the radio source 4C34.45.
A2255 This cluster has two dominant galaxies separated by 53.7 arcsec (109kpc); each of these
galaxies appears to be a very close dumbell in its own right.
RXJ1733.0+4345 The observed galaxy (IC1262) is associated with 4C43.46.
RXJ1740.5+3539 Two dominant galaxies lie along this slit position,
separated by 38.9 arcsec (45kpc); galaxy b looks from the POSS to
be the more likely candidate for the central cluster galaxy.
Z8276 is an uncatalogued radio-loud galaxy.
Z8338 This cluster has two close central galaxies; we observed the
brighter to the East of the pair.
A2318 The X-ray centroid is offset from the galaxy observed, but note
that the galaxy position given in A92 is in error.
There is a Seyfert 1 galaxy coincident with the X-ray centroid at the redshift of the cluster,
, (Edge, private communication) so this source is significantly contaminated.
RXJ2114.1+0234 The observed galaxy (IC1365) has an asymmetric optical
halo on the POSS image, and is contained in the poor group II Zw 108.
A2443 The cluster contains two dominant galaxies. We have only
taken a spectrum of the brighter galaxy which is a better candidate for the
BCG. ; the other lies 2 arcmin to the
NW. This fainter galaxy is associated with 4C17.89.
Z8852 This highly extended X-ray source is the Pegasus Group. The
centre is occupied by two equally dominant galaxies: we have observed
NGC7499, and the other central galaxy NGC7503
(which we did not observe) is associated with the radio source 4C07.61.
NGC7499 is closer to the X-emission centroid.
A2572a This source is also catalogued as the compact group Hickson 94. There are two
galaxies along our slit, separated in projection 33.7 arcsec (37kpc).
Galaxy a is the brighter, but
galaxy b is embedded in an asymmetric optical halo on the POSS.
A2572b There is a second, higher-redshift cluster in the background of
A2572b that may contribute to the total X-ray flux measured from this
cluster (Ebeling, Mendes de Oliveira & White 1995).
A2626 This cluster has two close galaxies separated by 3.4 arcsec (5kpc), embedded in an
asymmetric halo extended to the SW component. Galaxy b (SW) has
line emission, and is associated with the radio source
3C464.
A2627 The two galaxies observed appear equally dominant.
A2634 The observed galaxy (NGC7720) is associated with 3C465.
| Cluster | RA | DEC | Redshift | Lines? | Ref | Notes | |
| (J2000) | (J2000) | ||||||
| RXJ0000.1+0816 | 00 00 07.1 | 08 16 49 | 0.040 | EHM99 | UGC12890 | ||
| RXJ0021.6+2803 | (S) | 00 21 36.9 | 28 03 04 | 0.094 | EHM99 | IV Zw 015 | |
| (E) | 00 21 44.0 | 28 03 56 | 0.094 | EHM99 | |||
| A68 | a (SE) | 00 37 06.8 | 09 09 25 | 0.250 | EHM99 | ||
| b (NW) | 00 37 04.9 | 09 09 47 | 0.259 | EHM99 | |||
| A75 | a (W) | 00 39 28.5 | 21 13 48 | 0.062 | – | SR91 | cluster redshift |
| b (E) | 00 39 42.3 | 21 14 06 | 0.058 | OLK95 | MCG+03-02-021 | ||
| A77 | 00 40 28.2 | 29 33 22 | 0.071 | OLK95 | UGC428, EMSS | ||
| A84 | a (SE) | 00 41 54.9 | 21 22 37 | 0.103 | – | SR91 | cluster redshift |
| b (NW) | 00 41 41.3 | 21 24 10 | 0.102 | OWT88 | 4C+21.05 | ||
| A104 | 00 49 49.8 | 24 27 03 | 0.082 | – | SR91 | cluster redshift | |
| RXJ0058.9+2657 | 00 58 22.7 | 26 51 57 | 0.048 | DC95 | NGC326, 4C+26.03 | ||
| A147 | 01 08 12.0 | 02 11 39 | 0.042 | P78 | UGC701 | ||
| A160 | 01 12 59.6 | 15 29 28 | 0.044 | OLK95 | MCG+02-04-010 | ||
| A189 | 01 25 31.3 | 01 45 34 | 0.019 | S78 | NGC533, EMSS | ||
| Z1261 | 07 16 41.1 | 53 23 10 | 0.064 | GB82 | 4C+53.16 | ||
| Z1478 | a | 07 59 44.3 | 53 58 57 | 0.104 | EHM99 | ||
| b | 07 59 41.0 | 54 00 11 | 0.104 | EHM99 | |||
| c | 07 59 39.2 | 54 00 54 | 0.104 | EHM99 | |||
| Z1953 | 08 50 07.2 | 36 04 13.1 | 0.374 | EHM99 | |||
| Z2089 | a | 09 00 36.8 | 20 53 43 | 0.235 | EHM99 | ||
| b | 09 00 40.1 | 20 54 35 | 0.235 | EHM99 | |||
| c | 09 00 36.6 | 20 53 43 | 0.235 | EHM99 | |||
| A781 | a | 09 20 25.1 | 30 31 33 | 0.304 | EHM99 | ||
| b | 09 20 25.6 | 30 29 40 | 0.293 | EHM99 | |||
| RXJ1053.7+5450 | 10 53 36.6 | 54 52 06 | 0.070 | EHM99 | |||
| A1235 | 11 23 15.6 | 19 35 53 | 0.104 | – | SR91 | cluster redshift | |
| A1367 | 11 45 05.0 | 19 36 23 | 0.021 | OLK | |||
| A2108 | a | 15 40 15.9 | 17 52 30 | 0.092 | – | SR91 | cluster redshift |
| b | 15 40 18.9 | 17 51 25 | 0.092 | – | SR91 | cluster redshift | |
| c | 15 40 17.9 | 17 53 05 | 0.092 | – | SR91 | cluster redshift | |
| A2218 | 16 35 49.1 | 66 12 45 | 0.172 | LPS92 | |||
| RXJ1651.1+0459 | 16 51 08.1 | 04 59 35 | 0.154 | T93 | Her-A, 3C348, MCG+01-43-006 | ||
| A2241 | 16 59 43.9 | 32 36 56 | 0.0984 | U76 | PGC59392 | ||
| A2312 | 18 54 06.1 | 68 22 57 | 0.095 | M97 | |||
| RXJ2214.7+1350 | 22 14 47.0 | 13 50 28 | 0.026 | LM89 | NGC7237, 3C442 | ||
| A2622 | 23 35 01.4 | 27 22 22 | 0.061 | OLK95 | |||
| Z9077 | 23 50 35.4 | 29 29 40 | 0.095 | DSG92 | EMSS |
References:
DC95 Davoust & Considere 1995;
DSG92 Donahue et al. 1992;
EHM99 Ebeling, Henry & Mullis 1999;
GB82 Gregory & Burns 1982;
LM89 Laurikainen & Moles 1989;
LPS92 Le Borgne, Pello & Sanahuja 1992;
M97 Maurogordato et al. 1997;
OLK95 Owen et al. 1995;
OWT88 Owen et al. 1988;
P78 Peterson 1978;
S78 Sandage 1978;
SR91 Struble & Rood 1991;
T93 Tadhunter et al. 1993;
U76 Ulrich 1976
Notes on individual entries in Table 3:
There are five dominant galaxies with no redshift in the literature. The
position of that galaxy is given but the redshift of the cluster is
tabulated.
RXJ0001.6+0816 The central galaxy shows [NII] and [SII] line emission
(EHM99).
RXJ0021.6+2803 Galaxy a is the BCG.
RXJ0058.9+2657 The central galaxy (NGC326) is a dumbbell galaxy.
A68 Galaxy a is the brighter galaxy, nearer the RASS centroid.
A75 Galaxy a is the more likely BCG, but is very close to a bright star, making a observation
difficult. Galaxy b is the radio galaxy 0037+209 (Owen, Ludlow & Keel 1995).
A77 This galaxy contains the radio source 0037+292 (Owen et al. 1995).
A84 Galaxy a is the better candidate for the BCG. The redshift for
galaxy b quoted by O’Dea & Owen (1985) is from Owen & White
(1984; in preparation) for which we can find no subsequent reference.
A104 Owen et al. 1995 showed that another galaxy in the cluster (harbouring the
radio source 0047+241) and west of the
dominant one listed in Table3, at
RA 00 49 41.8, Dec +24 26 42 (J2000) has H +[NII] emission, but no
[OII]3727 emission.
Z1478 None of the galaxies listed in Table 3 is the central dominant
galaxy, which lies almost exactly behind a star, at
RA 07 59 40.4, Dec +54 00 22 (J2000).
Z1953 HRI observations of this cluster suggest that as much as two
thirds of the X-ray flux assigned to this system based on the RASS
observation are in fact due to two X-ray point sources wihtin 7 arcmin of
the cluster (Ebeling, private communication).
Z2089 Galaxy (a) at the X-ray centroid has strong line emission with the line ratios
([NII]/H and [OIII]/H) suggestive of an AGN. The X-ray source is clearly
resolved in a recent ROSAT HRI image supporting its inclusion as a cluster
in the BCS.
A781 A third galaxy at RA 09 20 22.3, Dec 30 30 53 (J2000) shows H in emission, but
is foreground at a redshift of 0.126 (Ebeling, Henry & Mullis 1999). It is not clear whether galaxy a
or b is the BCG, although b is brighter.
RXJ1053.7+5450 The observed galaxy is to the NW of a very extended
X-ray source. There are several other slightly fainter galaxies the SE.
A1367 The BCG is NGC3862, which is associated with
the strong radio source 3C264, and detected as an unresolved point source
in ROSAT images contributing
approximately 5% to the total X-ray emission from the
cluster (Edge & Röttgering 1995).
NGC3862 is significantly offset from the centre of the highly
extended X-ray emission, and is observed to have a weak emission line
spectrum ([NII]H, weak [OII]) with evidence for a blue continuum.
HST observations reveal that
3C264 contains a nonthermal core and jet (Baum et al. 1998) which could
contribute to this blue continuum.
We have observed the galaxy NGC3860 at RA 11 44 49.1, DEC 19 47 44 (J2000),
which is the brightest galaxy in the broad cluster core. NGC3860 has
has strong extended line emission, dominated by H.
A2108 There are three galaxies of equal rank in the core of this cluster.
RXJ1651.1+0459 Hercules-A has moderate [OII]3727 and weak [OIII]5007 ([OIII]/[OII]=0.2) emitted by one of
two diffuse continuum components separated by 3 arcsec (10.5 kpc;
Tadhunter et al. 1993).
A2241 This optical position and redshift of this cluster is confused
in the literature; A2241 appears to be a
a superposition of an X-ray bright cluster at and an X-ray
faint group at . The X-ray bright cluster
detected by ROSAT is clearly centred on PGC59392 at a redshift ,
which is also associated with the radio source 4C32.52C.
The galaxies at are more than ten arcmin from the X-ray peak,
and form a separate system not detected by the RASS.
RXJ2214.7+1350 The cluster has two central galaxies (NGC7236/7) sharing a disturbed halo.
Z9077 This source is an EMSS cluster, MS 2348.0+2913 (Stocke et al. 1991). The central galaxy has
H +[NII] emission at a flux of discovered from narrow-band imaging by Donahue et al. 1992.
3 Data Analysis and Results
3.1 New redshifts
We have obtained a total of eighteen new cluster redshifts for the BCS, which are listed with a redshift marked in bold font in Tables 1 and 2 (the redshift of the cluster is assumed the same as that of its BCG). The redshifts were determined using the cross-correlation technique detailed in A92 and C95. We have compared the redshifts we have derived for our whole sample to all those available in the literature, and find that errors in our redshift are typically less than . The only exceptions are those spectra taken on the fourth night in the May 1995 run which have a less precise wavelength calibration; these redshifts are quoted to within . One new X-ray discovered cluster (RXJ1532.9+3021) was discovered to have a redshift of 0.3615, the second highest in the BCS.
3.2 Completeness of sample
Combining both the new observations presented here and those observations from A92 and C95, we have compiled a total spectral sample of 256 dominant galaxies in 215 clusters. 213 of these spectra are of dominant galaxies in 177 clusters of the BCS, leading to a completeness in coverage of 87 per cent for this sample. With the sole exception of 3C264 in A1367, we have spectra for all the BCG in the BCS down to an unabsorbed X-ray flux limit of (98 clusters); this limit corresponds to a luminosity of at =0.1, at =0.2 and at =0.3 (in the ROSAT 0.1-2.4 keV band). [We have basic information on whether a BCG has an emission-line spectrum or not down to an X-ray flux of (109 clusters).] Fig 1 shows the redshift distribution for all clusters in the BCS, and the distribution of those for which we have optical spectra; for redshift bins at we have spectra of over 83 per cent of the BCS BCG.


3.3 Occurrence of line emission
Many of the spectra show strong low-ionization emission lines commonly observed in central cluster galaxies (eg: Heckman 1981, Hu et al. 1985, JFN, Heckman et al. 1989, A92 and C95). The major coolants are hydrogen and oxygen, and lines of nitrogen and sulphur are also strong. We have marked which galaxies show such line emission by a tick () in column 5 of Tables 1 and 2. We determine whether or not a galaxy has line emission if the lines of [NII]6548,6584 (the most common coolant) can be fit at the redshift of the galaxy, at an intensity significantly () above the noise in the galaxy continuum. As we are sampling down to lower values of X-ray luminosity than in A92 and C95, we also find a population of galaxies that show only low-level [NII]6548,6584 line emission with H in absorption. These galaxies are marked separately in column 5 of Tables 1 and 2 by an ‘N’. We show the slit spectrum of all the line emitters with L(H)in Fig 2, including for completeness those from A92 and C95. The spectra are presented in descending order of the observed H luminosity (ie not corrected for any internal reddening as detailed in section 3.9). Some of the galaxy spectra have been smoothed with a box 3 pixels wide (these are noted in the title of each plot). Fig 3 shows three examples of the galaxies that only feature [NII] line emission. We determine a flux limit for the detection of H emission by investigating the redshift-dependence of the fitted H luminosity. We find that below a redshift of 0.05, a systematic uncertainty in the level of stellar H absorption expected from the underlying galaxy continuum dominates our detection level, leading to an upper limit to H of . Beyond this redshift, we find the detection limit to rise according to the expected relation. We fit this slope at what we estimate to be the least significant detection of H in emission in a galaxy at , and extrapolate to obtain H luminosity limits of , and and at redshifts of 0.1, 0.2 and 0.3 respectively.
Taking the 203 members of the BCS sample (excluding the ‘b’ components of the A2572, A2151 and A1758 clusters and including the two clusters at ), 325 per cent show some level of line emission (ie including those with only [NII] and no H), and 274 per cent show H in emission; we assume that the five clusters for which the emission-line properties of the BCG are not known are not line-emitters, and obtain the errors assuming that statistics are applicable. The fractions of line-emitters are similar if we include all the galaxies from Table 2 that are not bona fide members of the BCS, at 345 per cent and 274 per cent for all emitters, and H-only emitters respectively.
Fig 4 shows the frequency of line emitters as a function of the X-ray luminosity ( is taken from Paper I) for all the BCS sample, and then for all clusters included in this paper for which we have an X-ray flux (ie including those in Table 2 that are in the sub-BCS and XBACS). The data have been grouped so as to contain an equal number (45–50) of clusters per luminosity bin. In both samples there is no compelling evidence for an increase in the frequency of line emission with X-ray luminosity, the distribution in each case being consistent with a constant fraction around 31.54 per cent (including 6 per cent with [NII]-only line emission).
Fig 5 shows the frequency of line emitters as a function of redshift, both for the BCS and for all the clusters in this paper. We have grouped the sample into an equal number of clusters per redshift bin (50), and again assume that the five clusters whose BCG optical properties are not known are not line emitters. Both samples show the fraction to be high in the lowest redshift bin; assuming that the galaxy line luminosity is correlated with the cluster X-ray luminosity, the threshold for detecting line-emitters will be lower at low redshift. The frequency of line emission drops sharply at a redshift of 0.07, and then climbs back up to a fraction above 30 per cent above a redshift . The BCS X-ray flux limit pre-selects the most luminous clusters at any epoch, and by a redshift of 0.2 will include only those clusters whose X-ray luminosity is boosted by the presence of a massive cooling flow (which would enhance the probability of line emission), or because it is a binary cluster system with whose X-ray emission has been enhanced because it is blended (and such systems usually do not have cooling flows). Fig 4, however, indicates that the fraction of line-emitters is not dependent on X-ray luminosity, so the rise in the fraction of line emitters with redshift may reflect a real increase in the number of sites promoting line emission at . To test this, we looked at the 10 clusters in the complete (ie ) BCS that have an X-ray luminosity above , which corresponds to the flux limit of at the redshift of the furthest cluster in the sample (). Only one of the five clusters with a redshift has line emission in the central galaxy, whereas 4 out of the five at do. Dropping the X-ray luminosity cut-off to , however, results in equal numbers of line-emitters in the 17 clusters below and 16 clusters above 0.23. Thus any evidence for evolution in the frequency of occurrence of line emission (and thus presumably massive cooling flows) with redshift (eg Donahue et al. 1992) is only very tentative, and can involve only the most luminous clusters.
Whilst a cooling flow is not the only possible cause of line emission around a BCG, all but five of the 64 H-emitting central galaxies (those in A1068, A2089, A2146, A2294, and RXJ0821.0+0752: see section 3.7 and notes to the tables) have line intensity ratios consistent with the nebulae seen around the central cluster galaxies of known cooling flows. Removing these five exceptions from consideration only decreases the overall frequency of line emission by 2 per cent in either the BCS, or all clusters for which we have spectra.
We find, however, a higher probability that a purely X-ray selected cluster will contain an emission-line system around its BCG. Of the 39 ‘RXJ’ BCS clusters listed in Tables 1 and 3, 19 have a BCG with line emission and 19 do not, and only 1 has [NII]-only emission. Including also the ‘RXJ’ clusters in Table 2, 20 out of the 43 show H in emission, with only 2 [NII]-only emitters. The fraction of line emitters is significantly greater in the ‘RXJ’ clusters than in the sample as a whole. This is not simply a selection of the RXJ systems being at lower redshift, and thus line emission being easier to detect in the central cluster galaxy. Of the 29 Abell and 31 RXJ clusters at in Tables 1 and 3, only 5 (and a sole [NII]-only emitter) of the central galaxies in the Abell clusters show line emission; 16 (plus 2 [NII]-only emitters) of the RXJ systems have line emission. Assuming that the emission line nebulae are (nearly) all tracing the presence of a cooling flow in these clusters then this suggests that the X-ray selected clusters contain a higher fraction of cooling flows. This is most likely due to not only the fact that the RASS X-ray detection algorithm used to construct the BCS is most sensitive to point or peaked X-ray sources (Paper I), but also that cooling flows may enhance the X-ray luminosity of a cluster (Allen & Fabian 1998). Thus the X-ray selected samples will preferentially contain cooling flow clusters (see also Pesce et al. 1990).
Only 36 of the 59 H-line emitters show significant [OII]3727 line emission, although this fraction of 6113 per cent should be regarded as a lower limit to the true fraction. Detectability of [OII] will be affected both by any dust intrinsic to the galaxy (see section 3.9), and by atmospheric refraction, given that the slit placement is decided on the red galaxy image.


3.4 Comparison of X-ray and optical centroids
We have calculated the projected separation between the X-ray centroid of each cluster detection in the RASS (from Paper I) and the optical position of its BCG. Where identification of a single dominant galaxy is not obvious, we have used the co-ordinates of the galaxy nearer to the X-ray centroid. We have also excluded galaxies with AGN-type line intensity ratios (see section 3.7), as there is a small possibility that an X-ray centroid may be skewed towards a BCG if it is itself an X-ray emitter (although ROSAT HRI images demonstrate that point source contamination is in general not a problem). Although the coordinates of each optical galaxy are very well determined from the digitized POSS (Tables 1– 3), the positions for the RASS X-ray sources are far less well determined due to the broadness of the RASS point-spread function. To make things worse, the attitude solution for the RASS is less accurate than the one for pointed ROSAT observations, the photon statistics in the RASS are generally poor and faint blends are harder to recognize, all of which effects combine to give X-ray positional errors of up to about 1 arcmin. A few sources may have larger errors on the X-ray centroid if the cluster contains an AGN or substantial substructure.
Even with these caveats on the accuracy of the X-ray position, we find that the projected separation between the X-ray centroid of the cluster and the optical position of the dominant galaxy differs according to the emission-line properties of the BCG. The line emitters (including the [NII]-only emitters) show a much smaller average separation between the BCG and cluster X-ray centroid (with a mean of 296 kpc), than do the others (a mean of 898 kpc). Assuming that the majority of the line emitting galaxies are contained in cooling flows, this is consistent with the results of both Peres et al. (1998) and Allen (1998) that the offset between the X-ray centroid and the brightest central galaxy, or the gravitational lensing centre are larger for non-cooling flow clusters. A precise positional coincidence is not necessarily expected, especially if the cluster contains a strong central radio source that may have displaced the cooling gas at the very centre, eg 3C84 in the Perseus cluster (Böhringer et al. 1993). We will address this issue further in the next paper in the series, using better X-ray centroids obtained from pointed ROSAT observations of this sample and also X-ray confirmation of whether an individual cluster contains a cooling flow.
3.5 Continuum spectral indices
The ultraviolet/blue continuum sometimes seen in BCG is usually ascribed to the light from an excess young stellar population (eg JFN; McNamara & O’Connell 1989, 1992, 1993; Allen 1995; McNamara et al. 1998). The level of massive star formation can be assessed from its effect on absorption features in the spectrum of the galaxy (JFN, Cardiel, Gorgas & Aragon-Salamanca 1995, 1998). The excess blue light is concentrated towards the central 5-10 kpc of the galaxy, and outside of this region the stellar spectral indices are very similar to that of an ordinary giant elliptical galaxy (Cardiel et al. 1998). Thus to make a meaningful comparison between galaxies in our sample, where possible we measure the continuum spectral indices in a spectrum taken from the same central region of a galaxy.
A spectrum for each galaxy was extracted from a projected aperture of diameter 10 kpc along the slit. This extraction is straightforward for the lower-redshift objects, whereas the accuracy of obtaining a 10 kpc aperture at the more distant galaxies was dictated by whether the intensity peak fell on one or between 2 rows of the detector, and the need to extract a spectrum using an integer number of rows. In practise the spectra are extracted from aperture sizes varying only between 8.6 and 11.2 kpc; we have listed the aperture used in column 2 of Table 4 where the stellar indices derived from these spectra are tabulated. Selecting a central aperture is only possible for the new IDS observations presented in this paper. For the FOS spectra taken from A92 and C95 we cannot specify the aperture (other than an upper limit taken from the slit length of 6 arcsec) as the spectra were extracted using an automatic optimal extraction technique that does not yield spatially extended information. The aperture taken to produce the spectra from the WHT observations in C95 is unknown.
The common presence of Balmer line emission in the blue continuum-excess galaxies precludes the use of standard Balmer absorption line indices to assess the stellar population. Instead we measure the strength of two other stellar features in our spectra: the Mg2 index (which assesses the depth of the MgH and Mgb molecular bands at 5177Å; as defined by Faber et al. 1985) and the ‘4000Å-break’:
The 4000Å-break was originally defined from spectra in (Bruzual 1983) but note that here we measure it from an spectrum. We also use a wider colour ratio, BR, more suited to testing the presence of an excess blue continuum, as defined in A92 and C95:
Unlike both D4000 and the Mg2 index, BR uses bandpasses free from line emission, although it is more sensitive to the presence of internal reddening (see section 3.9). D4000 can be affected by the emission lines [NeIII], [SII]4069/4076 and H, and the Mg2 index by [NI]5199 and [OIII]4959. In practise, these lines of [NeIII] and [SII] are rarely present in the BCG spectra, but contamination of Mg2 by [OIII] and [NI] is more commonplace. Where present, we remove emission lines by fitting them in a ‘residual’ spectrum created by subtracting a scaled non-emission-line galaxy template from the BCG (see section 3.6). This emission-line model is then subtracted from the original galaxy spectrum, and the D4000 and Mg2 stellar indices are measured from this line-corrected spectrum. The stellar indices for each galaxy are shown in Table 4, in RA order. Column 1 gives the name, and column 2 the projected spatial size of the aperture from which the given spectral indices are measured. Columns 3, 4 and 5 give the Mg2 index, D4000 and BR respectively. Column 6 presents the H luminosity from the given aperture – note that as the emission lines are often spatially extended beyond a 10 kpc diameter, this may represent an underestimate of the total H luminosity of the galaxy. Columns 7–9 give the estimate of internal reddening from the Balmer emission lines, and the corrected values of BR and H luminosity (see section 3.9). Bracketed values of D4000 in column 4 represent uncertain measures where examination of the spectrum suggests the abnormally high value is caused by a loss of blue light from the slit.
| Cluster | aperture | Mg2 | 4000Å | BR | L(H) | E(B-V) | revised | revised L(H) | |
| size | index | break | (1040erg/s) | BR | (1040erg/s) | ||||
| (kpc) | |||||||||
| A7 | 10.5 | 0.31 | 1.92 | 0.11 | — | — | — | — | |
| A21 | a | 10.1 | 0.30 | 2.12 | 0.05 | — | — | — | — |
| b | 10.1 | 0.31 | 2.09 | 0.08 | — | — | — | — | |
| A76 | 10.0 | 0.32 | 1.91 | 0.08 | — | — | — | — | |
| Z235 | 12.6 | 0.29 | 1.90 | 0.06 | 4.1 | — | — | — | |
| A115 | 8.8 | 0.33 | 1.60 | 0.14 | 12.7 | — | — | — | |
| RXJ0107.4+3227 | 10.4 | 0.31 | 1.78 | 0.09 | 0.5 | — | — | — | |
| Z353 1 | 15.9 | 0.24 | (7.1) | 0.02 | — | — | — | — | |
| A168 | 10.1 | 0.30 | 1.89 | 0.11 | — | — | — | — | |
| RXJ0123.2+3327 | 9.8 | 0.30 | 1.86 | 0.09 | — | — | — | — | |
| RXJ0123.6+3315 | 10.4 | 0.25 | 1.88 | 0.09 | — | — | — | — | |
| A193 | 10.0 | 0.29 | 1.77 | 0.09 | — | — | — | — | |
| A267 | 27.9 | 0.31 | 1.91 | 0.08 | — | — | — | — | |
| A262 | 10.2 | 0.28 | 1.95 | 0.08 | 0.6 | — | — | — | |
| A272 | 9.5 | 0.34 | 1.85 | 0.10 | — | — | — | — | |
| A291 | 25.1 | 0.28 | 1.56 | 0.23 | 45.9 | — | — | — | |
| RXJ0228.2+2811 | 10.1 | 0.30 | 1.85 | 0.09 | — | — | — | — | |
| A376 | 9.9 | 0.30 | 1.92 | 0.09 | — | — | — | — | |
| A400 | a | 10.2 | 0.31 | 1.90 | 0.07 | — | — | — | — |
| b | 10.9 | 0.29 | 1.86 | 0.07 | — | — | — | — | |
| A399 | 10.1 | 0.29 | 1.68 | 0.14 | — | — | — | — | |
| A401 | 10.6 | 0.28 | 1.58 | 0.13 | — | — | — | — | |
| Z808 | 22.4 | 0.23 | 2.02 | 0.08 | 4.6 | — | — | — | |
| A407 | 10.9 | 0.27 | 1.79 | 0.10 | — | — | — | — | |
| A409 2 | 20.8 | 0.28 | 2.47 | 0.08 | — | — | — | — | |
| RXJ0338.7+0958 | 9.7 | 0.28 | 1.37 | 0.11 | 10.3 | 0.43 | |||
| RXJ0341.3+1524 | 4.8 | 0.28 | 2.37 | 0.05 | — | — | — | — | |
| RXJ0352.9+1941 1 | 15.9 | 0.27 | (2.81) | 0.04 | 58.2 | 0.43 | |||
| A478 2 | 13.0 | 0.24 | 2.08 | 0.11 | 10.8 | 0.29 | 0.20 | 20.1 | |
| RXJ0419.6+0225 | 10.6 | 0.31 | 1.80 | 0.10 | — | — | — | — | |
| RXJ0439.0+0715 2 | 10.2 | 0.24 | 1.76 | 0.17 | — | — | — | — | |
| RXJ0439.0+0520 1 | 26.1 | 0.35 | 1.32 | 0.09 | 110.7 | 0.40 | |||
| A520 2 | 8.9 | 0.22 | 2.02 | 0.13 | — | — | — | — | |
| A523 | 10.7 | 0.32 | 1.82 | 0.12 | — | — | — | — | |
| A531 | 14.0 | 0.29 | 1.66 | 0.09 | — | — | — | — | |
| RXJ0503.1+0608 | 13.3 | 0.30 | 2.19 | 0.04 | — | — | — | — | |
| RXJ0510.7–0801 | 26.8 | 0.33 | 1.65 | 0.05 | — | — | — | — | |
| Z1121 | 12.6 | 0.18 | 1.13 | 0.11 | — | — | — | — | |
| Z1133 | 22.9 | 0.30 | 1.91 | 0.07 | — | — | — | — | |
| A566 | 9.9 | 0.29 | 1.62 | 0.15 | — | — | — | — | |
| A576 | a | 9.9 | 0.28 | 1.70 | 0.10 | — | — | — | — |
| b | 10.8 | 0.30 | 1.89 | 0.10 | — | — | — | — | |
| A586 | 10.5 | 0.28 | 1.73 | 0.17 | — | — | — | — | |
| RXJ0740.9+5526 | 10.5 | 0.29 | 1.76 | 0.07 | — | — | — | — | |
| RXJ0751.3+5012 | a | 9.8 | 0.29 | 1.96 | 0.08 | — | — | — | — |
| b | 10.2 | 0.28 | 1.49 | 0.12 | 0.5 | — | — | — | |
| c | 10.1 | 0.29 | 1.82 | 0.10 | — | — | — | — | |
| A602 | a | 9.9 | 0.21 | 1.74 | 0.11 | — | — | — | — |
| b | 9.9 | 0.31 | 1.53 | 0.12 | — | — | — | — | |
| A611 2 | 32.2 | 0.16 | 1.57 | 0.12 | — | — | — | — | |
| A621 | 27.3 | 0.23 | 2.03 | 0.04 | — | — | — | — | |
| RXJ0819.6+6336 | 10.9 | 0.34 | 1.62 | 0.14 | — | — | — | — | |
| RXJ0821.0+0752 | 16.0 | 0.27 | 1.73 | 0.10 | 30.3 | 1.16 | |||
| A646 | 10.5 | 0.25 | 1.39 | 0.17 | 15.6 | 0.06 | |||
| Z1665 | 10.8 | 0.28 | 1.65 | 0.11 | — | — | — | — | |
| A655 | 10.6 | 0.26 | 1.74 | 0.13 | — | — | — | — | |
| A667 | 20.0 | 0.31 | 1.92 | 0.07 | — | — | — | — | |
| A671 | 9.5 | 0.28 | 1.75 | 0.09 | — | — | — | — | |
| A665 | 11.1 | 0.19 | 1.76 | 0.12 | — | — | — | — |
| Cluster | aperture | Mg2 | 4000Å | BR | L(H) | E(B-V) | revised | revised L(H) | |
| size | index | break | (1040erg/s) | BR | (1040erg/s) | ||||
| (kpc) | |||||||||
| A689 2 | 31.0 | 0.04 | 1.06 | 0.38 | — | — | — | — | |
| A697 | 31.8 | 0.26 | 1.85 | 0.11 | — | — | — | — | |
| A750 2 | 10.9 | 0.15 | 1.91 | 0.16 | — | — | — | — | |
| A761 | 13.6 | 0.31 | 1.40 | 0.16 | — | — | — | — | |
| A763 | 9.4 | 0.26 | 1.80 | 0.12 | — | — | — | — | |
| A757 | 9.7 | 0.30 | 1.87 | 0.10 | — | — | — | — | |
| A773 | a | 26.8 | 0.27 | 2.32 | 0.11 | — | — | — | — |
| b | 27.4 | 0.31 | 1.90 | 0.10 | — | — | — | — | |
| A795 | 8.8 | 0.32 | 1.61 | 0.14 | 12.9 | — | — | — | |
| Z2701 | 26.7 | 0.28 | 1.81 | 0.06 | 8.7 | — | — | — | |
| RXJ1000.5+4409 2 | a | 21.0 | 0.12 | 1.93 | 0.08 | 2.2 | — | — | — |
| b | 20.8 | 0.33 | 2.23 | 0.09 | — | — | — | — | |
| Z2844 | 10.3 | 0.36 | 1.79 | 0.09 | — | — | — | — | |
| A961 2 | 9.7 | 0.24 | 2.44 | 0.07 | — | — | — | — | |
| A963 | 9.1 | 0.31 | 1.94 | 0.10 | — | — | — | — | |
| A971 | — | 0.20 | 1.96 | 0.08 | — | — | — | — | |
| A980 | 10.0 | 0.30 | 1.79 | 0.11 | — | — | — | — | |
| Z3146 | 32.0 | 0.22 | 1.14 | 0.42 | 704.7 | 0.20 | |||
| A990 2 | — | 0.36 | 2.13 | 0.12 | — | — | — | — | |
| Z3179 | 19.8 | 0.22 | 1.90 | 0.07 | 9.1 | — | — | — | |
| A1023 | 16.8 | 0.27 | 1.76 | 0.13 | — | — | — | — | |
| A1033 | 17.9 | 0.33 | 1.50 | 0.14 | — | — | — | — | |
| A1035 | 11.2 | 0.32 | 1.73 | 0.10 | — | — | — | — | |
| A1045 | 19.2 | 0.28 | 1.55 | 0.14 | — | — | — | — | |
| A1068 | 19.3 | 0.27 | 1.24 | 0.24 | 172.6 | 0.39 | |||
| A1084 1 | 18.6 | 0.30 | 2.16 | 0.04 | 8.0 | — | — | — | |
| A1132 | 11.1 | 0.32 | 1.76 | 0.12 | — | — | — | — | |
| A1173 | 11.0 | 0.26 | 1.69 | 0.08 | — | — | — | — | |
| A1177 | 11.2 | 0.28 | 1.80 | 0.08 | — | — | — | — | |
| A1185 | a | 10.0 | 0.26 | 1.64 | 0.09 | — | — | — | — |
| b | 10.8 | 0.25 | 1.84 | 0.08 | — | — | — | — | |
| c | 8.9 | 0.26 | 1.83 | 0.06 | — | — | — | — | |
| A1190 | 11.0 | 0.26 | 1.63 | 0.05 | — | — | — | — | |
| A1201 | 10.4 | 0.29 | 1.80 | 0.14 | — | — | — | — | |
| A1204 2 | 22.6 | 0.26 | 1.72 | 0.12 | 10.6 | — | — | — | |
| Z3916 2 | — | 0.24 | 1.44 | 0.04 | 30.2 | — | — | — | |
| A1246 | 24.5 | 0.28 | 1.83 | 0.13 | — | — | — | — | |
| A1302 | 9.7 | 0.34 | 1.78 | 0.10 | — | — | — | — | |
| A1314 | 9.7 | 0.33 | 1.76 | 0.08 | — | — | — | — | |
| A1361 | 16.8 | 0.35 | 1.48 | 0.11 | 13.5 | — | — | — | |
| A1366 | 9.7 | 0.25 | 1.24 | 0.23 | — | — | — | — | |
| A1413 | 9.2 | 0.34 | 1.75 | 0.10 | — | — | — | — | |
| Z4673 | 19.6 | 0.22 | 1.66 | 0.14 | — | — | — | — | |
| A1423 2 | — | 0.31 | 2.44 | 0.04 | — | — | — | — | |
| A1437 | a | 10.9 | 0.29 | 1.75 | 0.11 | — | — | — | — |
| b | 10.8 | 0.29 | 1.74 | 0.11 | — | — | — | — | |
| Z4803 | 9.6 | 0.29 | 1.86 | 0.07 | — | — | — | — | |
| RXJ1205.1+3920 | 6.1 | 0.16 | 1.88 | 0.07 | — | — | — | — | |
| RXJ1206.5+2810 | 9.9 | 0.28 | 1.82 | 0.11 | 0.7 | — | — | — | |
| Z4905 | 9.6 | 0.24 | 1.56 | 0.10 | — | — | — | — | |
| Z5029 | 9.6 | 0.34 | 1.67 | 0.09 | — | — | — | — | |
| RXJ1223.0+1037 | 10.1 | 0.27 | 1.69 | 0.09 | 0.5 | — | — | — | |
| A1553 | a | 10.3 | 0.27 | 1.98 | 0.10 | — | — | — | — |
| b | 10.6 | 0.32 | 1.72 | 0.13 | — | — | — | — | |
| RXJ1230.7+1220 | 9.9 | 0.32 | 1.72 | 0.11 | 0.1 | — | — | — | |
| Z5247 | 10.3 | 0.34 | 1.90 | 0.08 | — | — | — | — | |
| A1589 | 10.2 | 0.26 | 1.80 | 0.10 | — | — | — | — | |
| Z5604 2 | 27.7 | 0.23 | 1.26 | 0.04 | — | — | — | — | |
| A1651 | 13.0 | 0.39 | 1.94 | 0.06 | — | — | — | — | |
| A1656 | 10.2 | 0.29 | 1.94 | 0.09 | — | — | — | — | |
| A1664 | 18.0 | 0.29 | 1.24 | 0.37 | 113.8 | 0.46 |
| Cluster | aperture | Mg2 | 4000Å | BR | L(H) | E(B-V) | revised | revised L(H) | |
| size | index | break | (1040erg/s) | BR | (1040erg/s) | ||||
| (kpc) | |||||||||
| A1668 | 10.5 | 0.31 | 1.66 | 0.08 | 2.3 | — | — | — | |
| A1672 2 | 24.3 | 0.30 | 1.60 | 0.15 | — | — | — | — | |
| Z5694 | 24.0 | 0.24 | 2.05 | 0.09 | — | — | — | — | |
| A1682 | a | 27.0 | 0.31 | 1.85 | 0.19 | — | — | — | — |
| b | 28.2 | 0.33 | 1.50 | 0.14 | — | — | — | — | |
| A1703 | a | 31.9 | 0.25 | 2.22 | 0.08 | — | — | — | — |
| 2 | b | 28.2 | 0.13 | 0.85 | 0.15 | — | — | — | — |
| RXJ1320.1+3308 | a | 9.6 | 0.33 | 1.84 | 0.08 | 0.4 | — | — | — |
| b | 10.8 | 0.21 | 1.80 | 0.10 | — | — | — | — | |
| RXJ1326.3+0013 | 10.2 | 0.21 | 1.61 | 0.12 | — | — | — | — | |
| A1758 | 31.6 | 0.26 | 1.78 | 0.07 | — | — | — | — | |
| A1763 | 9.7 | 0.34 | 2.06 | 0.09 | — | — | — | — | |
| A1767 | 10.3 | 0.29 | 1.76 | 0.08 | — | — | — | — | |
| A1775 | a | 8.9 | 0.24 | 1.72 | 0.09 | — | — | — | — |
| b | 10.9 | 0.32 | 1.76 | 0.09 | — | — | — | — | |
| A1773 | 9.5 | 0.23 | 1.62 | 0.12 | — | — | — | — | |
| A1795 | 10.3 | 0.24 | 1.27 | 0.13 | 11.3 | 0.15 | |||
| A1800 | 9.4 | 0.26 | 1.68 | 0.10 | — | — | — | — | |
| A1809 | 9.9 | 0.30 | 1.81 | 0.10 | — | — | — | — | |
| A1831 | 12.2 | 0.28 | 1.75 | 0.11 | — | — | — | — | |
| A1835 | 10.4 | 0.10 | 1.16 | 0.33 | 163.9 | 0.40 | |||
| 10.4 | 0.14 | 1.15 | 0.29 | 144.0 | 0.55 | ||||
| 29.7 | 0.27 | 1.11 | 0.27 | 318.9 | 0.38 | ||||
| A1885 2 | 13.5 | 0.47 | 1.81 | 0.09 | 5.4 | — | — | — | |
| Z6718 2 | 11.0 | 0.34 | 1.90 | 0.05 | — | — | — | — | |
| A1902 2 | 21.5 | 0.15 | 1.46 | 0.23 | — | — | — | — | |
| A1914 | 10.5 | 0.32 | 1.77 | 0.11 | — | — | — | — | |
| A1918 | 10.1 | 0.28 | 1.78 | 0.09 | — | — | — | — | |
| A1927 | 10.1 | 0.32 | 1.84 | 0.07 | — | — | — | — | |
| A1930 | 10.8 | 0.30 | 1.67 | 0.12 | 2.4 | — | — | — | |
| RXJ1440.6+0327 | a | 9.9 | 0.28 | 1.80 | 0.08 | — | — | — | — |
| b | 9.9 | 0.28 | 1.79 | 0.07 | — | — | — | — | |
| RXJ1442.2+2218 | 10.1 | 0.32 | 1.92 | 0.11 | 3.7 | — | — | — | |
| RXJ1449.5+2746 | 10.2 | 0.33 | 1.80 | 0.10 | — | — | — | — | |
| A1978 | 9.4 | 0.32 | 1.78 | 0.09 | — | — | — | — | |
| A1983 | a | 10.0 | 0.26 | 1.50 | 0.12 | — | — | — | — |
| b | 10.4 | 0.24 | 2.02 | 0.06 | — | — | — | — | |
| A1991 | 9.9 | 0.27 | 1.62 | 0.10 | 1.1 | — | — | — | |
| Z7160 | 30.1 | 0.31 | 1.58 | 0.10 | 50.3 | 0.24 | |||
| A2009 | 9.7 | 0.19 | 1.60 | 0.13 | 6.1 | — | — | — | |
| A2034 | a | 16.6 | 0.28 | 2.10 | 0.05 | — | — | — | — |
| b | 16.1 | 0.26 | 1.69 | 0.08 | — | — | — | — | |
| A2029 | 9.8 | 0.28 | 1.72 | 0.10 | — | — | — | — | |
| A2033 | 9.7 | 0.32 | 1.70 | 0.12 | — | — | — | — | |
| A2050 | 9.7 | 0.34 | 2.19 | 0.10 | — | — | — | — | |
| A2052 | 9.4 | 0.26 | 1.64 | 0.10 | 2.6 | ||||
| A2055 | a | 8.8 | 0.16 | 1.14 | 0.25 | — | — | — | — |
| b | 8.8 | 0.25 | 1.82 | 0.09 | — | — | — | — | |
| c | 10.8 | 0.25 | 1.67 | 0.11 | — | — | — | — | |
| A2064 | 9.3 | 0.31 | 1.77 | 0.10 | — | — | — | — | |
| A2061 | a | 9.5 | 0.26 | 1.69 | 0.11 | — | — | — | — |
| b | 9.6 | 0.30 | 1.75 | 0.10 | — | — | — | — | |
| RXJ1522.0+0741 | 10.2 | 0.28 | 1.75 | 0.08 | — | — | — | — | |
| A2065 | a | 8.8 | 0.28 | 1.83 | 0.07 | — | — | — | — |
| b | 10.2 | 0.24 | 1.79 | 0.10 | — | — | — | — | |
| c | 9.4 | 0.33 | 1.77 | 0.08 | — | — | — | — | |
| A2063 | 9.9 | 0.25 | 1.75 | 0.08 | — | — | — | — | |
| A2069 | a | 9.6 | 0.32 | 1.86 | 0.09 | — | — | — | — |
| b | 9.3 | 0.27 | 1.76 | 0.09 | — | — | — | — | |
| c | 9.6 | 0.27 | 1.88 | 0.07 | — | — | — | — |
| Cluster | aperture | Mg2 | 4000Å | BR | L(H) | E(B-V) | revised | revised L(H) | |
| size | index | break | (1040erg/s) | BR | (1040erg/s) | ||||
| (kpc) | |||||||||
| A2072 | 10.5 | 0.31 | 1.93 | 0.11 | 4.8 | — | — | — | |
| RXJ1532.9+3021 | 8.6 | 0.14 | 1.18 | 0.32 | 415.5 | 0.21 | |||
| A2107 | 10.4 | 0.29 | 1.79 | 0.08 | — | — | — | — | |
| A2111 2 | a | 9.8 | 0.26 | 2.27 | 0.07 | — | — | — | — |
| 2 | b | 9.8 | 0.33 | 1.86 | 0.12 | — | — | — | — |
| A2110 | 10.1 | 0.28 | 1.74 | 0.10 | — | — | — | — | |
| A2104 2 | 21.1 | 0.31 | 1.53 | 0.18 | — | — | — | — | |
| A2124 | 9.7 | 0.28 | 1.70 | 0.10 | — | — | — | — | |
| A2146 | 28.3 | 0.30 | 1.38 | 0.14 | 141.3 | 0.20 | |||
| A2142 | a | 10.9 | 0.32 | 1.80 | 0.13 | — | — | — | — |
| b | 9.9 | 0.35 | 1.68 | 0.11 | — | — | — | — | |
| A2147 | 10.3 | 0.30 | 1.76 | 0.09 | — | — | — | — | |
| A2151a | 8.7 | 0.32 | 1.88 | 0.09 | — | — | — | — | |
| RXJ1604.9+2356 | 9.4 | 0.31 | 1.77 | 0.08 | — | — | — | — | |
| Z7833 | 26.5 | 0.25 | 1.79 | 0.11 | — | — | — | — | |
| A2175 | 10.0 | 0.33 | 1.75 | 0.09 | — | — | — | — | |
| A2187 2 | 23.9 | 0.23 | 1.91 | 0.10 | — | — | — | — | |
| A2201 2 | — | 0.17 | 1.95 | 0.05 | — | — | — | — | |
| A2199 | 10.2 | 0.29 | 1.73 | 0.08 | 2.7 | 0.10 | |||
| A2208 | 18.6 | 0.28 | 1.73 | 0.11 | — | — | — | — | |
| A2204 | 9.6 | 0.23 | 1.08 | 0.31 | 159.4 | — | — | — | |
| A2219 2 | a | 27.5 | 0.43 | 2.22 | 0.13 | — | — | — | — |
| 2 | b | 27.5 | 0.34 | 1.44 | 0.04 | — | — | — | — |
| 2 | c | 28.3 | 0.22 | 1.56 | 0.14 | — | — | — | — |
| A2228 2 | 14.9 | 0.46 | 1.89 | 0.08 | — | — | — | — | |
| RXJ1657.8+2751 | 9.0 | 0.28 | 2.07 | 0.14 | — | — | — | — | |
| A2244 | 10.3 | 0.27 | 1.68 | 0.10 | — | — | — | — | |
| A2256 | a | 9.1 | 0.28 | 1.67 | 0.09 | — | — | — | — |
| b | 9.4 | 0.30 | 1.94 | 0.06 | — | — | — | — | |
| c | 8.8 | 0.27 | 1.84 | 0.03 | — | — | — | — | |
| d | 9.9 | 0.27 | 1.79 | 0.08 | — | — | — | — | |
| A2249 | 9.2 | 0.28 | 1.69 | 0.10 | — | — | — | — | |
| A2255 | a | 10.5 | 0.33 | 1.71 | 0.10 | — | — | — | — |
| b | 9.3 | 0.25 | 1.74 | 0.08 | — | — | — | — | |
| RXJ1715.3+5725 | 9.3 | 0.27 | 1.65 | 0.11 | 1.2 | — | — | — | |
| Z8193 | 23.1 | 0.18 | 1.49 | 0.19 | 153.1 | 0.57 | |||
| A2254 2 | — | 0.36 | 2.05 | 0.04 | — | — | — | — | |
| Z8197 | 9.6 | 0.26 | 1.42 | 0.13 | 16.0 | 0.33 | |||
| A2259 2 | — | 0.24 | 2.15 | 0.07 | — | — | — | — | |
| RXJ1720.1+2638 | 8.8 | 0.31 | 1.25 | 0.14 | [12.7] | — | — | — | |
| A2261 2 | — | 0.35 | 2.48 | 0.04 | — | — | — | — | |
| A2294 2 | — | –0.02 | 1.56 | –0.03 | 30.2 | — | — | — | |
| RXJ1733.0+4345 | 9.6 | 0.29 | 1.78 | 0.09 | 0.2 | — | — | — | |
| RXJ1740.5+3539 | a | 10.3 | 0.26 | 1.62 | 0.07 | — | — | — | — |
| b | 10.2 | 0.30 | 1.84 | 0.08 | — | — | — | — | |
| Z8276 | 9.4 | 0.28 | 1.72 | 0.10 | 12.5 | 0.24 | |||
| Z8338 | 9.8 | 0.32 | 2.12 | 0.12 | — | — | — | — | |
| RXJ1750.2+3505 | 10.6 | 0.29 | 1.84 | 0.11 | 15.0 | — | — | — | |
| A2292 2 | — | 0.09 | 2.10 | 0.06 | 3.0 | — | — | — | |
| Z8451 | 13.3 | 0.41 | 1.61 | 0.14 | — | — | — | — | |
| RXJ2114.1+0234 | 10.2 | 0.30 | 1.90 | 0.10 | — | — | — | — | |
| Z8503 | 19.7 | 0.25 | 2.55 | 0.13 | — | — | — | — | |
| RXJ2129.6+0005 2 | 9.9 | 0.24 | 1.66 | 0.13 | 5.8 | — | — | — | |
| A2390 | 9.9 | 0.31 | 1.35 | 0.19 | 61.6 | 0.22 | |||
| A2409 2 | 20.2 | 0.25 | 1.60 | 0.14 | — | — | — | — | |
| A2426 | 14.6 | 0.29 | 1.21 | 0.12 | — | — | — | — | |
| A2428 | 12.8 | 0.35 | 1.22 | 0.16 | — | — | — | — | |
| A2443 | 11.2 | 0.30 | 1.97 | 0.09 | — | — | — | — | |
| A2457 | 9.8 | 0.31 | 2.04 | 0.06 | — | — | — | — |
| Cluster | aperture | Mg2 | 4000Å | BR | L(H) | E(B-V) | revised | revised L(H) | |
| size | index | break | (1040erg/s) | BR | (1040erg/s) | ||||
| (kpc) | |||||||||
| A2495 | 10.1 | 0.17 | 1.65 | 0.12 | 2.0 | — | — | — | |
| Z8852 | 9.9 | 0.30 | 1.92 | 0.09 | — | — | — | — | |
| A2572a | a | 9.1 | 0.33 | 2.04 | 0.06 | — | — | — | — |
| b | 9.9 | 0.33 | 2.00 | 0.07 | — | — | — | — | |
| A2572b | 9.2 | 0.28 | 1.86 | 0.09 | — | — | — | — | |
| A2589 | 9.1 | 0.31 | 1.89 | 0.09 | — | — | — | — | |
| A2593 | 9.6 | 0.31 | 1.91 | 0.09 | — | — | — | — | |
| A2626 | a | 10.3 | 0.27 | 1.87 | 0.08 | — | — | — | — |
| b | 10.2 | 0.29 | 1.95 | 0.08 | 1.1 | — | — | — | |
| A2627 | a | 18.0 | 0.14 | 1.22 | 0.27 | — | — | — | — |
| b | 17.4 | 0.29 | 2.28 | 0.07 | — | — | — | — | |
| A2631 | 31.5 | 0.24 | 2.12 | 0.10 | — | — | — | — | |
| A2634 | 9.8 | 0.32 | 1.85 | 0.09 | 1.3 | — | — | — | |
| A2657 | 9.9 | 0.27 | 1.83 | 0.10 | — | — | — | — | |
| A2665 | 10.5 | 0.29 | 1.82 | 0.09 | [0.6] | — | — | — | |
| A2675 | 10.7 | 0.25 | 1.91 | 0.09 | — | — | — | — |
Notes:
1. FOS spectrum with very little flux below 4000Å, suggesting
that the slit was not at the parallactic angle (see also spectra in Figs 3
and 4).
2. The spectrum is very noisy.
The H affected by a cosmic ray hit.
The FOS spectra in A92 and C95 were reduced using an optimal
extraction technique, so the precise aperture from which the spectrum is taken
is not known for each galaxy; we give the upper limit from the slit length
of 6 arcsec in column 2. The aperture used for extracting the
spectra in C95 taken with the ISIS on the WHT
is not known.
The 4000Å break in column 4 is measured from an spectrum
rather than . Bracketed values mark where an abnormal value is
due to loss of blue light from the slit.
The H line luminosity in column 6 is
measured for the spectrum taken from the given aperture and does not represent the total
line luminosity from the galaxy. A bracketed line luminosity shows
where the line flux may have been reduced by atmospheric absorption.
The E(B-V) in column 7 has been estimated from the
H/H ratio in the spectrum from the given aperture, and not from the total line fluxes given in Tables 5 and
6.
The ‘revised’
BR in column 8, and the ‘revised’ H luminosity in column 9
are after the spectrum has been corrected for internal
reddening by the amount shown in column 7.
Notes on individual galaxies:
A1437 There is overlap between the 10kpc apertures taken for each
component of the dumbbell galaxy
RXJ1206.5+2810 The centre of the aperture was taken as the midway between
the two galaxy components.
RXJ1750.2+3505 The H emission is badly affected by a cosmic ray hit.
A2626 The 10kpc aperture for each galaxy overlaps.
3.6 Emission-line fitting
We estimate the spatial diameter of the line emission along the slit by extracting a profile of the galaxy centred on the observed [NII] and H emission, and subtracting the profile of the galaxy in nearby line-free continuum (eg. 6400–6500Å). The nebulae often extend well beyond the kpc aperture used to find the stellar indices in section 3.5, so in order to measure the total line luminosities from the galaxy in the slit, we have extracted a spectrum from the total spatial region spanned by the emission lines. We cannot rule out the possibility that the nebulae could also be extended in a direction perpendicular to the slit position, so these line fluxes may sometimes give underestimates of the total line luminosity of the galaxy.
We fit the emission lines in close sets, such as the H +[NII]6548,6584+[SII]6717,6731+[OI]6300,6363 complex. Within such a set, the individual emission lines are modelled as gaussians fixed to be at the same redshift and velocity width as each other, and the underlying continuum is modelled by a linear function. The H +[NII]6548,6584 blend is sufficiently resolved to give good fits for individual line components (eg Z3146, RXJ0439.0+0520, Z8197 in Fig 2; although note that many other spectra in this figure are shown after smoothing and belie the ease of resolving the lines). The resulting fluxes for the red emission lines of galaxies are given in Table 5; lines that are partially affected, or even completely absorbed by the Earth’s atmosphere are marked by square brackets. The errors given on the fluxes are estimated from the confidence limits to the gaussian intensity in each line, assuming the fit to the (unweighted) spectrum has a reduced . Thus these errors do not take into account any systematics introduced by the data reduction. upper limits are estimated for lines not detected, assuming them to have the same redshift and velocity width as the rest of the complex. We also assume that any H in absorption due to the underlying stellar continuum is negligible in comparison to the H visible in emission (this point is assessed further in section 3.9).
We are unable to make such an assumption about stellar H absorption in the underlying continuum, however, as it is expected to be stronger relative to the H emission than is the case for H. In order to take the effects of stellar H absorption into account, we created a template galaxy from the averaged rest-frame spectra of 24 galaxies in our sample. These galaxies were chosen to have good signal-to-noise, no line emission, and ‘average’ stellar indices – ie Mg2 in the range 0.25–0.32 and D4000 between 1.65–1.95; the final template had an Mg2 index of 0.29 and D4000 of 1.9. The template was then normalized to each line-emitting central cluster galaxy at the region 5050–5100Å (in the rest frame; this comprises the flat left-hand shoulder of the Mg absorption feature) and subtracted to give a residual spectrum. The [OIII]4959,5007, H and [NI]5199 emission lines were then fit together in the residual spectrum, again with each line modelled by a gaussian of the same redshift and velocity width as each other. The fluxes of these blue emission lines are tabulated in Table 6, along with the flux of the [OII]3727 doublet which was also fit by a gaussian (a satisfactory fit at this spectral resolution). In Table 6 we list first the fluxes of H, [OIII] and [NI] from the fits to the non-template-subtracted spectrum, and second in each column we list the fits from the residual spectrum in square brackets. If no template-subtracted result is presented, it is no improvement on the previous fit. The correction for the underlying continuum is not very significant for all the strong line emitters (eg Z3146, A1835). Although one might expect the depths of the Mg2 and H absorption features to be well correlated for an old stellar spectrum, this might not be the case for galaxies containing a blue light component. Galaxies with the strong line emission are in fact those that also contain the excess blue continuum (A92, C95, Allen 1995), for which the template subtraction given here may not be the most appropriate. However, it is clear that the line emission in these galaxies is so strong that errors due to inaccurate stellar H absorption are minimal. Where the template subtraction is in danger of being most in error is if the galaxy contains a fading starburst with Balmer absorption lines at a maximum. Whilst this may not be a principal component of the most line-luminous systems, it may be relevant for lower-luminosity systems.
Most of the galaxies newly observed for this paper are either non-emitters or show lower-luminosity line emission than those in A92 and C95; only three of the new systems show a slit H luminosity above (RXJ1532.9+3021, A2204 and A2390). As well as being the second highest redshift cluster in the sample, RXJ1532.9+3021 contains an exceptionally line-luminous BCG, second only to that in Z3146.
The luminosity of the H line emission correlates with the size of the nebula (for those galaxies with spatially resolved spectra only), in the sense that the more luminous systems are larger. Fig 6 shows a plot of the observed H surface brightness against the diameter of the emission-line nebula. The systems at higher luminosity are clearly larger (mean diameter of 34 kpc, compared to 8 kpc for the lower-luminosity nebulae). These numbers are not precise, as the diameters are measured from slit positions placed at random over what may be an asymmetric nebula; this may be responsible for some of the scatter in the plot. Few of the lower-luminosity systems are any larger than those showing only [NII] line emission.
We find no correlation between the velocity width (taken from the fit to the H +[NII] emission line complex and corrected for the instrumental resolution) and the H luminosity for all the emission-line galaxies.

| Cluster | log L(H) | Size (kpc) | H | [NII]6584 | [SII]6717 | [SII] | [OI]6300 | [OI]6363 |
|---|---|---|---|---|---|---|---|---|
| Z235 | 40.61 | — | 1.3 | 2.3 | 0.9 | 0.6 | 0.1 | 0.1 |
| A115 | 41.33 | 38.0 | 1.2 | 1.0 | 0.2 | 0.6 | 0.1 | [—] |
| RXJ0107.4+3227 | 39.72 | 4.5 | 3.9 | 7.9 | 1.2 | [1.4] | 0.1 | 0.2 |
| RXJ0123.2+3327 | — | 3.3 | 0 | 7.0 | — | — | — | — |
| A262 | 39.74 | 6.9 | 4.6 | 13.3 | 4.2 | [2.9] | 0.3 | 0.1 |
| A291 | 41.66 | — | 2.5 | 2.0 | 1.5 | 0.7 | 0.6 | 0.2 |
| A400 a | — | 3.7 | 0 | 7.4 | [—] | [—] | — | — |
| A400 b | — | 2.5 | 0 | 3.5 | [—] | [—] | — | — |
| A401 | — | 10.6 | 0 | 0.9 | — | — | — | — |
| Z808 | 40.67 | — | 0.4 | 0.8 | 0.2 | 0.1 | 0.1 | 0.1 |
| RXJ0338.7+0958 | 41.25 | 31.8 | 35.3 | 42.7 | 14.8 | 11.2 | 9.2 | 4.6 |
| RXJ0352.9+1941 | 41.77 | — | 10.7 | 9.8 | 5.8 | 3.9 | 2.5 | 0.9 |
| A478 | 41.03 | — | 3.3 | 3.7 | 1.5 | 1.1 | 0.9 | 0.5 |
| RXJ0439.0+0520 | 42.04 | — | 5.4 | 8.1 | 3.1 | 1.9 | 0.9 | 0.4 |
| Z1121 | 40.16 | — | 0.5 | 0.7 | 0.1 | 0.1 | 0.1 | 0.1 |
| RXJ0751.3+5012 b | 39.81 | 8.2 | 2.7 | 8.9 | [—] | [—] | 0.4 | 0.2 |
| A611 | — | — | 0 | 0.4 | 0.1 | 0.1 | 0.1 | 0.1 |
| RXJ0821.00752 | 41.48 | — | 5.5 | 2.7 | 1.1 | 0.5 | 0.2 | 0.1 |
| A646 | 41.41 | 29.3 | 3.5 | 3.8 | 1.5 | [0.5] | 0.9 | 0.4 |
| Z1665 | 39.36 | 5.4 | 0.5 | 3.1 | [—] | — | — | — |
| A671 | — | — | [0] | [3.0] | — | — | — | — |
| A750 | — | 16.3 | 0 | 0.4 | — | — | — | — |
| A795 | 41.29 | 22.1 | 2.3 | 3.8 | [—] | [—] | 1.1 | 0.3 |
| Z2701 | 40.94 | — | 0.4 | 0.8 | 0.3 | 0.2 | 0.2 | 0.2 |
| RXJ1000.5+4409 a | 40.35 | — | 0.2 | 0.5 | 0.2 | 0.1 | 0.1 | 0.1 |
| RXJ1000.5+4409 b | 40.34 | — | 0.2 | 0.3 | 0.1 | 0.1 | 0.1 | 0.1 |
| Z3146 | 42.85 | — | 17.1 | 13.5 | 6.5 | 5.3 | 3.5 | 0.9 |
| Z3179 | 40.92 | — | 0.9 | 3.2 | 0.6 | 0.8 | 0.5 | 0.1 |
| A1023 | — | — | 0 | 1.0 | — | — | — | — |
| A1068 | 42.24 | — | 19.5 | 24.6 | 5.2 | 4.4 | 2.8 | 1.2 |
| A1084 | 40.91 | — | 1.0 | 1.2 | 0.6 | 0.1 | 0.4 | 0.1 |
| A1204 | 41.03 | — | 0.8 | 1.1 | 0.3 | 0.3 | 0.3 | 0.2 |
| Z3916 | 41.48 | — | 1.5 | 1.7 | 1.1 | 0.5 | [—] | [—] |
| A1361 | 41.13 | — | 2.2 | 3.6 | 1.4 | 0.6 | 0.4 | 0.4 |
| RXJ1206.5+2810 | 39.80 | 6.0 | 1.8 | 3.4 | [—] | [—] | 0.1 | 0.1 |
| Z4905 | 39.60 | 6.9 | 0.2 | 0.9 | — | [—] | — | — |
| RXJ1223.0+1037 | 39.71 | 6.1 | 1.8 | 4.4 | [—] | [—] | 0.1 | |
| RXJ1230.7+1220 | 39.11 | 0.9 | 23.2 | 142.2 | 20.3 | 38.3 | [1.6] | 1.9 |
| A1664 | 42.06 | — | 15.2 | 10.5 | 5.7 | 4.7 | 2.4 | 0.8 |
| A1668 | 40.37 | 10.5 | 1.3 | 3.9 | 1.2 | 0.5 | 0.6 | 0.1 |
| RXJ1320.1+3308 a | 39.74 | 4.8 | 1.0 | 3.0 | [0.3] | 0.9 | 0.2 | 0.1 |
| A1767 | — | 9.0 | 0 | 1.8 | [—] | [—] | — | — |
| A1795 | 41.07 | 26.2 | 6.9 | 7.9 | 4.0 | 2.9 | 1.9 | 0.7 |
| A1835 | 42.43 | 48.5 | 8.8 | 6.1 | 2.7 | 2.4 | 2.1 | 0.6 |
| 42.37 | 51.9 | 7.7 | 5.1 | 2.7 | 2.2 | 1.8 | 0.3 | |
| 42.50 | — | 10.4 | 7.7 | 3.4 | 2.2 | 1.9 | 0.7 | |
| A1885 | 40.73 | — | 1.5 | 1.7 | 0.8 | 0.3 | 0.5 | 0.1 |
| A1930 | 40.38 | 15.1 | 0.3 | 0.8 | [—] | [—] | 0.1 | 0.1 |
| RXJ1442.2+2218 | 40.65 | 24.0 | 1.1 | 2.7 | 0.2 | 1.1 | [—] | 0.1 |
| RXJ1449.5+2746 | 39.30 | 4.2 | 0.5 | 5.2 | [—] | — | — | — |
| A1991 | 40.08 | 8.8 | 0.8 | 2.1 | 1.1 | 0.7 | [0.4] | 0.4 |
| Z7160 | 41.70 | — | 1.6 | 1.4 | 0.8 | 1.0 | 0.6 | 0.3 |
| A2009 | 41.09 | 26.7 | 1.1 | [1.6] | 1.0 | 0.3 | 0.2 | 0.1 |
| A2033 | 40.05 | 8.3 | 0.4 | 1.5 | — | — | — | — |
| Cluster | log L(H) | Size (kpc) | H | [NII]6584 | [SII]6717 | [SII] | [OI]6300 | [OI]6363 |
|---|---|---|---|---|---|---|---|---|
| A2052 | 40.47 | 8.7 | 5.5 | 12.3 | 3.9 | 2.6 | 1.6 | 0.1 |
| A2055 a | — | 8.8 | 0 | 1.1 | — | — | — | — |
| A2072 | 40.68 | 18.9 | 0.7 | 1.3 | 0.4 | [—] | 0.2 | 0.1 |
| RXJ1532.9+3021 | 42.78 | 51.3 | 9.2 | 6.5 | 3.7 | 2.9 | 1.9 | 0.6 |
| A2146 | 42.15 | — | 5.4 | 9.2 | 2.2 | 2.8 | 0.9 | 0.4 |
| A2199 | 40.44 | 7.8 | 6.5 | 14.9 | [3.1] | 2.2 | 0.9 | 0.2 |
| A2204 | 42.29 | 55.4 | 18.5 | [23.3] | 8.7 | 9.6 | 5.0 | 2.3 |
| RXJ1715.3+5725 | 40.09 | 5.5 | 3.5 | 12.7 | [—] | 1.6 | [0.3] | 0.2 |
| Z8193 | 42.19 | — | 10.7 | 6.2 | 3.4 | 2.1 | 1.9 | 0.7 |
| Z8197 | 41.33 | 26.9 | 3.6 | 4.5 | 1.6 | 1.4 | 0.6 | 0.3 |
| RXJ1720.1+2638 | [41.18] | 15.1 | [1.3] | [0.5] | 1.1∗ | 0.6 | 0.4 | 0.4 |
| A2294 | 41.48 | — | 2.0 | 1.0 | 0.3 | 0.3 | 0.1 | 0.1 |
| RXJ1733.0+4345 | 39.26 | 3.2 | 0.4 | 2.2 | [0.5] | 0.4 | 0.1 | 0.1 |
| A2292 | 40.63 | — | 0.7 | 1.4 | 0.1 | 0.2 | 0.3 | 0.4 |
| Z8276 | 41.23 | 32.3 | 6.8 | 11.4 | 4.6 | 2.7 | 1.8 | 0.3 |
| RXJ1750.2+3505 | 41.23 | 15.8 | 1.2 | 2.9 | 0.7 | 0.2 | 0.3 | 0.2 |
| RXJ2129.6+0005 | 41.05 | 16.5 | 0.4 | 0.6 | 0.1 | 0.1 | 0.2 | 0.1 |
| A2390 | 41.99 | 36.1 | 3.8 | 4.3 | 1.9 | 0.5 | 1.0 | 0.1 |
| A2495 | 40.41 | 15.8 | 0.9 | 1.4 | 0.2 | 0.2 | 0.2 | [—] |
| A2626 b | [39.96] | 5.1 | [0.7] | 1.8 | 0.6 | 0.7 | 0.1 | 0.1 |
| A2627 a | — | — | 0 | 0.5 | —∗ | —∗ | 0.1 | 0.1 |
| A2627 b | — | — | 0.1 | 0.7 | 0.3 | 0.3 | 0.1 | 0.1 |
| A2634 | 40.12 | 7.5 | 3.4 | 18.1 | [—] | 0.5 | 0.2 | 0.3 |
| A2665 | 39.81 | 7.3 | 0.4 | 1.7 | 0.3 | 0.5 | 0.2 | 0.1 |
Notes:
H luminosities are expressed in units of , and are
the total slit luminosities, ie not those from the ‘10kpc
aperture’.
All fluxes are expressed in units of , and
are the total flux from the slit.
Values in square brackets are affected by atmospheric absorption.
H in absorption is marked as 0.
Values marked by an asterisk are affected by a cosmic ray hit
| Cluster | [OII] | H | [OIII]5007 | [NI] | |||
|---|---|---|---|---|---|---|---|
| Z235 | 1.5 | 0.4 | [0.5] | 0.6 | [0.4] | 0.1 | — |
| A115 | 1.4 | 0.2 | [0.5] | 0.1 | [0.2] | — | — |
| RXJ0107.4+3227 | 0.7 | 0.2 | [1.7] | 0.7 | [2.1] | 0.3 | — |
| A262 | 6.1 | 0.5 | [2.0] | 1.0 | [2.2] | 0.6 | — |
| A291 | 2.1 | 0.9 | [1.0] | 0.3 | [0.3] | 0.1 | [0.2] |
| Z808 | 0.7 | 0.1 | — | 0.2 | — | 0.1 | — |
| RXJ0338.7+0958 | 57.1 | 4.7 | [7.4] | 3.2 | [4.4] | 4.4 | [3.1] |
| RXJ0352.9+1941 | 5.0 | 2.0 | [2.2] | 1.4 | [1.4] | 0.7 | [1.0] |
| A478 | 0.5 | 0.9 | [0.8] | 0.5 | [0.4] | 0.5 | [0.2] |
| RXJ0439.0+0520 | 2.2 | 0.9 | [1.1] | 1.2 | [1.3] | 0.3 | [0.3] |
| Z1121 | 0.2 | 0.5 | — | 0.5 | — | 0.1 | — |
| RXJ0751.3+5012 b | 7.0 | 0.4 | [1.2] | 1.4 | [1.6] | 0.2 | — |
| RXJ0821.00752 | 0.4 | 0.2 | [0.4] | 0.2 | [1.0] | 0.19 | — |
| A646 | 4.6 | 0.9 | [1.1] | 0.3 | [0.3] | 0.7 | [0.4] |
| A795 | 3.3 | 0.2 | [0.4] | 0.5 | [0.7] | 0.1 | [0.1] |
| Z2701 | 0.9 | 0.5 | [0.6] | 0.1 | [0.1] | 0.2 | [0.4] |
| RXJ1000.5+4409 a | 0.5 | 0.1 | [0.1] | 0.2 | [0.2] | 0.2 | — |
| RXJ1000.5+4409 b | 0.5 | 0.1 | — | 0.1 | — | 0.1 | — |
| Z3146 | 15.0 | 4.6 | [4.6] | 2.6 | [2.5] | 1.4 | [2.0] |
| Z3179 | 0.8 | 0.1 | [0.2] | 0.8 | [0.8] | 0.1 | [0.2] |
| A1068 | 9.7 | 3.6 | [4.1] | 12.2 | [12.6] | 1.6 | [1.8] |
| A1084 | 0.7 | 0.2 | — | 0.2 | — | 0.1 | — |
| A1204 | 1.1 | 0.1 | [0.2] | 0.1 | [0.1] | 0.1 | [0.1] |
| Z3916 | 0.4 | 0.3 | [0.4] | 0.1 | [0.2] | 0.1 | — |
| A1361 | 3.4 | 0.8 | [1.0] | 0.9 | [0.9] | 0.3 | — |
| RXJ1206.5+2810 | 0.8 | 0.5 | — | 0.5 | — | 0.2 | — |
| RXJ1223.0+1037 | 2.6 | 1.0 | — | 0.5 | — | 0.6 | — |
| RXJ1230.7+1220 | 84.0 | 3.6 | [20.8] | 7.6 | [21.0] | 7.5 | — |
| A1664 | 10.9 | 2.7 | [2.9 ] | 1.4 | [1.5] | 0.6 | [1.1] |
| A1668 | 3.2 | 0.5 | [1.0] | 1.6 | [1.7] | 0.5 | [0.5] |
| RXJ1320.1+3308 a | 1.5 | 0.5 | [0.6] | 1.4 | [1.2] | 0.5 | — |
| A1795 | 11.4 | 1.4 | [2.0] | 1.2 | [2.0] | 1.2 | [1.6] |
| A1835 | 6.7 | 1.8 | [2.1] | 1.3 | [1.5] | 0.5 | [0.7] |
| 5.6 | 1.1 | [1.2] | 0.9 | [1.0] | 0.4 | [0.4] | |
| 6.3 | 1.8 | [2.2] | 1.6 | [1.7] | 0.6 | [1.6] | |
| A1885 | 2.2 | 1.0 | [1.2] | 0.5 | [0.4] | 0.2 | [0.3] |
| A1930 | 0.4 | 0.3 | — | 0.3 | — | 0.1 | — |
| RXJ1442.2+2218 | 3.1 | 0.2 | [0.4] | 0.4 | [0.7] | 0.2 | — |
| RXJ1449.5+2746 | 2.7 | 0.2 | [0.9] | 0.3 | [1.6] | 0.5 | — |
| A1991 | 1.1 | 0.1 | [0.1] | 0.3 | [0.4] | 0.2 | — |
| Z7160 | 1.3 | 0.1 | [0.3] | 0.1 | [0.1] | 0.1 | — |
| A2009 | 1.2 | 0.2 | [0.4] | 0.1 | [0.3] | 0.2 | [0.2] |
| A2052 | 7.5 | 0.6 | [1.4] | 5.7 | [5.9] | 0.3 | [0.7] |
| A2072 | 0.7 | 0.1 | [0.3] | 0.1 | [0.2] | 0.1 | [0.2] |
| RXJ1532.9+3021 | 9.2 | 2.5 | [2.5] | 1.4 | [1.4] | 0.7 | [0.9] |
| A2146 | 4.6 | 1.4 | [1.5] | 10.7 | [10.6] | 0.4 | [0.7] |
| A2199 | 8.9 | 0.7 | [2.0] | 1.6 | [2.4] | 0.1 | [0.8] |
| A2204 | 25.5 | 4.9 | [5.6] | 3.0 | [3.8] | 1.5 | [2.7] |
| RXJ1715.3+5726 | 3.8 | 0.3 | [1.8] | 0.7 | [1.4] | 0.2 | [1.0] |
| Z8193 | 8.5 | 2.2 | [1.8] | 1.4 | [1.4] | 1.2 | [0.2] |
| Z8197 | 4.4 | 0.6 | [0.8] | 0.5 | [0.5] | 0.2 | [0.3] |
| RXJ1720.1+2638 | 2.1 | 0.5 | [0.7] | 0.2 | [0.2] | 0.2 | [0.3] |
| Cluster | [OII] | H | [OIII]5007 | [NI] | |||
|---|---|---|---|---|---|---|---|
| A2294 | 0.4 | 0.6 | [0.9] | 0.9 | [1.2] | 0.2 | [0.3] |
| RXJ1733.0+4345 | 0.7 | 0.1 | [0.4] | 0.3 | [0.6] | 0.1 | [0.1] |
| A2292 | 0.1 | 0.4 | [0.6] | 0.1 | [0.2] | 0.1 | — |
| Z8276 | 9.0 | 1.7 | [2.0] | 1.6 | [1.6] | 0.3 | [0.4] |
| RXJ1750.2+3505 | 1.5 | 0.3 | [0.5] | 0.7 | [0.7] | 0.10 | [0.4] |
| RXJ2129.6+0005 | 0.7 | 0.2 | [0.2] | 0.1 | [0.2] | 0.1 | [0.2] |
| A2390 | 4.3 | 0.2 | [1.1] | 0.6 | [1.0] | 0.2 | [0.4] |
| A2495 | 0.7 | 0.3 | [0.2] | 0.2 | [0.1] | 0.1 | — |
| A2634 | 3.2 | 0.6 | [0.9]∗ | 0.9 | [1.9] | 0.5 | — |
| A2665 | 1.4 | 0.2 | [0.5] | 0.2 | [ 0.1] | 0.2 | — |
Notes:
We have tabulated values and upper limits for the blue emission line
fluxes in those clusters only where
H or [OII]3727 are definitely detected.
The values of H, [OIII]5007 and [NI] tabulated in square brackets are
measured in the ‘residual’ spectrum (ie after a scaled template
galaxy has been subtracted). Where there is no value shown for a line flux for the residual
spectrum, the values/limits are not improved from the original fit.
All fluxes are expressed in units of and are total fluxes from the slit.
Values marked by an asterisk are affected by a cosmic ray hit.
3.7 Line intensity ratios
We have calculated line intensity ratios, using the template-subtracted values of H and [OIII] line flux where relevant. The errors on the line ratios are formally propagated through from the errors on the line intensity from the fitting, and do not represent extrema of the division. We do not include the red emission line ratios for RXJ1720.1+2638, as line fluxes of [NII] and H were badly affected by atmospheric absorption, and [SII] by a cosmic ray hit. RXJ1750.2+3505 is also excluded because the H line is affected by a cosmic ray hit.
We plot the ratio of [NII]/H against the luminosity of H in Fig 7, and confirm the trend for the more luminous systems to show a larger ratio of Balmer line emission to forbidden line emission (as in Heckman et al. 1989, A92, C95). We note that the galaxies form a continuous distribution of [NII]/H through four decades in H luminosity, with only a few obvious outliers. Whilst the majority of the clusters selected in an X-ray flux-limited sample will contain cooling flows, the emission-line BCG in this paper may not be a heterogeneous set. Follow-up pointed X-ray data will detail exactly which clusters contain what strength of cooling flow (Allen et al. 1999; Edge et al. 1999d; Crawford et al. 1999), but it is possible to mark out exceptions from the optical emission-line spectrum alone. We broadly split the galaxies within the [NII]/H versus L(H) correlation shown in Fig 7 into high H luminosity systems (L(H )) marked by solid circles (eg A1835, Z3146, Z8193) and those of lower H luminosity (eg A262, A1991, A2199) marked by open circles. Note that whilst this division resembles the classification of cooling flow nebulae into ‘class I’/‘class II’ systems of Heckman et al. (1989), the clusters show a continuous distribution between the two. In particular, this continuous behaviour makes the division between the two types fairly arbitrary, and there is some overlap at L(H ). Here the classification of each individual galaxy was also based on other line ratios (Fig8). The separation of the sample into different symbols in the figures is less an attempt to classify the observed systems, and more to separate out the behaviour of each end of the distribution in the diagrams in this paper. A few emission line systems lie outside the general trend; these are marked either by stars for two systems with higher [NII]/H than expected for their H luminosity (A1068 and A2146) or by open triangles for the two systems with systematically lower [NII]/H at a range of H luminosity (A2294 and RXJ0821.0+0752; note that the position of these last two galaxies in Fig 7 overlap). Although the central galaxies in A2204 and RXJ0439.0+0520 appear to have properties similar to the anomalously high [NII]/H systems (stars) in Fig 7, their behaviour in all other plots fits better with the other high-luminosity systems (Fig 8). The line intensity ratio diagrams of [SII]6717/H and [OIII]5007/H against [NII]6584/H are shown in Fig 8. We choose these diagrams as they are the least subject to internal reddening (see section 3.9). The ionization state of the nebula is also correlated with its size (Fig 9).


3.8 Spatially-extended emission line ratios
The line ratio plots in Figs 7–9 are constructed from the flux-weighted average values, as given in Tables 5 and 6. It is possible, however, for the line ratios to vary within an individual galaxy. Such behaviour has been noted before for the central galaxy in S1101 (Crawford & Fabian 1992), where the relative intensities of [NII]6584 and H swap between the nucleus and an extended filament. Several of our emission-line galaxies are sufficiently extended that we are able to sample the line ratios at several points in the nebula. We find that the line ratios commonly change away from the centre of the galaxy, but not in a heterogeneous manner. For example, the line ratio of [NII]/H can either increase (eg A1835, Fig 10) or decrease (eg A1795, Fig 10) between the galaxy and the extended parts of the nebula. The line ratio of [SII]/H behaves in a similar manner to the [NII]/H. The changes in ionization are not simply accounted for by an increased stellar H absorption in the galaxy continuum decreasing the amount of measured H line emission (and thus increasing the value of [NII]/H derived). Firstly, the change in the [NII]/H line ratio with radius is in some galaxies positive (Figs 10 and 11). Secondly, we have estimated the effect of stellar absorption on the [NII]/H ratio for all these galaxies with spatially extended emission, by subtracting off the non-emitting template galaxy, scaled to match the depth of the (nearby) NaD absorption line. We find that the value of [NII]/H measured for the galaxy centre is decreased by at most 7 per cent (in RXJ0338.7+0958 and A1795), and more commonly by only 1-2 per cent. Thus the change in line ratio appears to be a real change in ionization.


3.9 Intrinsic reddening
For several of the galaxies, the H/H intensity ratio is significantly greater than the expected canonical value of 2.86, suggesting that the observed spectra are reddened along the line of sight. We have already corrected the spectra for the extinction expected from our Galaxy, and so assume any further reddening is intrinsic to the central cluster galaxy. In column 7 of Table 4, we list the E(B-V) derived from the observed H/H intensity ratio in the 10 kpc aperture (and from the total aperture for spectra from A92 and C95). The intensity of H is measured by again constructing a difference spectrum (see Section 3.6; but for the 10kpc apertures now) to approximate H in absorption from the underlying galaxy continuum. We only estimate E(B-V) where H was detected, or should have been significantly detected above the noise if it were 35 per cent of the H intensity. We also omit galaxies with only marginal evidence for internal reddening as deduced from a noisy line ratio (eg A1204, Z3916). The limits shown on E(B-V) are propagated from the errors to the fits of the H and H emission line fluxes, and do not take into account any systematics (for example, the appropriateness of the template subtraction). The spectra of the affected galaxies are then dereddened by the amount shown, assuming R=3.2 and that the dust forms a uniform screen at the redshift of the galaxy. We then measure ‘revised’ values of the BR index and H luminosity, shown in columns 8 and 9 of Table 4 respectively. The errors on the revised values of BR and H luminosity are from the fits, and not due to the range of values given by the errors on E(B-V). The Mg2 index is not affected by reddening, and the D4000 break is less affected than BR.
We have six spectra in common with Allen (1995), and find reduced values of E(B-V) for some of these objects (eg A1664, A1068). Although we use the same spectra, this difference is due to our template subtraction increasing the measured H flux and thus increasing the H/H ratio. Our errors on E(B-V) are also smaller than those of Allen, as we propagate the errors to the intensity from the fits to the emission lines (which we also quote to 1 rather than to 90 per cent) to give errors on the H/H ratio, rather than using the extrema of the fits. There are several galaxies with low-level line emission for which the H/H ratio is significantly less than 2.86 (eg Z2701, RXJ1230.7+1220). This suggests that for these galaxies it is necessary to also take into account H in absorption to give an accurate Balmer decrement. Several galaxies have the lower limit to E(B-V) consistent with no internal reddening (eg A478, A646, A1795, A2052 and A2199).
Placement of the spectrograph slit at the telescope depends on a (live) direct image, and is thus optimized to the strong red continuum of an elliptical galaxy. Thus if a galaxy is not observed at the parallactic angle, we can expect the blue light to be preferentially lost from the slit spectrum. This might affect the observations (in that the H/H intensity ratio is artifically increased due to preferential loss of H from the slit) of A291, RXJ0338.7+0958 and A1795, and does appear from the spectrum (see Fig 2) to be important for the observations of RXJ0352.9+1941 and RXJ0439.0+0520. However, we note that a galaxy marked as an ‘low-luminosity outlier’ in Figs 7–9 (RXJ0821.0+0752; the other A2294 is too noisy to tell) requires a exceptionally high level of internal reddening (E(B-V)) to interpret the lack of a strong H detection. We note though that this galaxy was not observed at the parallactic angle (and so H may have been preferentially been lost from the slit relative to H).
3.10 Relation of the stellar indices to line luminosity
We plot the values of Mg2 and D4000 for the newly-observed galaxies (IDS spectra) in Fig 12, excluding spectra marked as noisy in Table 4. The indices are all measured from a central 10 kpc aperture, and the galaxies are marked by symbols dependent on both the presence and strength of H line emission in the spectrum. The high luminosity systems are marked by solid circles, and the lower-luminosity systems by open circles of the same size. [NII]-only and non-line emitters are also marked by open circles, but of a smaller size as shown in the key to the figure. Observations not taken at the parallactic angle (which may affect the measured value of ) are marked also by a cross. Fig 13 shows the same data, but now including stellar indices measured from the spectra presented in A92 and C95, and again excluding spectra marked as noisy in Table 4. The larger scatter within the plot is mainly due to the variety of projected apertures from which the FOS and WHT spectra are extracted. Nonetheless, the same trend as in Fig 12 is apparent; the stronger line emitters show a significantly bluer spectrum, ie: a lower D4000 for a given Mg2 index. The lower-luminosity line emitters show stellar indices little different from the general population of BCG.

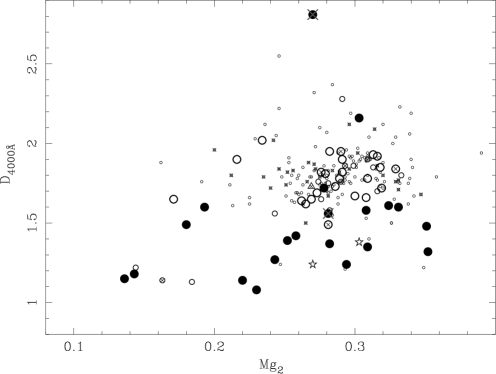


The association of high-luminosity line emitters with the excess blue continuum is also apparent from a plot of H line luminosity against BR for all apertures (Fig 14), whether these quantities are corrected for internal reddening or not. The distribution of BR observed in the non line-emitting BCG in the sample is also plotted by diamond markers at the arbitrary value of L(H)=, using only spectra from the 10 kpc apertures. The size of diamond marker plotted is directly proportional to the number of non-emitting galaxies with that value of BR, where the majority lie in the range BR. Of the three non-emitting systems with BR=0.05, two are not at the parallactic angle. There are a total of six non line-emitters with 0.14BR0.20, and only one above BR of 0.20 (A1366 at BR of 0.23). Similar values are found for the BR values for the data from A92 and C95, although with a larger spread probably due to the less accurate sky-subtraction obtained with the shorter FOS slit. There are also two blue non line-emitters from these data (A1682a, A1902 with BR of 0.19 and 0.23 respectively and discarding A689 as a probable AGN). Fig 15 shows that there is a similar trend of reduced with increasing H luminosity, again with the distribution of D4000 for the 10-kpc aperture non line-emitting galaxies plotted at the arbitrary value of L(H)=. Most of the non line-emitting galaxies have stellar indices of , with only A1366 an exception with a of 1.24. Six further non line-emitting galaxies have values of from the FOS data (A761, Z5604, A1703, A1902, A2426 and A2428), but we note that these data are more suspect to inaccurate sky subtraction due to the short slit, and thus the D4000 is much less certain.

3.11 Stellar populations


The spectra of many of the line-luminous BCG show evidence of a young stellar population; the best (and most extreme) example is the central galaxy in A1835, which shows clear Balmer absorption lines (Fig 16). We construct a co-added spectrum from the two new IDS observations of this galaxy, and note that at the spectral resolution afforded by these data we can independently confirm the appearance of a broad HeII feature (Fig 16; cf. Allen 1995, where he also shows the central galaxy in A1068 to have Wolf-Rayet features). We have searched for such features in other line-emitting galaxies, but the signal-to-noise of most spectra precludes any other definite detection.
Once corrected for intrinsic reddening, many of the line-emitting galaxies show very prominent UV/blue continua with a clear Balmer break at 3646Å, again both indicative of a population of massive stars. Assuming that the excess blue continuum of the central cluster galaxies is due to massive young stars rather than a power-law continuum, we characterize the stellar population by a simple spectral analysis (cf. Crawford & Fabian 1993; Allen 1995). We examine all the BCG spectra (extracted from the central apertures, shown in Tables 4 and 7 and corrected for intrinsic reddening) with H in emission. The galaxy spectra are fit over the rest-frame wavelength range of 3300–5400Å by the spectra of the template elliptical galaxy and model stellar atmospheres (Kurucz 1979). For simplicity we use only templates of O5, B5, A5 and F5 stellar types, and let the normalisation of each and the elliptical galaxy vary as free parameters in the fitting. The emission lines of [OII] and H, [OIII] and [NI] were masked out of the BCG spectrum before fitting, and the data are smoothed by 3 pixels. We do not attempt to fit those galaxies where the spectrum is either too noisy (A478) or shows a marked loss of blue light from the slit (ie A2294, RXJ0338.7+0958 and RXJ0352.9+1941, RXJ0439.0+0520 and Z3916). We include the high-ionization systems (A2146 and A1068) but not the low-ionization system (RXJ0821.0+0752) with the very high value of intrinsic reddening.
The composition of the best-fit stellar models are shown in Table 7, with each component given as a fraction of the total continuum at (rest-frame) 4500Å. The errors on the components are the confidence limits for the components in the model, and do not encompass the range in the estimate of E(B-V) from Table 4. Examples of the best-fit stellar models are shown in Fig 17. The differing results between the three observations of A1835 is most likely due to the long slits sampling a slightly different position of the galaxy each time (the emission-line nebulae and blue light distribution are not necessarily symmetric, eg McNamara & O’Connell 1993). Although a few of the spectra are the same as those modelled in a similar manner by Allen (1995), we find a subtly different balance of massive stars required by the fits, mainly due to both the lesser values of E(B-V) inferred from our Balmer line ratios and the use of a different elliptical galaxy template. The only galaxy for which we could not achieve any satisfactory fit using stellar models was that in Z8193. In all galaxies where the stellar components were fitted to a spectrum extracted from a aperture, the monochromatic rest-wavelength 4500Å luminosity of underlying galaxy component is within the range of the twenty-four non emission-line galaxies used to construct the elliptical template (from the 10 kpc aperture; with an average of ).
Most of the best-fit models to the high H-luminosity systems require a fraction of O5 stars (from Z3146 at 58 per cent to Z7160 at 2 per cent), whereas few of the lower H-luminosity systems require any O5 stars. The fluxes of each stellar component are converted to a number of stars, assuming monochromatic 4500Å luminosities of , , , and for O5, B5, A5 and F5 stellar types respectively. The number of O5 stars inferred from the best fits, as well as the number ratios of the different stellar types are listed for each best-fit model in Table 8. The rate of visible star formation inferred by our model fits is also shown in Table 8. We assume a constant rate of formation, and stellar lifetimes of 3.66, 2.65, 4.78 and 2.11 years for O5, B5, A5 and F5 stars respectively (from Shapiro & Teukolsky 1983). The visible star formation rates are quoted for the total area covered by the slit aperture (given in Table 7) – conversion to a star formation rate per kpc is non-trivial, and depends on the assumed radial profile of the excess blue light. We confirm the finding of Allen (1995) that in all cases, the number of lower-mass stars in relation to the O stars exceeds predictions from either continuous formation (at a constant rate) or a single burst of star formation with a ‘normal’ Scalo IMF. The exceptions to this are the BCG whose spectra only need an O star population in addition to the elliptical galaxy template, which is compatible with a very recent single starburst. Over the wavelength range being modelled, however, the spectrum of O stars are fairly featureless, and the models can be equally well-fit by an elliptical galaxy diluted by a power-law continuum, albeit with a steep spectral slope. Note that the limits on optical polarization observed in the blue light regions of central galaxies in the A1795 and A2597 clusters appears to rule out the possibility of a scattered nucleus as the origin of the blue light (MacNamara 1996a,c, 1998).
As originally mooted by JFN, young O stars will provide a major source of photoionization for the the emission-line nebula (the less massive stars do not contribute significantly to the photoionization). We calculate the H luminosity resulting from photoionization by the O star component required by each best fit stellar model given in Table 7, assuming that each star produces an H luminosity of (following Allen 1995), and that the covering fraction of the stars by the gas is unity. The comparison between the predicted and observed (corrected for intrinsic reddening) H luminosities is shown in Fig 18. Those galaxies where the best-fit stellar population did not require any O stars are plotted at an arbitrary predicted H luminosity of . The errors on the predicted H in this plot are derived only using the errors on the stellar components in the spectral fitting, whereas there are also systematic uncertainties due to the amount of E(B-V) inferred from the Balmer decrement. We repeat the stellar fits for each galaxy, now sampling the full range of E(B-V) given in Table 4 where appropriate, and plot the enlarged errors for the these points by diamonds in Fig 18. (A point with no error diamond around it is one not requiring any dereddening from the Balmer decrement, eg A2204.) Increasing the E(B-V) to the maximum shown in Table 4 did not permit any O stars as part of the stellar composition in the central galaxies which did not require them in the first place. The data are broadly consistent with a large fraction of the observed H luminosity being provided by photoionization from a young stellar population (note that there will be a range of O star sub-types present all contributing to the photoionization). Larger departures from this relationship may reflect the range of covering fractions present in the galaxies. In all this analysis, the distribution of the dust is unknown, and a large uncertainty remains about how well the reddening inferred from the line emission can be applied to the galaxy stellar continuum.
Surprisingly, a few of the lower H-luminosity systems are also close to this relation, although six of them (and two of the high-luminosity objects) do not have any predicted O5 stars to generate the observed line luminosity; this agrees with higher line intensity ratios seen in such systems implying a different ionization source dominates such systems.
We also carry out a simple stellar analysis for the only non H-emitting galaxy out of the new IDS observations to show appreciable evidence for a blue continuum, A1366 (see section 3.5). It requires an excess population of 12 per cent O5 stars and 3 per cent B5 at (rest-frame 4500Å). It is also well-fit by a power-law component with slope of , containing 16 per cent of the flux at rest-frame 4500Å.
| Name | aperture | E(B-V) | % O5 | % B5 | % A5 | % F5 | % Elliptical | L(Elliptical) |
|---|---|---|---|---|---|---|---|---|
| (kpc) | (1040) | |||||||
| A115 | 8.8 | 0.00 | 4 1 | — | 4 1 | — | 92 1 | 0.61 0.01 |
| A291 | 25.1 | 0.00 | 15 1 | — | — | — | 85 1 | 1.46 0.01 |
| RXJ0751.3+5012b | 10.2 | 0.00 | — | 3 2 | — | — | 97 3 | 0.26 0.01 |
| A646 | 10.5 | 0.06 | 8 1 | — | — | 9 3 | 83 3 | 0.48 0.02 |
| RXJ1000.5+4409 | 21.0 | 0.00 | — | — | — | 22 10 | 78 11 | 0.43 0.06 |
| A795 | 8.8 | 0.00 | 5 1 | — | — | — | 95 1 | 0.68 0.01 |
| Z3146 | 32.0 | 0.20 | 58 1 | — | — | — | 42 2 | 2.93 0.12 |
| A1068 | 19.3 | 0.39 | 9 2 | 27 1 | — | 34 1 | 30 3 | 2.61 0.27 |
| A1361 | 16.8 | 0.00 | 5 1 | — | — | — | 95 1 | 0.58 0.01 |
| RXJ1206.5+2810 | 9.9 | 0.00 | — | — | — | 4 1 | 96 1 | 0.35 0.01 |
| RXJ1223.0+1037 | 10.1 | 0.00 | — | — | —- | 2 2 | 98 2 | 0.25 0.01 |
| RXJ1230.7+1220 | 9.9 | 0.00 | 7 1 | — | — | — | 93 1 | 0.08 0.01 |
| A1664 | 18.0 | 0.46 | 46 1 | — | 43 4 | — | 11 3 | 0.73 0.22 |
| A1795 | 10.3 | 0.15 | — | 9 2 | 19 4 | 10 7 | 62 3 | 0.60 0.03 |
| A1835 | 10.4 | 0.40 | 24 3 | 18 6 | 29 4 | 23 5 | 6 2 | 1.02 0.38 |
| 10.4 | 0.55 | 23 4 | 31 8 | 27 6 | 19 2 | — | — | |
| 29.7 | 0.38 | 10 3 | 35 8 | 12 5 | 16 6 | 27 3 | 6.55 0.73 | |
| RXJ1442.2+2218 | 10.1 | 0.00 | 1 1 | — | — | – | 99 2 | 0.44 0.01 |
| A1991 | 9.9 | 0.00 | — | — | — | 4 2 | 96 2 | 0.49 0.01 |
| Z7160 | 30.1 | 0.24 | 2 1 | — | 6 3 | 22 6 | 70 3 | 5.04 0.18 |
| A2052 | 9.4 | 0.22 | — | 3 1 | 8 3 | 17 7 | 72 3 | 0.54 0.02 |
| A2072 | 10.5 | 0.00 | 2 1 | — | — | — | 98 1 | 0.61 0.01 |
| RXJ1532.9+3021 | 8.6 | 0.21 | 25 1 | — | 46 2 | — | 29 1 | 1.34 0.06 |
| A2146 | 28.3 | 0.20 | 10 1 | — | — | 24 6 | 66 5 | 2.66 0.18 |
| A2199 | 10.2 | 0.10 | — | — | — | 11 1 | 89 1 | 0.39 0.01 |
| A2204 | 9.6 | 0.00 | 26 1 | — | — | — | 74 1 | 0.92 0.01 |
| RXJ1715.3+5725 | 9.3 | 0.00 | 5 1 | — | — | — | 95 1 | 0.61 0.01 |
| Z8197 | 9.6 | 0.33 | — | 21 1 | — | 16 4 | 63 2 | 1.70 0.07 |
| Z8276 | 9.4 | 0.24 | 8 1 | — | — | — | 92 1 | 0.82 0.01 |
| A2390 | 9.9 | 0.22 | 15 1 | — | 9 5 | 32 9 | 44 4 | 1.06 0.10 |
| A2495 | 10.1 | 0.00 | 4 1 | — | — | — | 96 1 | 0.41 0.01 |
The central galaxies in Z235, A262, Z808, Z2701, Z3179, A1668,
RXJ1320.1+3308, A1930, RXJ1733.0+4345,
A2626b and A2634 did not require any excess stellar population above that of
the template elliptical. RXJ0107.4+3227 only required an 0.4 per cent
excess of O5 stars at 4500Å.


| Name | No. of O5 stars | B5/O5 | A5/O5 | F5/O5 | Visible SFR |
| () | |||||
| A115 | — | 2257 864 | — | 0.20 | |
| A291 | — | — | — | 0.99 | |
| RXJ0751.3+5012b | — | — | — | — | 0.09 |
| A646 | — | — | 19254 7158 | 0.40 | |
| RXJ1000.5+4409 | — | — | — | — | 0.52 |
| A795 | — | — | — | 0.14 | |
| Z3146 | — | — | — | 16.43 | |
| A1068 | 86 61 | 1744 875 | 29840 10093 | 30.59 | |
| A1361 | — | — | — | 0.12 | |
| RXJ1206.5+2810 | — | — | — | — | 0.06 |
| RXJ1223.0+1037 | — | — | — | — | 0.03 |
| RXJ1230.7+1220 | — | — | — | 0.02 | |
| A1664 | — | 1927 173 | — | 23.06 | |
| A1795 | — | — | — | — | 1.94 |
| A1835 | 86 31 | 2599 505 | 17149 4249 | 76.98 | |
| 144 43 | 2382 636 | 13852 2814 | 124.37 | ||
| 360 145 | 2427 1369 | 25877 13472 | 125.13 | ||
| RXJ1442.2+2218 | — | — | — | 0.02 | |
| A1991 | — | — | — | — | 0.09 |
| Z7160 | — | 7565 4562 | 232815 94533 | 8.55 | |
| A2052 | — | — | — | — | 0.96 |
| A2072 | — | — | — | 0.04 | |
| RXJ1532.9+3021 | — | 3724 154 | — | 12.26 | |
| A2146 | — | — | 41956 11194 | 5.62 | |
| A2199 | — | — | — | — | 0.21 |
| A2204 | — | — | — | 1.29 | |
| RXJ1715.3+5725 | — | — | — | 0.13 | |
| Z8197 | — | — | — | — | 7.86 |
| Z8276 | — | — | — | 0.30 | |
| A2390 | — | 1218 676 | 36993 10350 | 5.40 | |
| A2495 | — | — | — | 0.06 |

4 Discussion
4.1 Do brightest cluster galaxies differ between Abell and non-Abell clusters?
The X-ray flux selection used to compile the BCS has produced a sample of the most luminous clusters within . Although the bulk of the sample is formed from clusters selected through cross-correlation against optical catalogues, the BCS also includes clusters selected from their X-ray properties alone. In fact, one of the key aims of the BCS is to examine the optical differences between clusters of similar X-ray luminosity and redshift. Whilst the determination of a robust galaxy density (ie cluster richness) is beyond the scope of this paper, we can use the brightest cluster galaxy to make a preliminary comparison between optically- and X-ray selected clusters. From Table 1 we can state that 48 of the 51 BCS clusters within a redshift of 0.05 have a BCG that is optically-catalogued (irrespective of its cluster environment) in either the MCG, NGC or IC optical catalogs, and they are all (where indicated) elliptical galaxies. The three exceptions are RXJ0338.7+0958, RXJ0341.3+1524, RXJ1205.1+3920, each of which is centred on a galaxy on the Palomar Sky Survey. The first source is the well-studied poor group 2A 0335+096 (eg Sarazin, Baum & O’Dea 1995), the second is centred on an anonymous Zwicky galaxy (III Zw 054) and the third, while at much higher galactic latitude than the other two sources, is missing from all available optical catalogues. There are a number of optically-catalogued central cluster galaxies beyond 0.05 but the fraction in both Abell and non-Abell clusters drops to essentially zero in these catalogues beyond a redshift of 0.075. These numbers clearly indicate that the brightest member galaxies of X-ray selected clusters are almost always easily identified at , even if the cluster has itself been missed in optical cluster/group searches. This implies that none of the BCS clusters are intrinsically ‘dark’ and the brightest galaxies within them show a limited scatter in optical luminosity.
4.2 Cooling flow nebulae
Around one-third of the BCG in this paper show optical line emission of some degree – from those with low-level [NII]-only emission, to some of the brightest non-AGN line emitters known (Z3146, RXJ1532.9+3021). The H-emitting dominant galaxies show properties very similar to those at the centre of known cooling flow clusters (eg JFN, Heckman et al. 1989). We defer detailed discussion of whether individual clusters contain cooling flows until the X-ray compilation paper (Crawford et al. 1999), but for the moment assume that the majority of these systems are described as cooling flow nebulae (the few exceptions are discussed further in section 4.3).
Central galaxies of cooling flow clusters have long been known to show luminous line emission, spatially extended in filaments spread over the central 5-60 kpc of the cluster core (eg Lynds 1970; Heckman 1981; Hu et al. 1985; JFN; Heckman et al. 1989; A92; C95). Such nebulae are too bright to be simply the recombination phase of the cooling gas in the intracluster medium (JFN); an additional local heat source is required – distributed throughout the optically emitting region of the core – to re-ionize the atoms many times in order to produce the observed luminosity (JFN; Johnstone & Fabian 1988; Heckman et al. 1989; Donahue & Voit 1991; Crawford & Fabian 1992). Despite this, the presence of such line emission is dependent on the cluster properties: large line luminosity extended emission-line regions are found in clusters with high cooling flow rates (JFN; Allen 1998), and so far such systems have not been found around BCG in non-cooling flow clusters. Line emission is not, however, ubiquitous in BCGs contained in strong cooling flows (eg A2029, A2063), and occurs at around 32 per cent throughout our cluster sample which includes non cooling-flow clusters. There is a propensity for the emission-line systems to be associated with those BCG which contain a central radio source (Heckman et al. 1989; C95), though again not exclusively (eg A1060). The probability of the BCG containing a central radio source will, however, be again dependent on the general cluster properties. Further discussion of the relation between the optical properties of the BCG to the X-ray properties of the host cluster and any central radio source are postponed to the next papers in this series where the X-ray data and radio data are presented (Crawford et al. 1999, Edge et al. 1999b).
4.2.1 High H luminosity cooling flow systems
Only the cooling flow nebulae with a high line luminosity (L(H)) are accompanied by an excess ultraviolet/blue continuum (Figs 12 to 15; JFN). Both the line emission and the blue light are extended on scales of 5-60 kpc, and are seen to be spatially coincident from the flattening of the radial gradient of the Mg2 spectral index within the emission-line regions (Cardiel et al. 1998). The morphology of the blue light also seems (in the few cases imaged) spatially related to that of the contained radio source (McNamara & O’Connell 1993; Sarazin et al. 1995b; McNamara 1995; McNamara et al. 1996a; McNamara 1997). The ultraviolet continuum has been successfully ascribed to massive young star formation, from both the spectra (once intrinsic reddening has been corrected; Allen 1995; section 3.11) and from high-resolution images (McNamara et al. 1996a,b; Pinkney et al. 1996). The line ratios observed in these systems have strong Balmer lines relative to forbidden lines such as [OIII], [NII] and [SII] (see Fig 8; mean values around [NII]/H0.8, [SII]H0.4, [OI]/H and [OIII]/H0.6). A good relation is found between the observed H luminosity (again corrected for intrinsic reddening) and that predicted from photoionization by the O stars predicted to be present from the stellar fit to the dereddened continuum (Allen 1995; Fig 18). Detailed modelling of the BCG spectra (Johnstone & Allen 1999) indicates that the ionizing fluxes required to produce the emission-line ratios and luminosities observed in these systems can be fully accounted for by the observed O star populations (assuming very hot stars, with K, and a low mean ionization parameter, ) in a high metallicity environment (about Solar; see also Filippenko & Terlevich 1992; Allen 1995). Together with the spatial correspondence of the blue light and line emission (Cardiel et al. 1998) it seems that the most line-luminous cooling flow nebulae are powered by a population of massive hot stars.
The additional stellar population is too centrally concentrated for the stars to be the immediate depository of gas cooling from the hot intracluster medium, as X-ray profiles of cooling flow clusters show the mass deposition to have a more distributed, flat profile (Fabian 1994 and references therein). Large masses of X-ray absorbing material are detected in the spectra of cooling flow clusters (White et al. 1991; Allen & Fabian 1997), indicating that cold clouds can be an end-product of the cooling process. Such clouds might coagulate and condense to form a central reservoir of cold gas. As suggested by the double-lobed blue light morphology of A1795 and A2597, and as hypothesized by several authors (McNamara & O’Connell 1993; Pinkney et al. 1996; McNamara 1997), the interaction between the outflowing radio plasma and this gas reservoir could induce a massive starburst. The distribution of stellar types inferred is weighted to more lower-mass stars (section 3.11 and Allen 1995), suggesting that such a starburst is triggered at irregular timescales. Those galaxies requiring an excess population of just O stars (eg those in A291, Z3146, Z8276) may only have one very recent such starburst, whilst others may have aged such that few O stars remain. This scenario predicts that the very luminous systems are created by the combination of a central radio source and a surrounding mass of cold clouds accumulated from the cooling flow – both a common consequence of a rich (but non-binary) cluster environment. Thus it is possible a central radio source will not induce star formation and luminous line emission unless the cooling flow has accumulated a reservoir of cold gas. Hence any BCG in a cooling flow cluster that contain a strong radio source yet no optical anomalies should also lack evidence for intrinsic absorption in the cluster X-ray spectrum. A full examination of the correlations between cooling flow properties and both the type of line emission and presence of a central radio source will be addressed in the subsequent papers in this series.
The ionization state of the nebula in high H-luminosity systems are seen to change away from the galaxy, but not in a consistent manner (Fig 10 and 11; see also S1101 in Crawford & Fabian 1992). As shown in section 3.8, the variation is not simply caused by stellar H absorption in the galaxy continuum increasing the central value of [NII]/H derived, as the line ratios both drop and rise off-centre in different galaxies (Fig 11). This change in line ratios is not easily ascribed to a radial metallicity gradient either, as any overabundance of nitrogen and sulphur would likely be concentrated toward the centre of the galaxy, producing a drop in the line ratios at larger radius.
4.2.2 Low luminosity cooling flow systems
The variation in the properties of the cooling flow nebulae form a continuous trend with line luminosity (eg Figs 7, 8), implying a gradual change in the dominance of ionization mechanism, rather than two discrete populations (cf. Heckman et al. 1989). The cooling flow galaxies with a lower luminosity emission-line region have stronger forbidden line emission to Balmer line emission ([NII]/H2.4, [SII]/H1 but [OIII]/H showing a large spread). Such line intensity ratios are traditionally difficult to explain, and require a steeper ionizing spectrum over 13.6-100eV than can be produced by the O stars present in the higher luminosity systems. There is no evidence for an appreciable excess blue continuum in these galaxies (Figs 12 to 15), suggesting that massive stars cannot make such an important contribution to the ionization.
The line ratios suggest the introduction of an additional, harder ionizing source, and the nebulae are also physically smaller than the high luminosity systems, suggesting that the dominant ionization source is not as spatially extended. Several processes have been proposed, such as self-irradiation from X-rays in the cooling flow (Voit & Donahue 1990; Donahue & Voit 1991; which is, however, in contradiction with the observed X-ray flux distribution) to self-absorbed mixing layers tapping both the kinetic and thermal energy of the gas (Crawford & Fabian 1992). Another realistic possibility is that as the amount of visible star formation decreases down the H-luminosity ‘sequence’, the relative importance of any low-level nuclear activity as an ionization source increases (Johnstone & Allen 1999). Determining the source of photo-ionization will require the radial mapping of the ionization parameter across the nebula in such systems.
At the very low-luminosity extreme of the H sequence we find a small fraction of [NII]-only line emitters in our sample, which are most common in the lower X-ray luminosity clusters (; Fig 4). The line emission in these galaxies closely resembles that found in around half of ordinary elliptical galaxies (Phillips et al. 1986) ascribed to low-level LINER activity.
4.3 The non cooling-flow line emitters
We have marked four obvious exceptions from the general behaviour of line-emitters by different symbols in the correlations presented in section 3. Specifically, there are two BCG (in A1068 and A2146) with a combination of line ratios and line luminosity (high [NII]/H and [OIII]/H for their H luminosity) that suggests the dominant form of ionization is due to an AGN (these are marked by open star symbols in Figs 7 to 15; note that the dominant galaxy in A2089 also shows a similar ionization state). A2146 also has prominent HeII4686 line emission (Fig 2; Allen 1995) in agreement with the suggestions of a harder ionizing continuum than is usually seen in cooling flow nebulae. Follow-up X-ray observations confirm the presence of a point-like component of X-ray emission at the BCG in A2146 (at a small fraction of the overall cluster luminosity; Allen 1995). A similar situation may exist for A1068, where the presence of an AGN cannot be ruled out, although the IRAS fluxes and Wolf-Rayet features in this galaxy argue in favour of a massive starburst (Allen 1995). Two other systems (A2204 and RXJ0439.0+0520) also have high [NII]/H for their H luminosity, but line ratios more consistent with the majority trend. Both these clusters contain strong central radio sources (Edge et al. 1999b) which might dilute the cooling flow properties.
Similarly, there are two galaxies offset from the general trend in the opposite direction (A2294, RXJ0821.0+0752). These two galaxies have stronger Balmer lines relative to the forbidden line emission, placing them more into the regime of classical HII regions (these are marked by open triangles in the Figs 7 to 15).
5 Summary and conclusions
We have presented spectral observations of 256 dominant galaxies in 217 clusters, including 87 per cent of the 203 clusters that comprise the BCS. This sample has been supplemented with basic information about the brightest galaxy in a further 21 BCS clusters, as available from the literature. We have listed new redshifts for 18 clusters, mostly systems discovered through X-ray-selection. One such cluster, RXJ1532.9+3021, is at a redshift of =0.36 and is thus the second most distant object in the BCS.
27 per cent of the central dominant galaxies show narrow low-ionization emission lines in their spectra, all but five with line intensity ratios typical of nebulae associated with galaxies at the centres of cooling flow clusters. A further 6 per cent of the clusters have central galaxies showing only [NII] line emission with H in absorption. We find no evidence for an increase in the frequency of line emission with X-ray luminosity, the distribution being consistent with a constant fraction. We also find that at low redshift a purely X-ray-selected cluster has a higher probability of containing an emission-line system around its dominant galaxy than an optically-selected cluster. We find similar numbers of dominant galaxies in both optically-selected and purely X-ray selected clusters at low redshift included in optical catalogues, suggesting that the two techniques select clusters with similar properties. The projected separation between the optical positions of the BCG and the X-ray cluster centroid determined from RASS is smaller for the line-emitting BCG than for those without line emission (at mean values of and kpc respectively). Assuming that the line emission traces a cooling flow system, this is consistent with the idea that there is a smaller offset between the gravitational centre and the central dominant galaxy in cooling flow clusters.
We have measured three stellar indices (, Mg2 and ) from a spectrum extracted from the central 10 kpc of each galaxy in our sample; we have also fitted the emission lines in spectra extracted from both this region and the total span of the emission-line nebula. The total slit H ranges over four decades in luminosity (), and the properties of the emission-line system follow continuous trends of behaviour across this full luminosity range. The more H-luminous systems (L(H)) have the more spatially extended line-emitting regions (diameter kpc), and show a higher ratio of Balmer to forbidden line emission (eg [NII]/H1). Some of the more luminous systems are sufficiently extended that we can plot spatially resolved line ratios, and find that the ratio of forbidden to Balmer lines can either increase or decrease away from the centre of the galaxy. We find that this effect is too large to be simply ascribed to H stellar absorption affecting the line ratios where the emission is coincident with the underlying galaxy continuum, but is rather a real ionization effect. The Balmer decrement measured in the more luminous nebulae often implies the presence of internal dust, with reddening typically of E(B–V) (but with a wide range). These stronger line emitters also show a significantly blue spectrum.
After correction for intrinsic reddening (where appropriate), we have characterized the excess blue light in the high-L(H) galaxies by fitting simple template stellar spectra to their central continuum. Most of the galaxies require an excess population of O stars in sufficient numbers to provide the photoionization that can produce the observed H luminosity. Even though the distribution of stellar types is only crudely determined, the greater number of lower mass stars relative to the O star population does not favour predictions from either continuous star formation or a single starburst. These findings are compatible with models that suggest the massive star formation is triggered from the interaction between outflowing plasma from the central radio source, and cold clouds deposited from, and embedded in a cluster cooling flow.
The lower H luminosity emission-line systems show line ratios (eg [NII]/H) requiring the introduction of a much harder source of ionization, and are much less spatially extended. The galaxy continuum shows no evidence for an appreciable amount of massive stars, with stellar indices little different from those expected from the stellar population of non line-emitting dominant galaxies. Possibilities for the dominant ionization mechanism include turbulent mixing layers or low-level nuclear activity. The small fraction of [NII]-only emitters closely resemble the low-level LINER activity found in many ordinary elliptical galaxies.
There are only five obvious exceptions from the general trends shown by the line-emitting galaxies. At least one (A2146) shows evidence for contaminating photo-ionization by a central active nucleus. Two other galaxies (A2294 and RXJ0821.0+0752) have line intensity ratios suggestive of classical HII regions.
This paper is the first in a series detailing the observed properties of the BCS clusters in the radio, optical and X-ray wavebands. Later papers will investigate the dependence of the optical spectral characteristics of the dominant galaxies presented here with both the global cluster properties and those of any radio source contained in the BCG.
6 Acknowledgements
CSC, ACE and ACF thank the Royal Society for financial support. Thanks are also due to Stefano Ettori for his help in observing during the December 1996 run, and to Roderick Johnstone for anything and everything to do with the computers. The INT is operated on the island of La Palma by the Isaac Newton Group in the Spanish Observatorio del Roque de los Muchachos of the Instituto de Astrofisica de Canarias. This research has made use of the NASA/IPAC Extragalactic Database (NED).
References
- [] Abell G.O., 1958, ApJS, 3, 211
- [] Abell G.O., Corwin H.G., Olowin R.P., 1989, ApJS, 70, 1
- [] Allen S.W., 1995, MNRAS, 276, 947
- [] Allen S.W., 1998, MNRAS, 296, 392
- [] Allen S.W., Fabian A.C., 1997, MNRAS, 286, 583
- [] Allen S.W., Fabian A.C., 1998, MNRAS, 297, 63
- [] Allen S.W. et al. 1999, in preparation
- [] Allen S.W., Edge A.C., Fabian A.C., Böhringer H., Crawford C.S., Ebeling H., Johnstone R.M., Naylor T.N., Schwarz R.A., 1992, MNRAS, 259, 67 (A92)
- [] Baum S.A. et al. 1998, ApJ, 492, 854
- [] Bohlin R.C., Savage B.D., Drake J.F., 1978, ApJ, 224, 132
- [] Böhringer H., Voges W., Fabian A.C., Edge A.C., Neumann D.M., 1993, MNRAS, 264, 25
- [] Bruzual G., 1983, ApJ, 273, 105
- [] Cardelli J.A., Clayton G.C., Mathis J.S., 1989, ApJ, 345, 245
- [] Cardiel N., Gorgas J., Aragon-Salamanca A., 1995, MNRAS, 277, 502
- [] Cardiel N., Gorgas J., Aragon-Salamanca A., 1998, MNRAS, 298,977
- [] Colina L., Perez-Fournon I., 1990, ApJSuppl, 72, 41
- [] Crawford C.S., et al. 1999, in preparation
- [] Crawford C.S., Fabian AC, 1992, MNRAS, 259, 265
- [] Crawford CS, Fabian A.C., 1993, MNRAS, 265, 431
- [] Crawford C.S., Edge A.C., Fabian A.C., Allen S.W., Böhringer H., Ebeling H., McMahon RG., Voges W., 1995, MNRAS, 274, 75 (C95)
- [] Davoust E., Considere S., 1995, A & AS, 110, 19
- [] Donahue M., Stocke J.T., Gioia I.M., 1992, ApJ, 385, 49
- [] Donahue M., Voit G.M., 1991, ApJ, 381, 361
- [] Ebeling H. et al. 1999, in preparation
- [] Ebeling H., Edge A.C., Fabian A.C., Allen S.W., Crawford C.S., Böhringer H., 1997, ApJL, 479, L101 (Paper II)
- [] Ebeling H., Edge A.C., Böhringer H., Allen S.W., Crawford C.S., Fabian A.C., Voges W., Huchra J.P., 1998, MNRAS, 301, 881 (Paper I)
- [] Ebeling H., Voges W., Böhringer H., Edge A.C., Huchra J.P., Briel U.G., 1996, MNRAS, 281, 799
- [] Ebeling H., Henry J.P., Mullis C.R., 1999, in preparation
- [] Ebeling H., Mendes de Oliveira C., White D.A., 1995, MNRAS 277, 1006
- [] Edge A.C. et al. 1999a, in preparation
- [] Edge A.C. et al. 1999b, in preparation
- [] Edge A.C. et al. 1999c, in preparation
- [] Edge A.C. et al. 1999d, in preparation
- [] Edge A.C., Röttgering H., 1995, MNRAS, 277, 1580
- [] Faber S.M., Friel E.D., Burstein D., Gaskel C.M., 1985, ApJS, 57, 711
- [] Fabian A.C., 1994, A&AR, 32, 277
- [] Filippenko A.V., Terlevich R., 1992, ApJ, 397, L79
- [] Gregory S.A., Burns J.O., 1982, ApJ, 255, 373
- [] Heckman T.M., 1981, ApJ, 250, 59
- [] Heckman T.M., Baum S.A., van Breugel W.J.M., McCarthy P., 1989, ApJ, 338, 48
- [] Hu E.M., Cowie L.L., Wang Z., 1985, ApJS, 59, 447
- [] Johnstone R.M., Allen S.W., 1999, in preparation
- [] Johnstone R.M., Fabian A.C., Nulsen P.E.J., 1987, MNRAS, 224, 75 (JFN)
- [] Johnstone R.M., Fabian A.C., 1988, MNRAS, 233, 581
- [] Kurucz R., 1979, ApJSupp, 40, 1
- [] Laurikainen E., Moles M., 1989, ApJ, 345, 176
- [] Le Borgne J.F., Pello R., Sanahuja B., 1992, A&AS, 95, 87
- [] Lynds C.R., 1970, ApJLett, 159, L151
- [] McNamara B.R., 1995, ApJ, 443, 77
- [] McNamara B.R., 1997, in Galactic and Cluster cooling flows, ed. Soker N., ASP, 115, p109
- [] McNamara B.R., Jannuzi B.T., Sarazin C.L., Elston R., Wise M.W., 1996c, ApJ, 469, 66
- [] McNamara B.R., Jannuzi B.T., Sarazin C.L., Elston R, Wise M.W., 1998, ApJ in the press
- [] McNamara B.R., O’Connell R.W., 1989, AJ, 98, 2018
- [] McNamara B.R., O’Connell R.W., 1992, ApJ, 393, 579
- [] McNamara B.R., O’Connell R.W., 1993, AJ, 105, 417
- [] McNamara B.R., O’Connell R.W., Sarazin C.L., 1996b, AJ, 112, 91
- [] McNamara B.R., Wise M., Sarazin C.L., Jannuzi B.T., Elston R., 1996a, ApJ, 466, L9
- [] Maurogordato S., Proust D., Cappi A., Slezak E., Martin J.M., 1997, A&AS, 123, 411
- [] O’Dea C.P., Owen F.N., 1985, AJ, 90, 954
- [] Owen F.N., Ledlow M.J., Keel W.C., 1995, AJ, 109, 14
- [] Owen F.N., White R.A., Thronson H.A., 1988, AJ, 95, 1
- [] Peres C.B., Fabian A.C., Edge A.C., Allen S.W., Johnstone R.M., White D.A., 1998, MNRAS, 298, 416
- [] Pesce J.E., Fabian A.C., Edge A.C., Johnstone R.M., 1990, MNRAS, 244, 58
- [] Peterson B.M., 1978, ApJ, 223, 74
- [] Pinkney J., et al. 1996, ApJ, 468, L13
- [] Phillips M.M., Jenkins C.R., Dopita M.A., Sadler E.M., Binette L., 1986, AJ, 91, 1062
- [] Porter A.C., Schniedel D.P., Hoessel J.G., 1991, AJ 101 1561
- [] Rhee G.F.R.N. & Katgert P., 1988, A&AS, 72, 243
- [] Romanishin W., 1987, ApJLett, 323, L113
- [] Sandage A., 1978, AJ, 83, 904
- [] Sarazin C.L., Baum S.A., O’Dea C.P., 1995a, ApJ, 451, 125
- [] Sarazin C.L., Burns J.O., Roettger K., McNamara B.R., 1995b, ApJ, 447, 559
- [] Shapiro S.L., Teukolsky S.A., 1983, Black Holes, White Dwarfs and Neutron Stars, John Wiley & Sons, New York
- [] Stark A.A., Gammie C.F., Wilson R.W., Bally J., Linke R.A., Heiles C., Hurwitz M., 1992, ApJS, 79, 77
- [] Stocke J.T. et al. 1991, ApJS, 76, 813
- [] Struble M.F., Rood H.J., 1991, ApJS, 77, 363
- [] Tadhunter C.N., Morganti R., di Serego Alighieri S., Fosbury R.A.E., Danziger I.J., 1993, MNRAS, 263, 999
- [] Ulrich M.-H., 1976, ApJ, 206, 364
- [] Voit G.M., Donahue M., 1990, ApJLett, 360, L15
- [] Voges W., 1992, Proceedings of Satellite Symposium 3, ESA ISY-3, p9
- [] Wang Q.D., Ulmer M.P., Lavery R., 1997, MNRAS, 288, 702
- [] White D.A., Fabian A.C., Johnstone R.M., Mushotzky R.F., Arnaud K.A., 1991, MNRAS, 252, 72
- [] White D.A., Fabian A.C., Allen S.W., Edge A.C., Crawford C.S., Johnstone R.M., Stewart G.C., Voges W., 1994, MNRAS, 269, 589
- [] Zwicky F., Herzog E., Wild P., Karpowicz M., Kowal C.T., 1961–1968, Catalogue of galaxies and cluster galaxies, Vols 1–6.