Strong optical line variability in Mkn 110 ††thanks: Visiting Astronomer, German-Spanish Astronomical Centre, Calar Alto, operated by the Max-Planck-Institute for Astronomy, Heidelberg, jointly with the Spanish National Commission for Astronomy.
Abstract
We present results of a long-term variability campaign on the Seyfert 1 galaxy Markarian 110. Mkn 110 is a narrow-line Seyfert 1 object hosted in a morphological peculiar galaxy. We monitored the optical continuum and the line intensities as well as their profiles over a time interval of nearly ten years. The continuum and the Balmer lines varied by a factor of 2 to 5 within two years. The HeII4686 line showed exceptional intensity variations of a factor of eight. We detected an additional independent very broad-line region in high intensity stages of the Balmer and HeII lines. The CCF analysis of the HeII line indicates that this very broad-line region originates at a distance of 9 light days only from the central ionizing source.
Key Words.:
galaxies: individual:Mkn 110 – galaxies: Seyfert – lines: profiles1 Introduction
Markarian 110 is a nearby (z=0.0355) Seyfert 1 galaxy with highly irregular morphology. The apparent magnitude of the total system is mV=15.4 mag (Weedman 1973) corresponding to MV=-20.4 mag (=75 km s-1 Mpc-1). A foreground star is projected on the host galaxy at a distance of 6 arcsec to the nucleus in north-east direction (see Fig. 1). Therefore, it has been supposed in some early papers that Mkn 110 might be a double nucleus galaxy (Petrosian et al. 1978).
On the other hand the peculiar morphology of Mkn 110 is an indication for a recent interaction and/or merging event in this galaxy (Hutchings & Craven 1988).
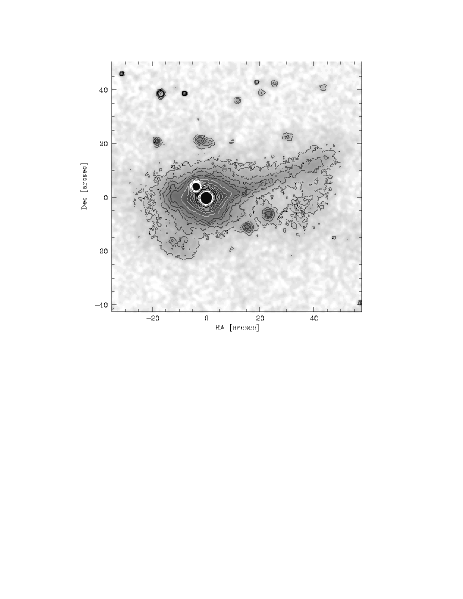
One can clearly recognize a tidal arm to the west with a projected length of 50 arcsec (corresponding to 35 kpc) and further signs of asymmetry in the disturbed host galaxy on the R-band image (Fig. 1).
Ten years ago we started a long-term variability campaign to study the continuum and emission line intensity variations in selected AGNs. Besides our principal interest in the long-term variability behaviour of these galaxies on its own we want to compare the individual variability properties with those of other galaxies from the international AGN watch campaign (Peterson et al. 1991) (e.g. NGC 5548, Kollatschny & Dietrich 1996) and LAG campaign (Robinson 1994) (e.g. NGC 4593, Kollatschny & Dietrich 1997). Further results on continuum and H variations in Mkn 110 have been published in a recent paper on variability of Seyfert 1 galaxies (Peterson et al. 1998a).
2 Observations and data reduction
We took optical spectra of Mkn 110 at 24 epochs from February 1987 until June 1995. The sampling of the observations extends from days to years. In Table 1 we list our observing dates and the corresponding Julian Dates. The spectra were obtained at Calar Alto Observatory in Spain with the 2.2 m and 3.5 m telescopes as well as at McDonald Observatory in Texas with the 2.1 m and 2.7 m telescopes. The individual exposure times range from 10 minutes to 1 hour (see Table 1). We used spectrograph slits with projected widths of 2 to 2.5 arcsec and 2 arcmin length under typical seeing conditions of 1 to 2 arcsec. We extracted spectra of the central 5 arcsec. The slit was oriented in north-south direction in most cases.
To investigate the spatial extension of the narrow line region we took spectra at different position angles: 0∘, 45∘, 90∘, and 135∘. A possible extended [OIII]5007 emission line flux was always less than 3% of the nuclear point-like emission. Mkn 110 has been inspected by Nelson et al. (1996) with the Hubble Space Telescope WFPC-1 in the near infrared spectral range. They detected a dominant unresolved nucleus in this galaxy.
Our optical spectra typically cover a wavelength range from 4000 Å to 7200 Å with a spectral resolution of 3 to 7 Å per pixel. We used different CCD detectors in the course of this monitoring program: until 1989 a RCA-chip (1024x640), in January and July 1992 a GEC-chip (1155x768), and in August 1992 a Tektronix-chip (1024x1024).
The reduction of the spectra (flat fielding, wavelength calibration, night sky subtraction, flux calibration, etc.) was done in a homogeneous way using the ESO MIDAS package.
The absolute calibration of our spectra was achieved by scaling the [OIII]5007 line of all spectra to those obtained under photometric conditions. Our absolute [OIII]5007 flux corresponds within 5% to that obtained by Peterson et al. (1998a). For a better comparison of these two data sets we will use exactly the same [OIII]5007 flux of 2.26 erg s-1 cm-2. Furthermore, we corrected all our data for small spectral shifts and resolution differences with respect to a mean reference spectrum using an automatic scaling program of van Groningen & Wanders (1992).
| Julian Date | UT Date | Telescope | Exp. time |
|---|---|---|---|
| 2 440 000+ | [sec.] | ||
| (1) | (2) | (3) | (4) |
| 6828 | 1987-02-01 | CA 3.5 | 1500 |
| 7229 | 1988-03-08 | CA 3.5 | 4800 |
| 7438 | 1988-10-03 | CA 3.5 | 1200 |
| 7574 | 1989-02-16 | CA 2.2 | 3000 |
| 7663 | 1989-05-16 | CA 3.5 | 1800 |
| 7828 | 1989-10-28 | CA 2.2 | 1200 |
| 8632 | 1992-01-09 | CA 3.5 | 600 |
| 8812 | 1992-07-08 | CA 3.5 | 1800 |
| 8860 | 1992-08-25 | CA 2.2 | 900 |
| 8862 | 1992-08-27 | CA 2.2 | 900 |
| 8864 | 1992-08-25 | CA 2.2 | 900 |
| 9078 | 1993-03-31 | CA 2.2 | 3600 |
| 9080 | 1993-04-02 | CA 2.2 | 3600 |
| 9083 | 1993-04-05 | CA 2.2 | 2400 |
| 9123 | 1993-05-15 | MDO 2.1 | 1800 |
| 9237 | 1993-09-06 | CA 3.5 | 1200 |
| 9419 | 1994-03-07 | MDO 2.1 | 2100 |
| 9595 | 1994-08-30 | CA 2.2 | 1200 |
| 9776 | 1995-02-27 | MDO 2.1 | 1800 |
| 9785 | 1995-03-08 | MDO 2.1 | 1200 |
| 9786 | 1995-03-09 | MDO 2.1 | 1800 |
| 9787 | 1995-03-10 | MDO 2.1 | 1200 |
| 9811 | 1995-04-03 | MDO 2.1 | 1200 |
| 9870 | 1995-06-01 | MDO 2.7 | 900 |
CA = Calar Alto Observatory
MDO = McDonald Observatory
The R-band image of Mkn 110 (Fig. 1) was taken with the 2.2m telescope at Calar Alto observatory on September 20, 1993 with an exposure time of 6 minutes. Again, we reduced this CCD image with the ESO MIDAS package.
In the course of our discussion we additionally will make use of archival IUE spectra of Mkn 110 taken on February 28 and 29, 1988.
3 Results
Some typical spectra are plotted in Fig. 2 showing the range of intensity variations.
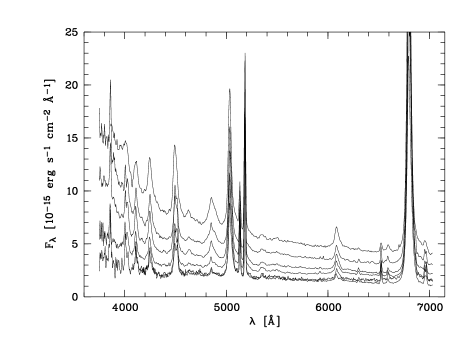
Immediately one can recognize the strong variations in the continuum, in the Balmer lines and especially in the HeII4686 line. The continuum variations are most pronounced in the blue section. The continuum gradient changes as a function of intensity. The emission line profiles of the Balmer lines in Mkn 110 are quite narrow (FWHM(H)=1800 km s-1) similar to those of the so called narrow-line Seyfert 1 galaxies. Week FeII emission is present in the spectra blending the red line wings of [OIII]5007 and H. We measured the integrated intensity of FeII line blends between 5134 Å and 5215 Å. The main FeII components in this region are the 5169 Å and 5198 Å lines belonging to the multiplets 42 and 49. The FeII line flux (2.0 10-14 erg s-1 cm-2 ) remained constant during our variability campaign within the error of 10%.
Difference spectra with respect to our minimum stage in October 1988 are plotted in Fig. 3. All narrow line components cancel out. The FeII lines disappear in the difference spectra as well.
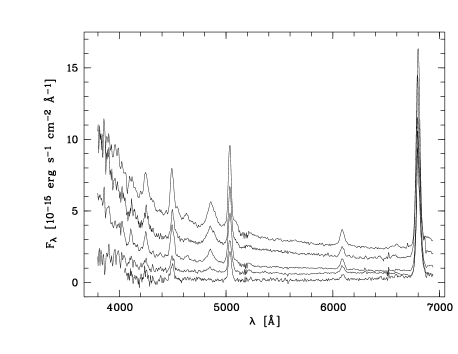
In the Balmer profiles (e.g. H) very broad, slightly redshifted components stand out in the high intensity stages.
3.1 Line and continuum variations
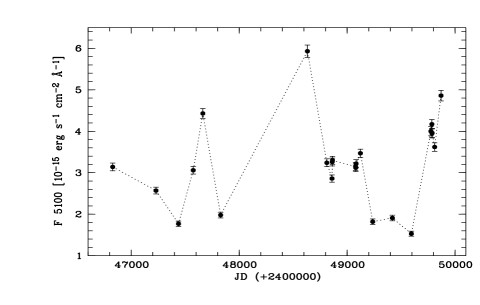
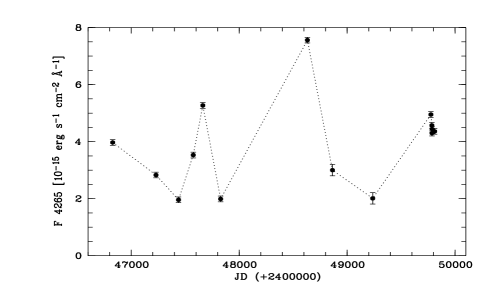
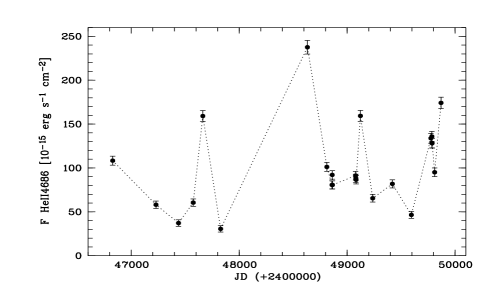
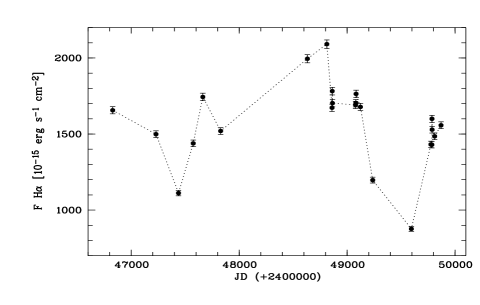
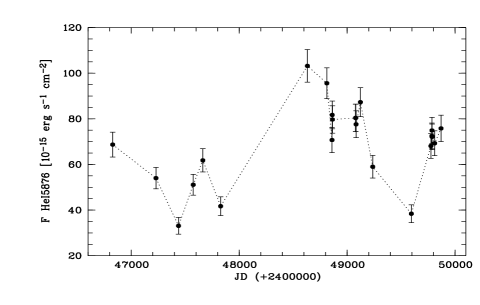
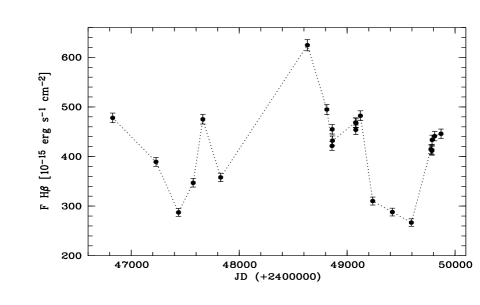
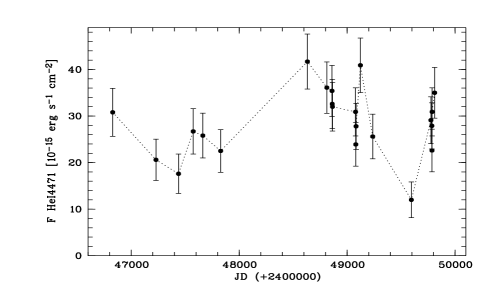
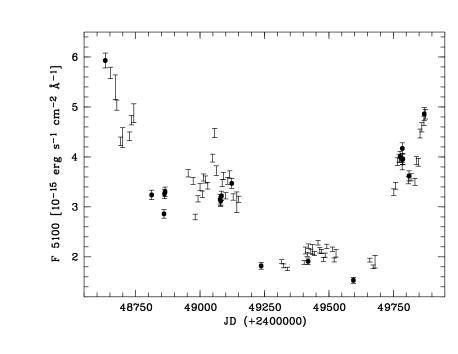
The results of our continuum intensity measurements at 3750 Å, 4265 Å, and 5100 Å as well as the integrated line intensities of H, H, HeII4686, HeI5876, and HeI4471 are given in Table 2. The individual light curves are plotted in Fig. 4.
The continuum intensities are mean values of the wavelength ranges given in Table 3, column (2). Line intensities were integrated in the listed limits after subtraction of a linear pseudo-continuum defined by the boundaries given in column (3). All wavelengths are given in the rest frame.
| Cont./Line | Wavelength range | Pseudo-continuum |
|---|---|---|
| (1) | (2) | (3) |
| Cont. 3750 | 3745 Å – 3755 Å | |
| Cont. 4265 | 4260 Å – 4270 Å | |
| Cont. 5100 | 5095 Å – 5105 Å | |
| HeII | 4600 Å – 4790 Å | 4600 Å – 4790 Å |
| HeI | 4430 Å – 4530 Å | 4265 Å – 4600 Å |
| HeI | 5800 Å – 5960 Å | 4600 Å – 5100 Å |
| H | 4790 Å – 4935 Å | 4600 Å – 5100 Å |
| H | 6420 Å – 6770 Å | 6420 Å – 6770 Å |
We started our monitoring program in 1987. Therefore, our 5100 Å continuum light curve covers up a larger time interval than the light curve of Peterson et al. (1998a) beginning in 1992. The observing epochs are partly complementary in the common monitoring interval. But, spectra taken nearly simultaneously from both groups (within one week) correspond with each other to better than 5% in the continuum fluxes. In Fig. 5 we compare our continuum light curve with that of Peterson et al. (1988a) in the common interval of observations. Both light curves are in very good accordance regarding to the intensity variations. Fig. 5 shows that the data sets are not significantly undersampled.
However, our H intensities are systematically higher than those of Peterson et al. (1998a) as we integrated over a larger wavelength range and we carried out a slightly different continuum subtraction. This method led to a lower pseudo-continuum flux at 4790 Å. The H fluxes are in perfect agreement if we multiply the values given by Peterson et al. (1998a) by a factor of 1.15.
The pattern of the continuum light curves at 5100 Å and 4265 Å (Fig. 4) is identical apart from their different amplitudes. The HeII4686 light curve follows closely these continuum light curves. The light curves of the Balmer lines H and H are similar among themselves and the light curves of both HeI lines as well.
| Cont./Line | Fmin | Fmax | Rmax | F | Fvar | |
|---|---|---|---|---|---|---|
| (1) | (2) | (3) | (4) | (5) | (6) | (7) |
| Cont. 3750 | 2.94 | 15.10 | 5.14 | 7.51 | 4.322 | 0.573 |
| Cont. 4265 | 1.96 | 7.56 | 3.86 | 3.91 | 1.533 | 0.391 |
| Cont. 5100 | 1.53 | 5.93 | 3.88 | 3.26 | 1.044 | 0.318 |
| HeII | 30.6 | 237.6 | 7.76 | 102.6 | 48.95 | 0.466 |
| HeI | 12.0 | 41.7 | 3.47 | 28.56 | 7.19 | 0.180 |
| HeI | 33.1 | 103.2 | 3.12 | 69.44 | 17.31 | 0.236 |
| H | 266 | 624.5 | 2.34 | 419.2 | 79.94 | 0.189 |
| H | 876 | 2091 | 2.39 | 1572 | 265.3 | 0.168 |
Continuum flux in units of
10-15 erg sec-1 cm-2 Å-1.
Line flux in units of 10-15 erg sec-1 cm
Statistics of our measured continuum and emission line variations are presented in Table 4. We list minimum and maximum fluxes Fmin and Fmax, peak-to-peak amplitudes Rmax = Fmax/Fmin, the mean flux over the entire period of observations F, the standard deviation , and the fractional variation
as defined by Rodríguez-Pascual et al. (1997). The extreme variability amplitudes of Mkn 110 attract attention compared to other galaxies, e.g. NGC 4593 (Dietrich, Kollatschny et al. 1994) and the Seyfert 1 galaxies from the sample of Peterson et al. (1998a).
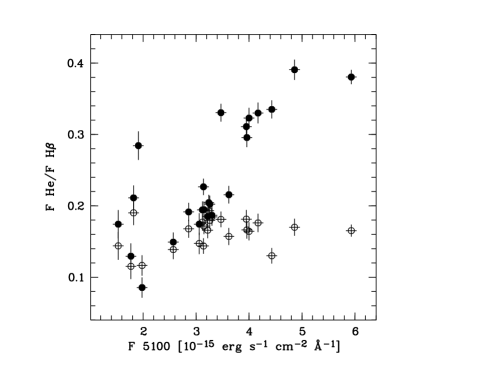
The variability amplitudes of the continuum increase towards the short wavelength region. These amplitudes as well as those of the emission line intensities are exceptionally high. The variability amplitude of the HeII4686 line is unique compared to the other emission lines in Mkn 110 and compared to optical lines in other Seyfert galaxies. In Fig. 6 we plot the line intensity ratios HeII4686/H and HeI5876/H as a function of continuum intensity at 5100 Å. These line intensity ratios increase slightly for the HeI line but strongly for the highly ionized HeII line.
3.2 Balmer decrement
We calculated Balmer decrement H/H values in the range from 3.2 to 4.3. Simple photoionization calculations (Case B) result in a value of 2.8 for this line ratio (Osterbrock 1989). Deviations of the observed Balmer decrement from the theoretical value are often explained by wavelength dependent dust absorption and/or by collisional excitation effects. We will show later on that the observed difference can not be explained by dust absorption alone in the broad-line region clouds of Mkn 110. There is a clear anti-correlation of the Balmer decrement with the continuum flux (Fig. 7).
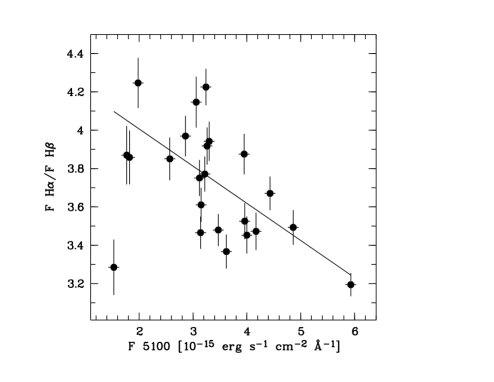
One has to keep in mind that the individual Balmer lines and the continuum of each spectrum originate in distinct regions of the BLR at different times. This will be confirmed by the cross-correlation analysis later on. A very tight correlation can not be expected because of the short-term variations in this galaxy. The solid line in Fig. 7 is a linear fit to all our data points except for the lowest continuum intensity point. At this epoch (JD +5959) the H intensity was extreme low (Fig. 4) in contrast to H and the continuum. An anti-correlation of the Balmer decrement with the continuum flux has been first noted in NGC 4151 by Antonucci & Cohen (1983).
3.3 UV spectra
Two UV spectra haven been taken with the IUE satellite with a time interval of one day only. These spectra have been taken nearly simultaneously (within 8 days) to our optical observations in March 1988. Therefore, these two spectra are suitable for a determination of optical/UV line intensity ratios. Fig. 8 shows an overplot of both short wavelength UV spectra taken with an time interval of 1 day.
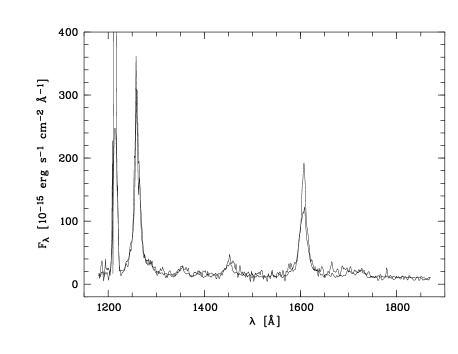
The spectra are identical in the continuum and in the emission lines within the error limits. The different flux values in the center of the CIV1550 line are due to saturation effects in one of the spectra.
We determined an integrated Ly flux of erg s-1 cm-2. Comparison with the optical spectra results in a Ly/H ratio of 11.0 at the observing epoch March, 1988.
The HeII1640 flux amounts to erg s-1 cm-2. The HeII1640/HeII4686 ratio of 2.45 is about a factor of two lower than that of typical photoionization models but consistent with other AGN observations (Seaton 1978, Dumount et al. 1998).
3.4 CCF analysis
An estimate of size and structure of the broad-line region can be obtained
from the cross-correlation function (CCF) of a continuum light curve with
emission line light curves.
We cross-correlated the 5100 Å continuum light curve with all our emission
line light curves (Fig. 4) using an interpolation cross-correlation function
method (ICCF) described by Gaskell & Peterson (1987).
In Fig. 9 we plot the cross-correlation functions
of the individual emission line light curves of HeII4686, HeI5876, H and H with the continuum light curve.
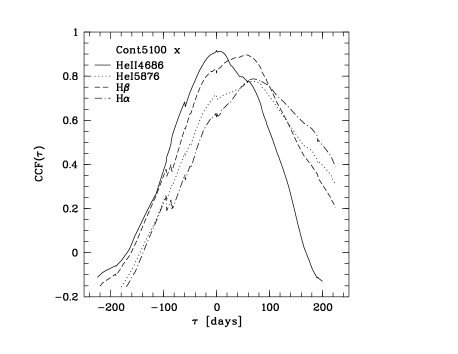
The cross-correlation functions of HeI4471 and HeI5876 are identical within the errors; therefore, only one curve is shown in the plot.
First of all we determined an error of the centroids of the ICCFs by averaging the centroids that were calculated for fractions of the peak ranging from 35% to 90% of the maximum value of the cross-correlation functions. Then we estimated the influence of two principal sources of cross-correlation uncertainties namely flux uncertainties in individual measurements and uncertainties connected to the sampling of the light curves. We used a method similar to that described by Peterson et al. (1998b). We added random noise to our measured flux values and calculated the cross-correlation lags a large number of times. Due to the large variability amplitudes of Mkn 110 these uncertainties were of lower weight compared to those introduced by the sampling of the light curves. The sampling uncertainties were estimated by considering different subsets of our light curves and repeating the cross-correlation calculations. Typically we excluded 37% of our spectra from the data set (cf. Peterson et al. 1998b). In Table 5 we list our final cross-correlation results together with the total error.
| Line | |
|---|---|
| [days] | |
| (1) | (2) |
| HeII | |
| H | |
| HeI | |
| HeI | |
| H |
Considering the entire observing period we got a lag of the H light curve of days. Peterson et al. (1998a) obtained for a similar extended observing campaign a lag of days. However, they claim that their best lag estimate derived from an observing period of 123 days yielding the smallest error is about days.
3.5 Line profiles and their variations
Normalized mean and rms profiles of HeII4686, HeI5876, H and H lines are shown in Figs. 10 and 11.
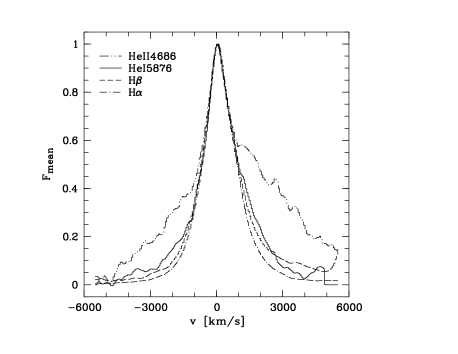
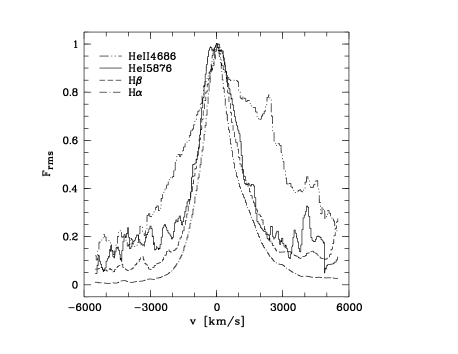
The rms profile is a measure of the variable part in the line profile. There is a very broad line component in the mean and rms profiles especially to be seen in the HeII line. Even apart from this very broad component the mean and rms profiles of the individual lines are different with respect to their shape and full width at half maximum (FWHM). In Table 6 we list the widths of the mean and rms profiles. The mean and rms H profiles are more similar to the HeI4471 profiles than to H. The rms profile of H e.g. is significantly narrower than the profile of H. The profiles of the HeI4471 line are more noisy than the other ones. They are identical to those of the HeI5876 line within the errors.
| Line | FWHM(mean) | FWHM(rms) |
|---|---|---|
| [km s-1] | [km s-1] | |
| (1) | (2) | (3) |
| HeII | 2720 100 | 4930 200 |
| H | 1670 50 | 2010 100 |
| HeI | 1640 50 | 2200 100 |
| H | 1580 50 | 1540 100 |
All mean and rms profiles show a red asymmetry. The asymmetry is mainly caused by a second line component at v=1200 km s-1. This second component does not vary with the same amplitude as the main component. Furthermore, this second component was stronger during the first half of our campaign from 1987 until January 1992 than during the second half of the campaign. The H spectra taken at the intensity minima of February 1989 and August 1994 are plotted in Fig. 12. The additional component centered at v=1200 km s-1 is clearly to be seen.
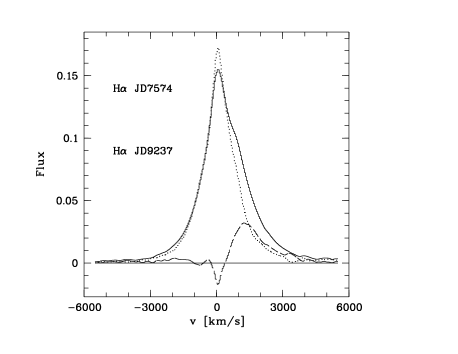
The mean spectra of the first half of our campaign are broader by 400 - 500 km s-1 (FWHM) than those of the second half because of this component.
There is an independent very broad component present in the mean and rms HeII profiles (Figs. 10 and 11). This very broad component exists in addition to the broad component. There is no transition component visible in the profile. The peak of this very broad profile component is redshifted by 400100 km s-1 with respect to the narrow lines. This shift was measured in the difference spectra (cf. Fig. 13). This very broad component is the strongest contributor to the HeII variability as can be seen from the rms profile. The very broad component is visible in the Balmer line profiles also, especially at high continuum stages (see Fig. 3). The HeII and H profiles taken in January 1992 are shown in more detail in Fig. 13. We subtracted the minimum profile taken in October 1988 to remove the narrow line component.
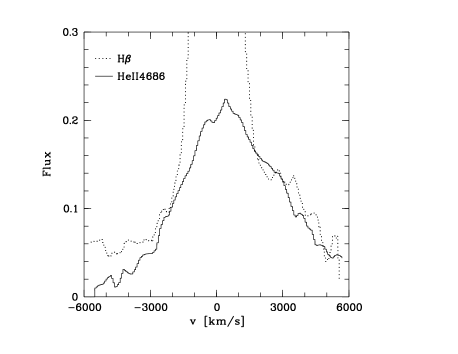
The HeII line intensity has been divided by a factor of 1.3 for direct comparison with the very broad H profile. Immediately one can see the striking similarity. The blue wing of the H profile is stronger than that of the HeII profile because of the blending with the red wing of the HeII line. The very broad line component has a full width at zero intensity (FWZI) of 12 000 km s-1.
4 Discussion
Mkn 110 is one of the very few Seyfert galaxies with spectral variability coverage over a time interval of ten years. Different continuum ranges show different variability amplitudes; this holds for different optical emission lines, too. But the mean fluxes of the continuum and of all emission lines remain nearly constant integrated over time scales of a few years (see Fig. 4). There are considerable variations over time scales of days to years. The strongest variability amplitudes in the continuum shows the blue spectral range (see Figs. 2 to 4). There are intensity variations of a factor of . The strongest amplitudes in the blue spectral range might be explained by a greater share of the non-thermal continuum with respect to the underlying galaxy continuum.
The optical line variations of H are very strong in comparison to other Seyfert galaxies (e.g. Peterson et al. 1998a). The HeII4686 line shows the strongest variations of nearly a factor of 8 within two years. On the other hand the H and the continuum(5100) vary only by a factor of 1.7 and 3.0 respectively within the same time interval. Apart from the variation of the HeII4686 line in NGC 5548 in 1984 (Peterson & Ferland 1986) these are the strongest optical line variations within such a time interval. In the case of Mkn 110 we can show that the appearance of the very broad HeII4686 and H component (see Figs. 3 and 13) is not a unique event in the accretion rate. It is connected to a very strong ionizing continuum flux as can be seen from the light curves. The intensity ratio HeII4686/H comes to a value of 1.3 (see Fig.13) in the very broad line region. Such a line ratio is still in correspondence with photoionization of broad emission-line clouds in quasars (Korista et al. 1997).
The very broad line region (VBLR) originates close to the central ionizing source at a distance of about 9 light days. It is not connected to the “normal” BLR. As can be seen from the line profiles there exists no continuous transition region between these BLRs. The center of the VBLR line profiles is shifted by 400100 km s-1 with respect to the “normal” BLR profiles (Figs. 10, 11, 13).
Apart from this VBLR component we could show that the line profiles of the Balmer and HeI lines are similar but not identical. The H line profile is narrower than the H profile. Besides the cross-correlation results this is an independent indication that these two lines do not originate in exactly the same region.
The observed Ly/H ratio comes to a value of 11.0 in Mkn 110. This is about a factor of two higher than the mean observed Ly/H ratio in Seyfert galaxies (Wu et al. 1983). Photoionization models of Kwan & Krolik (1981) result in Ly/H without the presence of dust. Therefore, dust may not play an important role in the BLR of Mkn 110. The Balmer decrement in Mkn 110 varies as a function of the ionizing continuum flux. This might be explained by radiative transfer effects rather than by variation of dust extinction.
The profiles of the broad emission lines in Mkn 110 are neither symmetric nor smooth (Figs. 10, 11). This is a further indication that the broad-line regions in AGN are structured as e.g. in NGC 4593 (Kollatschny & Dietrich 1997). In Fig. 12 it is shown that during the first half of our campaign a red line component was present in the H spectra. This component was not visible during the second half of the campaign.
The size of the H line emitting region (r = 40 ld corresponding to 1.0 1017 cm) and the optical continuum luminosity is compared to those of other Seyfert galaxies. The continuum luminosity amounts to erg s-1 Å-1. In this case we used km s-1 Mpc-1 in order to compare directly the radius and luminosity of Mkn 110 with those of other Seyfert galaxies compiled by Carone et al. (1996). The values of Mkn 110 fit nicely into the general radius-luminosity relationship for the broad-line regions in Seyfert galaxies. The Balmer line emitting region as well as the luminosity of Mkn 110 are arranged in the upper region of the radius-luminosity plane close to the galaxies Mkn 590 and Mkn 335.
There is a trend that the broader emission lines originate closer to the center (see Table 7). A similar trend was found for NGC 5548, too (Kollatschny & Dietrich 1996).
The central mass in Mkn 110 can be estimated from the width of the broad emission line profiles (FWHM) under the assumption that the gas dynamics are dominated by the central massive object. Furthermore, one needs the distance of the dominant emission line clouds to the ionizing central source (e.g. Koratkar & Gaskell 1991, Kollatschny & Dietrich 1997). We presume that the characteristic velocity of the emission line region is given by the FWHM of the rms profile and the characteristic distance R is given by the centroid of the corresponding cross-correlation function:
In Table 7 we list our virial mass estimations of the central massive object in Mkn 110.
| Line | FWHM(rms) | R | M |
|---|---|---|---|
| [km s-1] | [ld] | [] | |
| (1) | (2) | (3) | (4) |
| HeII | 4930 200 | ||
| HeI | 2200 100 | ||
| H | 2010 100 | ||
| H | 1540 100 |
Altogether we determine a central mass of:
We can independently estimate an upper limit of the central mass if we interpret the observed redshift of the very broad HeII component () as gravitational redshift (e.g. Zheng & Sulentic 1990):
Again we presume that this line component originates at a distance of 9 ld from the central ionizing source. We derive an upper limit of the central mass of
This second independent method confirms the former mass estimation.
5 Summary
Mkn 110 shows strong variations in the continuum and in the line intensities on time scales of days to years. The continuum - especially the blue range - varies by a factor of 3 to 5 on time scales of years. The Balmer line intensities vary by a factor of 2.5 while the HeII4686 line shows exceptionally strong variations by a factor of 8.
We cross-correlated the light curves of the emission lines with those of the continuum. The emission lines originate at distances of 9 to 80 light days from the central source as a function of ionization degree.
Not only the line intensities but also the line profiles varied. We detected a very broad line region VBLR component in the high intensity stages of the Balmer and HeII lines. This region exists separated from the “normal” broad-line region at a distance of only 9 light days from the central ionizing source.
We derived the central mass in Mkn 110 using two independent methods.
Mkn 110 is a prime target for further detailed variability studies with respect to the line and continuum variability amplitudes as well as with respect to the short-term variations.
Acknowledgements.
We thank M. Dietrich, D. Grupe, and U. Thiele for taking spectra for us. We are grateful to M. Dietrich, E. van Groningen, and I. Wanders who made available some software to us. This work has been supported by DARA grant 50 OR94089 and DFG grant Ko 857/13.References
- (1) Antonucci R.R.J., Cohen R.D., 1983, ApJ 271, 564
- (2) Carone T.E., Peterson B.M., Bechtold J., et al., 1996, ApJ 471, 737
- (3) Dietrich M., Kollatschny W., Alloin D., et al., 1994, A&A 284, 33
- (4) Dumount A-M., Collin-Souffrin S., Nazarova L., 1998, A&A 331, 11
- (5) Gaskell C.M., Peterson B.M., 1987, ApJS 65, 1
- (6) Hutchings J.B., Craven S.E., 1988, AJ 95, 677
- (7) Kollatschny W., Dietrich M., 1996, A&A 314, 43
- (8) Kollatschny W., Dietrich M., 1997, A&A 323, 5
- (9) Koratkar A., Gaskell M., 1991, ApJ 370, L61
- (10) Korista K., Baldwin J., Ferland G., Verner D., 1997, ApJS 108, 401
- (11) Kwan J., Krolik J.H., 1981, ApJ 250,478
- (12) Nelson C.H., MacKenty J.W., Simkin S.M., Griffith R.E., 1996, ApJ 466, 713
- (13) Osterbrock D.E., 1989, Astrophysics of Gaseous Nebulae and Active Galactic Nuclei, University Science Books, Mill Valley
- (14) Peterson B.M., Ferland G.J., 1986, Nature 324, 345
- (15) Peterson B.M., Balonek T.J., Barker E.S., et al., 1991, ApJ 368, 119
- (16) Peterson B.M., Wanders I., Bertram R., et al., 1998a, ApJ 501, 82
- (17) Peterson B.M., Wanders I., Horne K., et al., 1998b, PASP 110, 660
- (18) Petrosian A.R., Saakian K.A., Kachikian E.E., 1978, Astrofizika 14, 69
- (19) Robinson A., 1994, The LAG Spectroscopic Monitoring Campaign: An Overview. In: Gondhalekar P.M., Horne K., Peterson B.M. (eds.) Reverberation Mapping of the Broad-Line Region in Active Galactic Nuclei, ASP Conf. Ser. 69, San Francisco, p. 147
- (20) Rodríguez-Pascual P.M., et al., 1997, ApJS 110, 9
- (21) van Groningen E., Wanders I., 1992, PASP 104, 700
- (22) Weedman D.W., 1973, ApJ 183, 29
- (23) Wu C.-C., Boggess A., Gull T.R., 1983, ApJ 266, 28
- (24) Zheng W., Perez E., Grandi S.A., Penston M.V., 1995, AJ 109, 2355
| Julian Date | 5100 Å | 4265 Å | 3750 Å | H | H | HeII | HeI | HeI | |
|---|---|---|---|---|---|---|---|---|---|
| 2 440 000+ | |||||||||
| (1) | (2) | (3) | (4) | (5) | (6) | (7) | (8) | (9) | |
| 6828 | 3.14 0.09 | 3.97 0.1 | 9.0 0.2 | 1656 24 | 477.9 9.8 | 108.3 5.2 | 30.8 5.2 | 68.7 5.4 | |
| 7229 | 2.57 0.08 | 2.83 0.1 | 5.2 0.2 | 1499 22 | 389.3 8.9 | 58.1 4.2 | 20.6 4.4 | 54.0 4.7 | |
| 7438 | 1.77 0.07 | 1.96 0.1 | 2.9 0.4 | 1112 18 | 287.3 7.9 | 37.2 3.7 | 17.6 4.2 | 33.1 3.7 | |
| 7574 | 3.06 0.09 | 3.53 0.1 | 6.6 0.4 | 1439 21 | 347.0 8.5 | 60.5 4.2 | 26.7 4.9 | 51.1 4.6 | |
| 7663 | 4.43 0.12 | 5.27 0.1 | 12.5 0.4 | 1744 24 | 475.1 9.8 | 159.2 6.2 | 25.8 4.8 | 61.8 5.1 | |
| 7828 | 1.98 0.07 | 1.99 0.1 | 1520 22 | 357.9 8.6 | 30.6 3.6 | 22.5 4.6 | 41.7 4.1 | ||
| 8632 | 5.93 0.15 | 7.56 0.1 | 15.1 0.4 | 1995 27 | 624.5 11.2 | 237.6 7.8 | 41.7 5.9 | 103. 7.2 | |
| 8812 | 3.24 0.09 | 2091 28 | 494.9 9.9 | 101.2 5.0 | 36.1 5.5 | 95.6 6.8 | |||
| 8860 | 2.86 0.09 | 1673 24 | 421.4 9.2 | 80.7 4.6 | 35.4 5.5 | 70.7 5.5 | |||
| 8862 | 3.26 0.10 | 1782 25 | 454.9 9.5 | 92.1 4.8 | 32.6 5.3 | 81.7 6.1 | |||
| 8864 | 3.30 0.10 | 3.00 0.2 | 4.8 0.2 | 1703 24 | 432.1 9.3 | 80.7 4.6 | 32.0 5.2 | 79.7 6.0 | |
| 9078 | 3.15 0.09 | 1692 24 | 468.5 9.7 | 91.2 4.8 | 30.9 5.2 | 80.4 6.0 | |||
| 9080 | 3.12 0.09 | 1702 24 | 453.9 9.5 | 88.2 4.8 | 23.9 4.7 | 80.4 6.0 | |||
| 9083 | 3.22 0.09 | 1764 25 | 467.7 9.7 | 86.6 4.7 | 27.8 4.9 | 77.6 5.9 | |||
| 9123 | 3.47 0.10 | 1678 24 | 482.3 9.8 | 159.4 6.2 | 40.9 5.9 | 87.3 6.4 | |||
| 9237 | 1.82 0.07 | 2.01 0.2 | 4.1 0.4 | 1197 19 | 310.2 8.1 | 65.5 4.3 | 25.6 4.8 | 59.0 4.9 | |
| 9419 | 1.91 0.07 | 288.0 7.9 | 81.9 4.6 | ||||||
| 9595 | 1.53 0.06 | 876 16 | 266.8 7.7 | 46.5 3.9 | 12.0 3.8 | 38.4 3.9 | |||
| 9776 | 4.00 0.11 | 4.95 0.1 | 1432 21 | 414.6 9.1 | 133.9 5.7 | 29.1 5.0 | 68.1 5.4 | ||
| 9785 | 4.17 0.11 | 4.57 0.1 | 1430 21 | 411.8 9.1 | 135.9 5.7 | 27.9 5.0 | 72.5 5.6 | ||
| 9786 | 3.95 0.11 | 4.30 0.1 | 1600 23 | 412.9 9.1 | 128.4 5.6 | 22.6 4.6 | 74.9 5.7 | ||
| 9787 | 3.96 0.11 | 4.44 0.1 | 1529 22 | 433.6 9.3 | 128.2 5.6 | 30.9 5.2 | 72.1 5.6 | ||
| 9811 | 3.62 0.10 | 4.36 0.1 | 1485 22 | 441.1 9.4 | 95.1 4.9 | 35.0 5.4 | 69.3 5.5 | ||
| 9870 | 4.86 0.13 | 1558 23 | 445.9 9.5 | 174.2 6.5 | 75.8 5.8 |
Continuum fluxes (2) - (4) in 10-15 erg sec-1 cm-2 Å-1.
Line fluxes (5) - (9) in 10-15 erg sec-1 cm-2.