To appear in The Universe As Seen By ISO,
ed. P. Cox and M. F. Kessler
HEATING THE GAS IN PHOTODISSOCIATION FRONTS
Abstract
ISO has provided us with a new perspective on gas temperatures
in photodissociation regions through measurements of line
emission from rotationally-excited levels of H2.
The H2 rotational level populations provide a thermal
probe, showing that gas temperatures
prevail in a portion of the PDR where significant H2
is present.
Such high gas temperatures were unexpected.
Theoretical models for the S140 PDR are presented.
Possible mechanisms for heating the gas to such high temperatures
are discussed.
Key words: ISO; infrared astronomy; molecular hydrogen.
1. INTRODUCTION
Photodissociation fronts play an important part in the global energetics of star-forming galaxies, as an appreciable fraction of the energy radiated by newly-formed stars is reprocessed in photodissociation fronts, resulting in and fine structure line emission. If we want to understand the emission spectra of star-forming galaxies, good theoretical models of photodissociation fronts are required.
ISO observations of line emission from rotationally-excited levels of have provided unequivocal evidence for gas temperatures in the range in a portion of the photodissociation region (PDR) where the fraction is appreciable. These temperatures were higher than expected from current models of the heating and cooling processes in PDRs, and therefore require reconsideration of the physics of the gas and dust in PDRs.
In §2. we review the basic structure of photodissociation fronts, and in §3. we discuss how can be used as a thermometer to indicate the gas temperatures in PDRs. In §4. we use the S140 PDR as an example. Theoretical models for the heating and cooling in PDRs are discussed in §5., and in §6. we stress some of the uncertainties in the modelling of PDRs. We summarize in §7.
2. WHAT IS A PHOTODISSOCIATION FRONT?
The term “photodissociation front” refers to the interface separating a region which is predominantly molecular, and a region where the ultraviolet energy density is sufficiently high so that the molecular fraction is . Young O and B stars located near their natal (only partially-disrupted) molecular clouds produce conspicuous (i.e., high surface brightness) photodissociation fronts. A number of reviews of PDRs have appeared recently (??, ??, ??), including a comprehensive article by ??.
A photodissociation front is not a mathematical surface, but rather an extended “photodissociation region” (PDR). Figure 1 is a cartoon illustrating the different zones within the PDR.
The structure of the PDR is determined primarily by the attenuation of the far-ultraviolet (6 - 13.6 eV) radiation field, as one moves from the ionization front into the PDR. The abundance results from a balance between formation of on dust grains and photodissociation of by photons. The photodissociation rate is determined by both self-shielding (??) as well as attenuation by dust. Because of this self-shielding, the H/ transition occurs closer to the ionization front than the C+/C/CO or O/O2 transitions. Atoms with ionization potentials lower than H (e.g., C) are photoionized in the PDR, whereas species with ionization potentials greater than H (e.g. O) are neutral in the PDR.
Ionization fronts and dissociation fronts are, in general, time-dependent structures (??). Under many circumstances, however, the structure can be approximated as being stationary in a frame moving with the dissociation front. Furthermore, if the dissociation front is advancing into the molecular gas with a propagation speed (??), advection terms can be neglected in the equations governing the thermal and chemical conditions: the temperature is effectively determined by a local balance between heating and cooling, and abundances by a local balance between formation and destruction. For most PDRs this inequality is expected to be satisfied (??, ??), although time dependence may be important for some planetary nebulae (??).

3. H2 AS A THERMAL PROBE
The rovibrational excited states of are populated by inelastic collisions
by UV pumping:
and by formation on grains:
At the densities of bright PDRs, collisions maintain the (=0, ) levels of in approximate thermal equilibrium for . Therefore measurements with ISO of the quadrupole emission line intensities from levels provide a good indicator of the gas temperature, while the emission from the higher levels is sensitive to both the gas temperature and density. We do not expect the level populations to be characterized by a single “excitation temperature”, but the “best-fit” excitation temperature characterizing a range of values (e.g., =3–5) should indicate the approximate gas temperature in the part of the PDR where these levels are predominantly excited.
The populations of very high levels (e.g., ) are potentially affected by UV pumping (the quadrupole decay cascade following a UV pump injects a small amount of into high states) and formation on dust grains (some fraction of the newly-formed may be in high states). Therefore excitation temperatures characterizing may not reflect gas temperatures.
4. THE S140 PDR
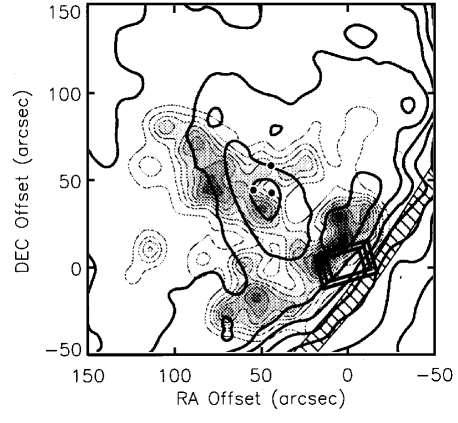
ISO obtained spectra of the photodissociation region where the S140 HII region abuts the L1202/L1204 molecular cloud (??); see Figure 2.
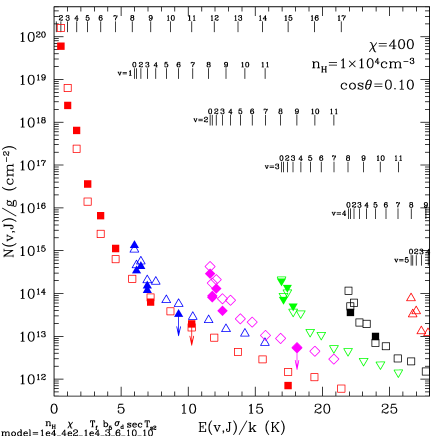
?? reported measurements of line emission out of (0,) levels with as large as 9 (see Figure 3). The inferred column densities for are characterized by an excitation temperature ; the emission from and 9 suggest a higher temperature. How much of the PDR is characterized by such high temperatures? To address this question, ?? considered an ad-hoc temperature profile, shown in Figure 4.

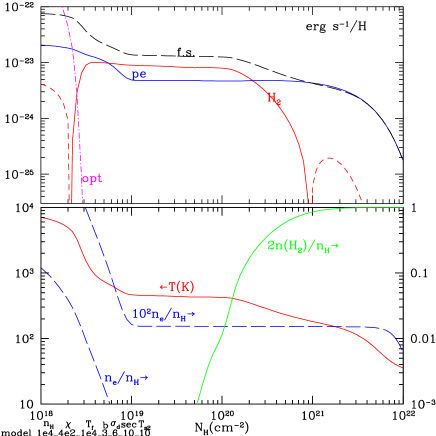
With this ad-hoc temperature profile, the chemical abundances are computed by requiring steady-state balance between formation and destruction, using standard assumptions for the formation rate of on grains, and a detailed treatment of self-shielding. level populations were computed for a plane-parallel PDR, including both UV pumping and collisional excitation and deexcitation (??). The H nucleon density was assumed to be (as expected for pressure balance with the HII region), and the radiation field at was assumed to be times stronger than the ?? value (as expected for the distance from the exciting B0.5V star).
The resulting model is shown in Figure 3, where it is assumed that , where is the angle between the line-of-sight and the normal to the model PDR. It is seen that the level populations are in fairly good agreement with observations, although the model overestimates the and level populations, while underestimating the levels. For this model, at the point where , and where .
?? also compared predicted and observed fine structure line intensities with those predicted by the model. Agreement is generally good, allowing for uncertainties in abundances of Si and Fe: [CI]609 is close to the observed value, while [SiII]35 and [FeII]26 agree with observations if Si/H= and Fe/H=. The principal discrepancy is [OI]63, which the model predicts to be times stronger than observed.

5. THERMAL BALANCE IN PDRS
The obvious question now is: what temperatures do we expect the gas to have in PDRs, if we assume that the gas temperature is determined by a balance between heating and cooling? The principal heating processes in PDRs are:
-
Photoelectrons emitted from dust grains;
-
UV pumping, followed by collisional deexcitation of rovibrationally excited ;
-
Photodissociation (kinetic energy of H+H);
-
formation (kinetic energy, collisional deexcitation);
-
Photoionization of H, C, etc.
while the dominant cooling processes are:
-
fine-structure line emission from ,
, , ,…; -
quadrupole emission;
-
CO rotational emission.
The grain photoelectric heating rate is quite uncertain. Here we show results assuming the photoelectric heating rate of ??.
The cross sections for collisional excitation and deexcitation of are also uncertain; for we use the H- inelastic rates of ?? and ??, while for we extrapolate the Mandy & Martin rates using eq. (16) of ??, but using rather than as the transition temperature, as discussed by ??.
The fine-structure line emission is computed using standard collision rates, abundances characteristic of the gas toward Oph (e.g., Si and Fe depleted by factors of 40 and 250, respectively). Some of the lines – in particular, [OI] – can become optically thick. An “escape probability” approximation was used to estimate local cooling rates (??).
Figure 5 shows the calculated thermochemical profile, as well as showing the contributions of different processes to heating and cooling. Close to the ionization front the fractional ionization is a few percent, and ; in this region, optical line emission (e.g., [SII]6716,6739) dominates the cooling, but is unimportant when . Emission from excited fine-structure levels dominates the cooling for .
contributes net heating throughout much of the PDR. This heating arises mainly from collisional deexcitation of rovibrationally excited following UV-pumping or formation on grains, with a secondary contribution from the kinetic energy of newly-formed and H+H following photodissociation. The other major heating process is photoelectric emission from dust grains. Both heating and photoelectric heating are important for ; beyond this point self-shielding has reduced the photodissociation rate (and therefore the formation rate as well) to very low levels, and photoelectric heating dominates.
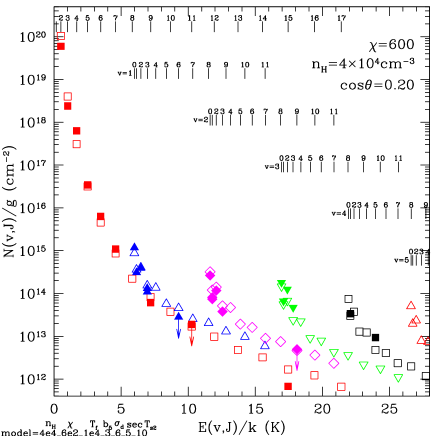
Figure 6 shows the observed column densities of excited states of along the line of sight toward the S140 PDR, corrected for an assumed extinction mag. A number of line detections and upper limits were obtained subsequent to preparation of the ?? paper on the S140 PDR; Figure 6 shows column densities obtained from the most recent data reduction (??). Also shown are the column densities predicted by our model, which assumes an inclination of the PDR with – a factor of 10 “limb-brightening”.
There are significant differences between the model level populations and those observed toward S140. The assumed factor of 10 limb-brightening leads to a good match for the vibrationally excited levels. However, the column densities predicted by the model fall off too steeply – while the column densities in the model exceed the observed values by a factor , the column densities are too low by factors . This presumably indicates that either the inelastic cross sections or the thermal profile are incorrect. Note, however, that the model appears to be able to reproduce the observed population of in , and thereby a high excitation temperature for the high levels.
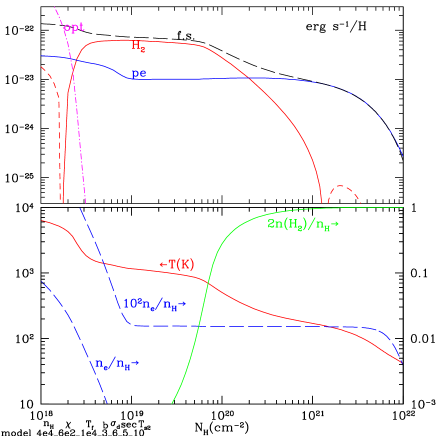
Somewhat better agreement can be obtained if the gas density and illuminating radiation field are both increased; in Figures 7 and 8 we show the result of increasing the illuminating radiation field to , and raising the gas density to . With the increased and , a good fit to the observed line intensities is obtained for a limb-brightening factor . However, the assumed value of is somewhat larger than expected from our knowledge of the exciting star, and is larger than expected given our estimates of the pressure in the ionization front (??). It should also be noted that even with these values of and , there are still noticeable discrepancies between model and observation. It is difficult to match the low observed line ratio between 0-0S(1) and 0-0S(2). Both lines are in the same size ISO aperture, so beam dilution differences could not be the cause of the mismatch. The model also overproduces , although this line was observed after ISO’s helium boiloff, which made its flux calibration more difficult. Most other levels’ column densities are well reproduced.
The high gas temperatures found in S140 are not unique. Early evidence for high gas temperatures in PDRs was obtained from –1 and 4–2 line observations by ??, who inferred at a position .0244 pc from the ionization front in the Orion Bar, and another .0044 pc farther away from the ionization front.
High gas temperatures near the H/ transition were inferred, based on ground-based spectra, for the reflection nebula NGC 2023 (??). ISO spectra of the reflection nebula NGC 7023 (??) and the Orion Bar (??), also show that some of the must be in a region of gas temperatures .
6. WHAT NEEDS TO BE CHANGED IN THE MODELS?
Where do we stand on modeling the emission from PDRs? Considering that the emission arises from a region with a range of densities, one might take the point of view that we are doing pretty well – our constant density planar PDR models can approximately reproduce the observed level populations using ultraviolet pumping of plus collisional excitation/deexcitation, with gas temperatures obtained from a balance of heating and cooling. Nevertheless, it seems to us that the discrepancies between our best models and the observations are unacceptably large. The discrepancies may be due in part to our underlying assumptions of planar geometry and uniform density, but may also be due to poor approximations in our description of the local microphysics of heating, cooling, chemistry, and level excitation. Below we indicate some of the areas where existing models may require modification.
6.1. inelastic collision cross sections
The H– collisional excitation/deexcitation rates used here for are those of ?? and ??, which were obtained from quasi-classical trajectory calculations. These rates are thought to be accurate for , but are likely to be increasingly inaccurate at low temperatures, where quantum calculations are required (??, ??). ?? have recently reported accurate rates for transitions among the , levels, for ; our extrapolation from the ?? results was adjusted to give good agreement with these newer rates.
While H- inelastic rates are generally larger than for - collisions, the latter are important when the H fraction becomes small. Quantum calculations have recently been reported by ??.
6.2. Grain Photoelectric Heating Rate
The thermal models reported here employ a photoelectric heating rate recommended by ?? for heating by 6-13.6 eV photons:
Bakes & Tielens assumed a “MRN” power-law size distribution down to ultrasmall grains containing only carbon atoms (i.e., PAH molecules). Since we have only an imprecise understanding of the composition and size distribution of the grains, this heating rate is necessarily uncertain. Under the conditions of interest (e.g., the point where in Figure 5), we have , , and , so that , and the heating efficiency , which increases further into the cloud to . Since photoelectric emission from grains is a dominant heating process in PDRs, its further study would be of value.
6.3. Dust-to-Gas Ratio
The dust grains play a crucial role in photodissociation regions. In particular, they determine the rate for formation of from H, and, as seen above, photoelectric emission from dust is a major heat source. Common practice is to adopt a “standard” dust-to-gas ratio and wavelength-dependent dust opacity in the PDR. However, ?? have pointed out that the anisotropic radiation in a PDR can drive the grains through the gas at drift velocities which may be comparable to the flow velocity of the gas relative to the dissociation front, thereby leading to an increase in the dust-to-gas ratio in the PDR, at least for those grain compositions and sizes for which the grain-gas drift velocities are large. Increased dust concentrations in part of the PDR could alter the thermochemical properties of the PDR by increasing the formation rate (and therefore the local rate of UV pumping and photodissociation of ) and by increasing the grain photoelectric heating rate. As a result, we can expect that the gas temperature will be increased near the photodissociation front.
The anisotropic radiation incident on a dust grain results in a force which consists of the “ordinary” radiation pressure force due to absorption and scattering, plus additional forces due to anisotropic photoelectron emission (the “illuminated” side of the grain will emit more photoelectrons per second than the “dark” side) and anisotropic photodesorption (adsorbed H or can be photodesorbed, with a larger rate on the “illuminated” side of the grain). The recoil force from photoelectric emission and photodesorption can be several times larger than the “ordinary” radiation pressure (??).
Because the grains are charged, drift across the magnetic field lines will be inhibited. It will be of great interest to see the extent to which these effects will change the dust-to-gas ratio, and the grain size distribution, in the PDR, and how this affects the thermochemical profile of the PDR.
7. SUMMARY
ISO has opened a new window on photodissociation fronts, by allowing us to measure the populations of the rotationally-excited levels of the state of , thereby placing strong constraints on the gas temperature. The S140 PDR provides an excellent illustration of this capability.
The observed line emission from rotationally-excited levels of indicates that gas temperatures prevail in part of the PDR where appreciable is present. Attempts to construct theoretical models of the PDR tend to fall short in terms of the populations of levels ,
We discuss the uncertainties in the dominant heating and cooling mechanisms; the inelastic collision rates still have significant uncertainties, and the grain photoelectric heating rate is yet not well-established. In addition, it appears possible that the dust-to-gas ratio in PDRs such as S140 may deviate from the “standard” value since the anisotropic radiation field can drive the grains through the gas with significant drift speeds.
ACKNOWLEDGEMENTS
For their contribution to the recent S140 data analysis we are grateful to the MPE SWS group, and especially to H. Feuchtgruber and E. Wieprecht. This research was supported in part by NSF grant AST 96-19429 (BTD) and by the Deutsche Forschungsgemeinschaft (FB). B.T.D. wishes to thank Osservatorio Arcetri for its gracious hospitality during the completion of part of this work.
References
- Bakes & Tielens 1994 Bakes, E.L.O., Tielens, A.G.G.M. 1994, ApJ, 427, 822
- Bertoldi et al. 1998 Bertoldi, F., et al. 1998, private communication
- Bertoldi & Draine 1996 Bertoldi, F., Draine, B.T. 1996, ApJ, 458, 222
- Bertoldi et al. 1999 Bertoldi, F., Feuchtgruber, H., et al. 1999, in preparation
- Draine & Bertoldi 1996 Draine, B.T., Bertoldi, F. 1996, ApJ, 468, 269
- Draine & Bertoldi 1999 Draine, B.T., Bertoldi, F. 1999, in preparation
- Flower 1997 Flower, D.R. 1997, MNRAS, 288, 627
- Forrey et al. 1997 Forrey, R.C., Balakrishnan, N., Dalgarno, A., & Lepp, S. 1997, ApJ, 489, 1000
- Habing 1968 Habing, H.J. 1968, Bull. Astron. Inst. Netherlands, 19, 421
- Hayashi, Hasegawa, et al. 1987 Hayashi, M., Hasegawa, D., Omodaka, D., et al. 1987, ApJ, 312, 327
- Hollenbach & Natta 1995 Hollenbach, D.J., Natta, A. 1995, ApJ, 455, 133
- Hollenbach & Tielens 1997 Hollenbach, D.J., Tielens, A.G.G.M. 1997, ARA&A, 35, 179
- Hollenbach & Tielens 1998 Hollenbach, D.J., Tielens, A.G.G.M. 1998, Rev. Mod. Phys., in press
- Mandy & Martin 1995 Mandy, M.E., Martin, P.G. 1995, ApJS, 86, 199
- Martin & Mandy 1995 Martin, P.G., Mandy, M. 1995, ApJ, 455, L89
- Parmar et al. 1991 Parmar, P.S., Lacy, J.H., Achtermann, J.M. 1991, ApJ, 372, L25
- Rosenthal et al. 1999 Rosenthal, D., et al. 1999, private communication
- Sternberg et al. 1998 Sternberg, A., Yan, M., Dalgarno, A. 1998, in Molecules in Astrophysics: Probes and Processes, ed. E. van Dishoeck, p. 141
- Störzer & Hollenbach 1998 Störzer, H., Hollenbach, D.J. 1998, ApJ, 495, 853
- Timmermann et al. 1996 Timmermann, R., Bertoldi, F., Wright, C.M., et al. 1996, A&A, 315, L281
- Walmsley 1998 Walmsley, C.M. 1998, Astr. Lett. & Comm., 37, 1
- White & Padman 1991 White, G.J., Padman, R. 1991, Nature, 354, 511
- Weingartner & Draine 1999 Weingartner, J.C., Draine, B.T. 1999, this volume