PKS2250-41 and the rôle of jet-cloud interactions in powerful radio galaxies.
Abstract
We present high resolution, long-slit spectra of the jet-cloud interaction in the powerful southern radio galaxy PKS2250-41. We have resolved the emission lines into two main kinematic components: a broad component (FWHM900 km s-1) and a narrow component (FWHM150 km s-1). While the broad component is characterized by a low ionization level (with particularly weak HeII4686 emission) and is spatially associated with the radio lobe, the narrow component is characterized by a higher ionization level and extends well beyond the radio lobe. Crucially, we measure a higher electron temperature for the broad component (30,000 K) than for the narrow component (15,000 K). The general line ratios and physical conditions of the two components are consistent with a model in which the broad component represents gas cooling behind the shock front driven by the radio jets, while the narrow component represents the AGN- or shock-photoionized precursor gas. However, uncertainties remain about the gas acceleration mechanism behind the shock front: unless the radio components are expanding unusually fast in this source, it is likely that entrainment of the warm clouds in the hot post-shock wind or radio plasma is required in addition to the initial acceleration across the shock front, in order to explain the large line widths of the broad component.
The similarities between the kinematic properties of PKS2250-41 and some high redshift radio galaxies suggest that the ambient and the shocked gas have also been resolved in the more distant objects. Given the evidence that the emission line processes are affected by the interactions between the radio and the optical structures, care must be taken when interpreting the UV spectra of high redshift radio galaxies.
keywords:
galaxies: active - galaxies: jets - galaxies: individual (PKS2250-41)1 Introduction
The study of Seyfert galaxies and low redshift radio galaxies has revealed extended emission line properties which are well explained in terms of an illumination model (e.g. Fosbury 1989) in which the ambient gas is illuminated and photoionized by active galactic nuclei (AGN) in the cores of the galaxies. This scenario has the advantage of being in agreement with the unification models (e.g. Barthel 1989) in which it is proposed that many active galaxies are intrinsically identical but appear different due to orientation effects.
However, AGN illumination is not the whole story. HST images of Seyfert galaxies (Capetti et al. 1996) have shown a close association between the narrow-line region emission line structures and the radio structures. The emission line profiles also reveal disturbed kinematics and high velocity motions (e.g. Axon et al. 1998). These properties show that strong interactions are taking place between the radio-emitting plasma and the emission-line gas.
Some nearby radio galaxies and the majority of high redshift radio galaxies (HzRG) (0.7) present clear evidence for similar interactions. Many HzRG show highly collimated UV continuum and emission line structures which are closely aligned with the radio axis (Chambers et al. 1987; McCarthy et al. 1987; Best, Longair & Rottgering 1996). The emission line spectra show a highly disturbed kinematics which cannot be explained in terms of purely gravitational motions (e.g. Mc.Carthy et al. 1996, Röttgering et al. 1997) but suggest that the gas is interacting with the radio-emitting components. Recently, work by the Stromlo group has provided a theoretical framework for understanding the emission line spectra produced by warm emission line clouds involved in jet-cloud interactions111Throught this paper we use “jet-cloud interaction” as a generic term to denote interactions between the radio-emitting components — including the radio jets, hotspots and lobes — and the warm emission line clouds. (e.g. Sutherland, Bicknell & Dopita 1993; Dopita & Sutherland 1996).
Jet-cloud interactions are therefore a common phenomenon in active galaxies and can have a strong influence on the properties we observe. The way the interactions take place is, however, poorly understood and many questions remain open. In particular, the gas acceleration mechanism in jet-cloud interactions remains uncertain, and the extent to which the jet-induced shocks ionize the emission line clouds is not yet clear.
We are carrying out a project whose main goal is the study of the interaction between the radio and optical structures in radio galaxies. The very large distances of HzRG make this study difficult due to the small angular sizes, the faintness of the objects, and the fact that optical observations sample the UV rest frame, where the emission line physics are highly uncertain. Therefore we are concentrating on radio galaxies at intermediate redshifts which are much easier to study.
PKS2250-41 (=0.308) is one of the few relatively nearby radio galaxies with clear evidence for jet-cloud interactions. Due to its proximity and the strength of its interaction, PKS2250-41 is an excellent target to study the physics of this phenomenon in powerful radio galaxies. What we learn from PKS2250-41 will provide important clues about what is happening in more distant radio galaxies. The results will be useful to understand the rôle played by interactions between the radio- and optical-emitting structures in active galaxies in general.
1.1 The jet-cloud interaction in PKS2250-41. Summary of previous results.
Clark et al. (1997) and Tadhunter et al. (1994) showed that the interaction between the radio jet and the emission line gas in PKS2250-41 has the following consequences:
-
•
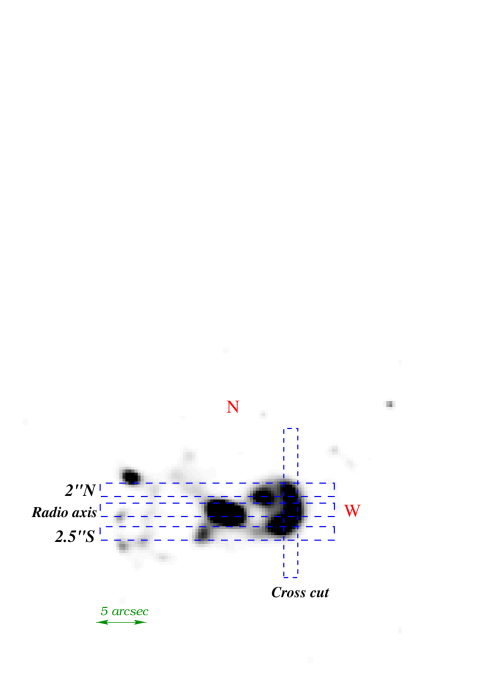
Morphological associations between the radio and optical structures: The dominant feature of the emission line images ([OIII]5007) is an arc-shape structure located at 5.5 arcsec (33 kpc)222 km s-1 Mpc-1, assumed throughout, giving an angular scale of 6.0 kpc arcsec-1 west of the nuclear continuum centroid. This arc circumscribes the Western radio lobe.
-
•
Complex kinematics with relatively broad low ionization lines. An anticorrelation is observed between line width and the ionization state in the Western arc. This effect may be explained, as in SN remnants (Greidanus & Strom 1992), as due to the fact that low ionization emission lines are produced mainly in the shocked, compressed and accelerated gas, while the high emission lines are mainly emitted by the precursor gas.
-
•
High pressures measured in the western radio lobe, were the interaction is strongest. This suggests that the radio plasma and the line emitting gas are in approximate pressure equilibrium.
The authors propose a scenario in which a direct collision between the radio jet and a companion galaxy in the surrounding group is taking place.
In this paper we present new long-slit spectra for PKS2250-41, which cover a larger spatial region than studied in the previous work, and contain information not only for the regions along the radio axis, but also perpendicular to it. The high spectral resolution of these data has allowed us to study in detail the properties and origin(s) of the different kinematic components revealed in the strong emission lines.
2 Observations
| Central | Grating | Resol.(Å) | Seeing(”) | Slit(”) | ||
|---|---|---|---|---|---|---|
| Radio axis (PA270) | ||||||
| 4883 | 1200V | 3600 | 4485-5300 | 1.70.1 | 0.6 | 1.5 |
| 6250 | 600R | 5400 | 5415-7040 | 3.00.3 | 1.0 | 1.5 |
| 6560 | 1200V | 5400 | 6165-6980 | 1.40.1 | 0.6 | 1.5 |
| 8300 | 600R | 6000 | 7520-9130 | 3.30.3 | 1.0 | 1.5 |
| 2.5 arc sec S | ||||||
| 6560 | 1200V | 5400 | 6165-6980 | 1.40.1 | 0.6 | 1.5 |
| 2 arc sec N | ||||||
| 6560 | 1200V | 5400 | 6165-6980 | 1.40.1 | 0.6 | 1.5 |
| Cross cut (PA0) | ||||||
| 6560 | 1200V | 5400 | 6165-6980 | 1.40.1 | 0.6 | 1.5 |
The spectroscopic observations were carried out on the nights 1994 September 27/28 using the Royal Greenwich Observatory (RGO) spectrograph on the Anglo Australian Telescope. The detector was a Tek CCD with 2261024 pixels of 27 m2, resulting in a spatial scale of 0.81 arcseconds per pixel.
The data were taken with the slit approximately parallel (PA270) and perpendicular (PA0) to the radio axis using both intermediate (3.0 – 3.3Å FWHM) and high (1.4 – 1.7Å FWHM) spectral resolutions. We covered most of the projected area of the Western arc by obtaining spectra along three slit positions at PA270: along the radio axis, 2.5 arc sec South (2.5”S slit hereafter) and 2 arc sec North (2”N slit hereafter). The slit positions are presented in Fig. 1. A log of the spectroscopic observations is shown in Table 1.
We did the same with the overlaps between the cross cut and the 2.5”S and 2”N slits. We detect (as expected) three kinematic components (two narrow+one broad) at the radio axis position. We have isolated the redder narrow component and plotted its properties in Fig. 5 (solid triangles). The good agreement with the cross cut values for the narrow component confirms that the blue component is not detected N and S of the radio axis along PA0.
The data reduction was carried out using standard methods provided in IRAF (a detailed description can be found in Villar-Martín et al. 1998).
3 Analysis and results
3.1 The fitting procedure
Both IRAF and STARLINK (DIPSO) routines were used to measure the emission line fluxes, line widths and line centers. For the blends, decomposition procedures were used in STARLINK (DIPSO), fitting several Gaussians at the expected positions of the components. As the number of possible mathematical solutions is large, we applied theoretical constrains when necessary (like fixed ratios between line fluxes or separation in wavelength). In some cases, the information obtained from the strong [OIII]5007,4959 lines was used to constrain the input parameters for the fits to other lines. We assumed, for instance, that all lines have the same number of kinematic components as those discovered in the [OIII] lines. Sometimes we also constrained the kinematic components to have the same velocity width (taking into account instrumental broadening and wavelength dependence of velocity) as the [OIII] components.

The [OIII]5007,4959 and H lines were used to study the spatial variation of the properties of the different kinematic components revealed by the fitting procedures. In order to do this, we extracted a 1-D spectrum for each spatial pixel across the Western arc the region of greatest interest to us, which shows the clearest signs of jet-cloud interactions. Those pixels for which there was a risk of contamination by the emission from the near-nuclear regions of the host galaxy were excluded. As an example of the fitting procedure, we present in Fig. 2 the results of the fits to the [OIII] lines for spatial pixels across the Western arc (slit aligned along PA270).
Apart from the [OIII]5007,4959 and H lines, most of the lines are faint, and the spatial information is difficult to obtain on a pixel-by-pixel basis for the individual components. In order to increase the signal to noise ratio and to obtain information on the individual kinematic components, we spatially integrated the emission from the brightest pixels across the Western arc (using 1.53.2 arcsecond aperture, centered 5.6 arcseconds to the west of the nucleus along PA270) and fitted the fainter lines in the integrated spectrum. The strongest lines in each spectrum were used to constrain the input parameters for the fits to the fainter lines in the same spectrum.
The result of this procedure is the isolation of the different kinematic components in each line, characterized by flux, line width and central wavelength. It is, therefore, possible to study the kinematics and line ratios of each kinematic component separately.
3.2 Results from the PA270 slits
In this section we analyse the information provided by the [OIII]5007,4959 and H lines in the high resolution spectra obtained along PA270 (approximately parallel to the radio axis). Our goal is to isolate the different gaseous components contributing to the line emission and study the spatial variation of the kinematic and ionization properties. The results for the perpendicular slit position (PA0) are presented separately in section §3.3.
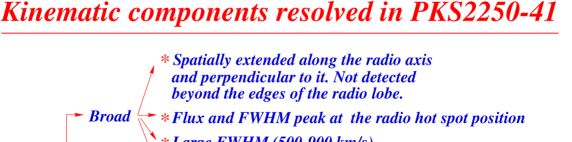
The fits to the lines reveal complex kinematics with the presence of at least three spatially extended components: two narrow components (FWHM60-200 km s-1) separated by 140 km s-1 and a broad component (500-900 km s-1). We will distinguish the two narrow components by labeling them as the blue narrow component (component at shorter wavelength) and the red narrow component (component at longer wavelengths).
We plot the spatial variation of the kinematic, flux and ionization properties of the narrow components in Fig. 3. The properties of the broad components are presented in Fig. 4. In order to highlight the possible connection with the radio structures, we have indicated in these diagrams the position of the radio hot spot and the outer edge of the radio lobe.
The narrow components (Fig. 3)
Fig. 3 shows that all the narrow components have similar line widths across the full extent of the nebulosity (FWHM 60-200 km s-1). The velocity shift with respect to the nuclear emission is rather constant for each component. The blue narrow component — detected along the radio axis and also in the detached emission line region 4.5 arcseconds to the NW of the nucleus (see Figure 3) — is noticeably displaced in velocity with respect to the other components (velocity shift: 80-140 km s-1).

As revealed by the [OIII]/H ratio, the ionization level of the narrow components shows little variation, both in absolute value and in spatial variation, across the arc. Due to the faintness of H it was necessary to add all the pixels along the 2.5”S slit. The integrated value for this slit fits in with the variation defined by the other narrow components.
The flux curves (Fig. 3 bottom right) of the redder narrow component along the radio axis and the narrow component along the extreme slit positions are almost identical. The absolute flux values also remain rather constant when we move North and South from the radio axis. The redder narrow component extends far beyond the hot spot (6.5 arc sec) and 4.8 arc sec beyond the edge of the radio lobe.
In contrast, the flux curve of the narrow blueshifted component detected along the radio axis is different in the sense that this component disappears abruptly at the edge of the radio lobe.
The broad components. (Fig. 4)
The broad component presents a strong variation in its kinematic, ionization and flux properties along the radio axis. The flux peaks at the position of the hot spot, where its emission dominates over the narrow components. It is also at this position that the line is broadest (FWHM900 km s-1).
At other positions along the radio axis and the extreme slits, the FWHM and flux are rather constant. The velocity curves are very similar along the radio axis and the 2”N slit, with an S-shape, although spatially shifted (1.6 arc sec).

The ionization level of the broad component is low compared to the narrow components ([OIII]/H1.5-4). As observed for the narrow component, the ionization level increases towards the galaxy along the radio axis.
It was necessary to bin together several pixels to increase the S/N ratio along the 2.5”S and 2”N slits. The error is still too large for the measurement on the 2”N slit, but the result obtained from the 2.5”S spectrum is consistent with a very low ionization level of the broad component ([OIII]/H2.8), similar to the value measured along the radio axis.
3.3 Results from the cross-cut slit (PA0).
In this section we analyse the information provided by the [OIII]5007,4959 and H lines in the intermediate resolution spectra obtained with the slit perpendicular to the radio axis.
Two spatially extended components are detected: a broad component (FWHM500-900 km s-1) and a narrow component (FWHM 200 km s-1). The results for both components are plotted in Fig. 5.
The low spectral resolution of this spectrum prevents us from resolving the two narrow components detected along the radio axis (see §3.2). Therefore, the information near and on the radio axis position is contaminated by the presence of the blue narrow component along the radio axis. In order to eliminate this effect, we have extracted a 1-D spectrum from the high resolution spectrum obtained along the radio axis and corresponding to the spatial overlap with the cross cut slit (see Fig. 1).

The narrow component (Fig. 5)
The narrow component is detected across the full extent ( 8.9 arc sec) of the emission line nebulosity in the N-S direction along PA0. The FWHM (100-150 km s-1), velocity shift (150-200 km s-1) and ionization level ([OIII]/H=6.5-8) are rather constant across the slit (N-S direction). This is clear once we have corrected for the contamination of the blue narrow component at the radio axis position.
The slight increase on the FWHM at the position of the radio axis, the V shape of the velocity curve, and possibly also the drop in the ionization level are due to the contamination by the blue component. The flux curve shows also a drop across two pixels at the radio axis position. The drop must be more pronounced, since the blue narrow component contaminates the emission in these two pixels. This suggests that the narrow component presents an edge brightening in the direction perpendicular to the radio axis.
The broad component (Fig. 5)
The broad component is spatially extended by 4.9 arcseconds N to S across the radio axis.
The width varies substantially across the arc in the N-S direction and peaks at the position of the radio axis. The width drops in the outer parts of the arc and is consistent with the values measured along the 2.5”S and 2”N slits (FWHM500 km s-1). The flux has a maximum near the radio axis position.
The ionization level of the broad component is remarkably low ([OIII]/H=1.2-3) compared to the narrow component, as expected from our previous results (see §3.2)
In summary, disturbed kinematics is apparent across the whole of the W arc. Multiple components are detected which present different spatial extensions, kinematic and ionization properties. A summary of the results is presented in Fig. 6.
3.4 Additional information along the radio axis.
We have spectra along the radio axis covering a wider spectral range, including numerous optical lines which can provide additional information on the origin and physical properties (density, temperature) of the kinematic components and their physical properties.
After all the 2-D frames were aligned, we extracted 1-D spectra from the brightest spatial pixels of the Western arc (1.53.2 arcsecond aperture, centered 5.6 arcseconds to the west of the nucleus along PA270). We then isolated the broad and narrow components in all the interesting emission lines, using the fitting method described above.
Table 2 presents the fluxes of the main optical lines relative to H for the two components revealed by the fits. Notice the clear differentiation between the broad and the narrow components: as the previous results suggest, strong low ionization lines dominate the spectrum of the broad component and high ionization lines dominate the spectrum of the narrow component.
| Narrow | Broad | |
| Flux(H) | (2.70.1) | (7.10.2) |
| [OII]3727 | 7.20.3 | 4.70.07 |
| H | 0.450.06 | 0.320.05 |
| [OIII]4363 | 0.1 | 0.070.01 |
| HeII4686 | 0.220.03 | 0.08 |
| [OIII]5007 | 5.40.2 | 1.350.06 |
| [NI]5199 | 0.240.04 | 0.220.03 |
| [OI]6300 | 0.80.1 | 1.100.08 |
| H | 3.30.2 | 3.10.1 |
| [NII]6583 | 1.90.1 | 2.630.09 |
| [SII]6716+6732 | 2.20.3 | 3.40.2 |
| [OIII]5007/4363 | Narrow | Broad |
|---|---|---|
| Radio axis | 52 | 175 |
| Cross cut | 5025 | 104 |
| Added | 5020 | 134 |
Particularly notable are the relative faintness of HeII4686 and the low values of the temperature-sensitive [OIII]5007/[OIII]4363 line ratio measured in the broad component (see below). Although these characteristics were also noted by Clark et al. (1997) on the basis of single Gaussian fits to low resolution spectra, the isolation of the different kinematic components shows that these are properties of the broad component. Thus, it is likely that the ionization minimum deduced from low resolution spectra at the position of the radio lobe by Clark et al. (1997) is a consequence of the increased dominance of the low ionization broad component at that location. The new results also suggest that the anticorrelation between the line width and ionization stage deduced from single Gaussian fits to the low resolution spectra is a consequence of the low ionization state of the broad component.
3.4.1 The electron temperature
We have used the [OIII]4363 and [OIII]5007 lines to measure the electron temperature of the two main kinematic components. H and [OIII]4363 were fitted together. We have done this analysis for three different spectra: 1) spectrum of the arc extracted along the radio axis from those pixels where the broad component was brightest (same aperture as in §3.4) 2) spectrum extracted along the cross cut slit position also from the pixels where the broad component was brightest (1.54.0 arcsecond extraction aperture centered on the radio axis); and 3) adding these two spectra after correcting for any possible shift in wavelength.
The best fit was obtained by constraining the velocity widths (obtained from the [OIII] 5007,4959 lines in the same spectrum) of all the kinematic components involved. We show in Fig. 7 the results of the three fits.


Although the [OIII]4363 line is faint, we are confident that the results are reliable because: 1) the fits to all spectra produce consistent results; and 2) the H/H ratios are consistent within the errors with Case B recombination.
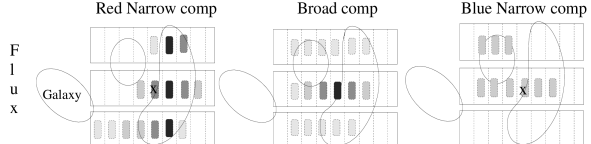
We have used the measured [OIII]5007/4363 ratios to calculate the electronic temperature of the gas using the formula in Osterbrock 1989 valid for low densities. The densities in the arc (see Clark et al. and next section) do not exceed a few hundred and the low density formula is valid. We present in Fig. 8 the function [OIII]5007/4363=f(), with the measured values of the line ratio for the two kinematic components (for the three fits) plotted. The broad component lies in a region of the diagram where [OIII]5007/4363 is highly sensitive to the temperature. For this reason the uncertainty in the temperature is large, in spite of the relatively small errors in the [OIII]5007/4363 ratio. It is clear, however, that the broad component has a higher electron temperature than the narrow component: we obtain, K, K, and K for fits to the radio axis, cross-cut and co-added spectra respectively, while for the narrow component we obtain . Note that, unlike the situation for the nuclear regions of active galaxies, the equivalent width of the [OIII]4363 line is large in the regions of interest. Consequently, systematic effects related to the subtraction of the underlying stellar continuum are unlikely to be a significant source of error.
We have also calculated the temperature using the total flux of the lines in the co-added spectrum (with no constraint on the properties of the lines). The result — [OIII]5007/4363= 288 — is consistent with an intermediate temperature between the narrow and the broad component (see Fig. 8): =21000K. This supports the consistency of our results. Assuming that the narrow component is cooler, =21000 K is a lower limit on the temperature of the broad component.


3.4.2 The densities
We have attempted to use the [SII]6716,6731 doublets to calculate the density (Osterbrock 1989) of the broad and the narrow components. We show in Fig. 9 the results of the fit.
We obtained =1.470.191 for the narrow component (consistent with low density limit), and =1.13 0.08 for the broad component. These results provide tentative evidence that the broad component has a higher density ( m-3, assuming =30,000) than the narrow component, although data with a higher signal-to-noise ratio and a better sky subtraction will be required to confirm this result and provide a more accurate estimate of the density contrast between the two components.
In order to provide a further check on our results, we have measured the total [SII]6716,6731 fluxes by fitting only a single component to each line in the blend. This leads to =1.240.06 and a density of m-3 (assuming =10,000) — consistent with Clark et al. (1997), who obtained m-3. Note that, if the narrow component has a low density — as tentatively suggested by our multi-Gaussian fits to the blends — and taking into account that the temperature of the broad component is higher, then m-3 represents a lower limit on the density of the broad component.
4 Discussion
4.1 The nature of the different kinematic components
The cartoons presented in Fig. 10 show 2-D pictures of the Western arc, with the spatial variation of the flux, FWHM and ionization level of the gas indicated. Darker squares indicate higher values. The relative intensity scale is approximately correct for each cartoon, but not from cartoon to cartoon. (ı.e. the same colour intensity in a given cartoon implies same value, but not in two different cartoons). The cartoons summarize the properties of the spatial variations of the different components in a more visual way. Notice the very similar line flux curves, ionization and kinematic properties of the red narrow component across the arc; the constancy of the flux and FWHM of the broad components across the arc, except at the position of the hot spot; and the presence of the blue component along the radio axis (and detached blob) with rather constant flux and FWHM. Notice also the increase in the ionization level for all the components as the distance to the nucleus of the host galaxy decreases.
The broad component
The similarities in the properties of the broad component measured in all spatial positions, except in the proximity of the hot spot, suggest that the broad components detected in all spectra have a common origin. This origin is clearly associated with the interaction between the radio-emitting structures and the ambient gas because:
- the large velocity width is incompatible with pure gravitational motions at the position of the hot spot, and is also rather large at the other positions;
- the very low ionization level is as expected from the compression effect of the shocks and/or the influence of shocks in the emission line processes;
- the flux and line width peak at the position of the radio hot spot. Again, this is what we expect, since the hot spot is the working surface of the radio jet and the effects of the interaction are expected to be stronger here.
- the high electron temperatures revealed by the [OIII] lines are consistent with the idea that the broad component is cooling gas behind a shock front. Although the density results are not conclusive, they suggest that the shocked gas has been compressed.
- the faintness of the HeII line also suggests the effects of shocks, since this property is predicted by shock models and similarly weak HeII lines are observed in other jet-cloud interaction targets (e.g. 3C171, Clark et al. 1998)
The possibility that the broad component is scattered light is rejected since it is detected in the forbidden lines and the polarization level of the continuum is low (Dickson et al. 1995).
The spatial extent of the broad component (4.86 arcseconds or 30 kpc in the N-S direction) indicates that the effects of the interactions reach regions as far as 15 kpc in the direction perpendicular to the radio axis — approximately the width of the radio jet cocoon.
The blue narrow component
The apparent association of the blue narrow component with the radio axis along PA0, the abrupt disappearance of this component at the edge of the radio lobe, and the drop of the flux at the position of the hot spot suggest that this component may be affected by the interaction. There is marginal evidence from the [OIII](5007)/H ratio along PA0 (Fig. 3) that this component has a lower ionization state than the red narrow component. If confirmed, this result is consistent with the idea that the ionization of the blue narrow component has been affected by the compression and/or ionization effects of the jet-induced shocks.
Alternatively, this component may simply represent a separate velocity system in the ambient gas of the host galaxy, with a higher density or different distance from the nucleus resulting in a lower ionization state. In this case, the apparent association with the radio axis along the cross-cut slit position would be coincidental.
The red narrow component
The emission of the red narrow component is characterized by little variation in properties across the arc, including the radio axis and the position of the radio hot spot. The line widths are consistent with gravitational motions (150 km s-1). The ionization level is high relative to the broad component. None of these properties present changes related to the radio structures. Moreover, this component is detected far beyond the radio hot spot (and beyond the edge of the radio lobe).
All of these properties suggest that the red narrow component is emitted by ambient material which has not yet been shocked.
If the material emitting the red narrow component had passed through the shocks and subsequently cooled behind the shock fronts, we would expect a sudden decrease in the ionization state of this component at the position of the edge of the radio lobe, due to the compression effect of the shocks. As the H line is too faint beyond the radio lobe, we have used the [OII]/[OIII] ratio to compare the ionization level beyond and behind the edge of the radio lobe. We have extracted a spectrum from a 1.61.5 arcsecond aperture (2 pixels in the spatial direction) immediately behind the edge of the radio lobe and another spectrum from a 2.41.5 arcsecond aperture (3 pixels) immediately beyond it. We obtain [OII]/[OIII]=2.10.2 behind and 2.00.3 beyond the edge of the radio lobe. Therefore, there is not the sudden change in the ionization level that we would expect if the red narrow component represents cooled post-shock gas.
Interestingly, the spatial distribution of this component — particularly the evidence for edge brightening along the slit position perpendicular to the radio axis (Fig. 5) — shows that it is associated with the arc structure observed in the [OIII] emission line image (see Fig. 1). The question then arises as to why this component has an arc shape — reminiscent of a bow shock — yet there is no spectroscopic evidence that the gas emitting the red narrow lines has been disturbed by the shocks. We will return to this question in section 4.4.1.
Therefore, we have resolved kinematically the emission from the shocked gas and the ambient gas in PKS2250-41. Both gaseous components present different kinematic and physical properties.
We note striking similarities between PKS2250-41 and two other jet-cloud interactions candidates which have recently been studied in depth: 3C171 (Clark et al. 1998) and PKS1932-46 (Villar-Martín et al. 1998). In the case of 3C171, broad and narrow components are observed across the extent of the interaction and, just as we observe in PKS2250-41, the broad component has a low ionization state while the narrow component has a high ionization state and extends beyond the radio structure. The HeII4686 line (integrated flux) is also weak. Although the case for a strong jet-cloud interaction in PKS1932-46 is weaker, we also find evidence in that object for a narrow, high ionization component which extends well beyond the radio lobe, and a broader, lower ionization component which may be related to a jet-cloud interaction. Remarkably, this similarity in the kinematic/ionization properties persists despite a wide range in the emission line morphologies of the individual sources.
4.2 The scenario
We now propose a scenario to explain the origin and properties of the different kinematic components resolved in PKS2250-41. This scenario could be applied to other radio galaxies in which jet-cloud interactions are taking place.
Hydrodynamical models of an advancing jet in a gaseous medium show that a bow shock is created that expands transversely to the jet axis (e.g. Hartigan et al. 1987, Taylor et al. 1992) (see Fig. 11 based on Bicknell et al. 1997).
The models also predict that the shocked gas is first heated to temperatures beyond 106K and cools slowly in a phase ruled by the decreasing pressure (e.g. Ferruit et al. 1997). When the gas cools to a temperature of a few 105K a catastrophic cooling occurs. The temperature drops very quickly, while the density increases. When the gas cools down to a few 104K we will be able to observe the line emission. The post-shock gas contains a significant range of gas temperatures and the [OIII]4363 line luminosity is dominated by emission from the 20,000–30,000 K zone. This is consistent with the high observed temperatures in the broad component and the possible compression suggested by the low ionization state and the density measurements.

The gas passing through the shock front will be accelerated and its kinematics will be perturbed. The effects are likely to be stronger at the position of the hot spot, the working surface of the radio jet. This is also what we observe (large FWHM with maximum value at the position of the hot spot).
Therefore, the properties of the broad component are consistent with it representing gas which has passed through the shock front and been accelerated, heated and compressed. Our results suggest that we are observing the gas while the dramatic cooling is happening (it is hotter than the ambient gas).
The blue narrow component is reminiscent of linear structures associated with the jets in some Seyfert galaxies. Such structures are characterized by high ionization level compared to the gaseous cocoon around the radio lobes (Capetti et al., 1996). The similarities with the properties of the blue narrow component in PKS2250-41 suggest a similar origin, although the nature of such linear features is not understood with any certainty.
On the other hand, the properties of the red narrow component are consistent with the idea that it is emitted by warm gas which has not yet been shocked. It reveals the properties of the underlying quiescent gas. However, uncertainties remain concerning how this component is ionized (see §4.4.1).
4.3 The acceleration mechanism
We have measured line widths of up to 900 km s-1 (FWHM) in PKS2250-41. The real velocities could be much larger, since, given the relatively weak radio core (Clark et al. 1997), it is likely that the jet is moving close to the plane of the sky, and any systematic motions will be induced in that plane. Line widths of up to several thousands km s-1 have also been measured on the EELR of many high redshift radio galaxies (e.g. Mc.Carthy et al. 1996, Röttgering et al. 1997).
One of the big challenges for models of interactions between the radio and optical structures is to explain how the warm gas is accelerated to such large velocities. The jet propagates through a two phase medium, with warm (T104 K) clouds embedded in a hot (T107 K) ambient phase, thus corresponding to a density contrast of if the clouds are in pressure balance with the hot phase. There are several possibilities for accelerating the warm gas. These include the following:
-
•
Interaction between the cloud and the bowshock ahead of the jet working surface: in the absence of entrainment processes (see below) the cores of the warm clouds will be accelerated to (e.g. Klein et al. 1994) where, is the final velocity of the warm clouds, is the shock speed in the hot phase, is the preshock density of the hot phase, and is the preshock density of the warm phase. Estimates of hot spot advance speed (0.01-0.1, e.g. Scheuer 1995) lead to shock velocities in the range 3103104 km -1. For warm clouds in pressure balance with a hot halo (T107 K) the density contrast is 1000 between the hot and the warm phases. Therefore, the range of velocities of the accelerated warm clouds is 100-1000 km -1. However, noting that this is the maximum we would expect for the working surface of the jet, that much of this velocity is likely to be directed in the plane of the sky (the direction of the jet), and that the cocoon away from the hotspot is likely to expand much more slowly than at the working surface, it is unlikely that the bowshock acceleration is sufficient to explain the large line widths observed in PKS2250-41 and other jet-cloud interaction candidates.
-
•
Entrainment in the hot post-shock wind. An interesting possibility is that the clouds are entrained in the hot wind behind the shock. Instabilities will arise at the interface between the hot, fast flowing gas and the warm, much slower moving clouds. These instabilities will lead to entrainment and acceleration of warm material in a hot wind (e.g. Stone & Norman 1992; Klein et al. 1994; Dai & Woodward 1994). Koekemoer (1998) has recently completed a grid of models in the specific context of clouds with high density contrast () in the hot gas around radio galaxies, which are impacted by shocks with properties typical of expanding radio cocoons. In Fig. 12 we show results from one such simulation carried out in the specific context of PKS 2250-41: a cloud initially at embedded in a hot interstellar medium with conditions appropriate to a rich group of galaxies is impacted by a shock moving at 5000 km s-1, expected to be typical of the bowshock expansion velocity. The velocity profiles of the stripped gas (with K) are shown. Although this is a relatively simple scenario, not yet taking into account time averaged profiles or different distributions of cloud sized along the line of sight, it is nevertheless clear than the velocities of order km s-1 can be produced in this way. By integrating across the surface of the shock, for a range of cloud properties and stages of interaction, it would clearly be feasible to produce broad lines similar to those observed in PKS2250-41.
-
•
Entrainment of clouds in the turbulent boundary layers between the radio jet and the ISM or the jet cocoon and the ISM (e.g. Sutherland et al. 1993). This mechanism could also produce large line widths and accelerate the clouds to a significant fraction of the jet speed.
Therefore it is likely that, in addition to the initial shock acceleration, an entrainment process is required to explain the large widths of the broad emission lines. Higher spatial resolution optical and radio observations will be required to determine whether the gas is being entrained in the hot post-shock wind or in the turbulent boundary layers of the radio jets.

4.4 Ionization mechanism: shocks vs. AGN photoionization
Shocks can influence the ionization of the gas in two ways (Sutherland et al. 1993, Dopita & Sutherland 1996): 1) the initial heating of the gas as it passes through the shock front, leading to collisional ionization of the gas and, eventually, to forbidden line emission as the gas cools radiatively; 2) the generation of a strong UV continuum in the hot post-shock gas which can ionize both the precursor gas and also the gas which has cooled radiatively behind the shock front. However, the galaxy also contains an active nucleus which is likely to generate a hard continuum capable of ionizing the gas. Which mechanism dominates the ionization of the extended emission line gas in PKS2250-41: shocks or AGN photoionization?
Taken at face value, the high electron temperature measured for the broad component in the western arc provides strong evidence that the gas emitting the broad component is cooling behind a shock front. Such high temperatures are predicted by models for shocked, cooling gas, but are difficult to explain in terms of conventional, radiation bounded AGN photoionization models. Although photoionization models which include matter-bounded clouds, or clouds photoionized by the hard continuum which has been partially absorbed by a matter-bounded component, can produce high electron temperatures (Binette et al. 1997), such models cannot explain a temperature as high as K and a low HeII(4686)/H ratio simultaneously.
In order to check the consistency of our results with the ionization models in greater depth, we have compared the measured values for the line ratios of the different gaseous components in PKS2250-41 with the prediction of both AGN photoionization and shock models. The results are shown in the diagnostic diagrams presented in Fig. 13. We have used the multi-purpose photoionization code MAPPINGS I (Binette et al. 1993a,b) to generate the AGN model predictions. We have assumed a density of 100 cm-3 at the illuminated face of the clouds, solar abundances, and a power-law spectral index for the photoionizing continuum of (). The results are presented as continuous lines in Fig. 13 as sequences in the ionization parameter , defined by
where is the speed of light, is the density of the gas in the front layer, is the Lyman limit frequency, and is the monochromatic ionizing energy flux impinging on the slab. Note that this same sequence is able to reproduce the general trend defined by the optical line ratios of low redshift radio galaxies (Robinson et al. 1987).
For the shock models we have used the published results of Dopita and Sutherland (1995), whose models include both the gas cooling behind the shock front, and the gas photoionized by the hot post-shock gas (the photoionized precursor). The two main parameters which influence the predicted spectrum are the velocity of the shock ([150,500] km s-1) and the magnetic parameter ([0,4] G cm-3/2). Adopted density is n(H)=1cm-3 and solar abundances. The spectrum predicted for the cooling gas is presented in the diagnostic diagrams in Fig. 13 as long dashed lines. Each sequence corresponds to a fixed value and changing . The spectrum predicted for the precursor is presented as dotted lines ([150,500] km s-1 and fixed 1 G cm-3/2).
Fig. 13 shows that the broad and narrow component occupy very different positions in the diagnostic diagrams, due mainly to a lower ionization level of the broad component. Although the line ratios for the broad component are reproduced by the AGN photoionization models on many of the diagrams, an important problem of AGN models is the failure to explain the high electron temperatures and the faintness of the HeII(4686) line for the broad component. We plot in Fig. 14 a new diagnostic diagram: [OIII]5007/4363 vs. HeII/H. This diagram clearly distinguishes the narrow and the broad components. The AGN photoionization models do not appear in this diagram at all because they predict high [OIII]5007/4363 ratios (i.e. corresponding to low electron temperatures), which fall above the top of the diagram. Taking Figures 13 and 14 together it is clear that the line ratios of the broad component are entirely consistent with the idea that this component represents collisionally ionized gas which is cooling behind a shock front; the shock velocities able to reproduce the position of the broad component in the diagnostic diagrams are in the range 200-300 km s-1. The AGN photoionization models fail to produce such a good overall fit to the emission line spectrum. Thus we have strong evidence that the jet-induced shocks not only compress, but also ionize, the warm clouds (i.e. the jets have a significant energetic input).
In contrast to the situation for the broad components, the AGN and shock precursor photoionization models produce good fits to the line ratios of the narrow components on most of the diagrams. Any remaining discrepancies between the measured and predicted [OIII]5007/4363 ratios for the narrow components can be resolved by adding a matter-bounded component (Binette et al. 1997).
4.4.1 The ionization of the red narrow component
We noted in section 4.1 that there is an apparent inconsistency between, on the one hand the association of the red narrow component with the arc structure, and on the other the lack of clear spectroscopic evidence that the material emitting this component has been shocked. One possible explanation — consistent with the emission line spectrum of this component — is that the red narrow component represents shock-photoionized precursor gas.
The shock photoionization process will be most efficient when the precursor gas is situated in the clouds that are being shocked, since the precursor gas will then absorb a large fraction of the ionizing photons generated in the shocks. As the fast shocks being driven through the hot ISM by the radio source engulf denser clumps of warm gas, slower shocks will be driven through the warm clouds (see section 4.3). The X-ray photons generated in the hot gas immediately behind the shocks in the warm clouds will not be efficient at photionizing the warm gas, however, provided that the gas cooling time () is short compared with the shock crossing time (), a cooling zone will form downstream of the shock which will emit lower energy photons, capable of ionizing the precursor gas efficiently. Thus we require for efficient precursor ionization. Using the approximate formula for the cooling time given in section 2.3 of Klein et al. (1994) this leads to the following constraint on the diameter () of warm clouds:
where is the precursor density (in units of ), and is the velocity of the slow shock through the warm cloud. Thus, for a precursor density typical of warm clouds in pressure equilibrium with the hot X-ray halo of a group of galaxies () and a shock speed consistent with the measured emission line ratios of the broad component ( ), we require pc for efficient precursor photoionization. Although we have no direct indication of the diameters of the warm clouds interacting with the radio components in PKS2250-41, it is notable that typical spiral galaxies contain populations of molecular cloud complexes with diameters that are orders of magnitude larger than this limit (e.g. Mihalas & Binney 1981, Chapter 9). Therefore, it is likely that the PKS2250-41 system will contain at least some clouds for which the precursor photoionization process envisaged above is feasible.
We now estimate the mass flow rate required to maintain the narrow luminosity (). For a strong shock, the H luminosity of the photoionized precursor gas is related to the shock velocity through the warm clouds () and the mass flow rate through the shock () by the following equation (adapted from equation 4.4 of Dopita & Sutherland 1996):
For our chosen cosmology, we estimate a total H luminosity for the red narrow component emitted by the arc of = 2.21034 . Substituting this into the expression for the luminosity we obtain:
To put this mass flow rate into context, if the radio source requires 106 yr to traverse the region of the arc, and , the total amount of material “consumed” in the shock will be M⊙ — comparable with the total HI content of a typical spiral galaxy. Although large, this is consistent with the idea that the phenomena we observe in PKS2250-41 are the result of a direct interaction between the radio-emitting components and a companion galaxy. Note also that there is more than enough mechanical energy in the jets to power the emission line regions (see Clark et al. 1997).
As well as the red narrow component directly associated with the arc, we also see a more extended red narrow component which extends well beyond the western radio lobe. Given its spatial extent, this component is unlikely to be emitted by clouds which have been engulfed by the fast shock driven through the hot ISM by the radio components. Nonetheless, it remains possible that this component is photoionized by photons from the warm, shocked clouds behind the shock front, provided that the covering factor of the extended component is large enough to intercept a significant fraction of ionizing photons generated by the shocks. However, a potential problem with this scenario is that the effective ionization parameter of the shock continuum will be much larger for the warm clouds in the arc than for the more extended warm clouds, yet the measured ionization state for these two components is similar (see section 4.1). While it is possible to get around this problem by assuming that the more extended narrow component is associated a lower density ISM than the narrow component emitted by the arc, it seems unlikely that the density gradient in the ambient ISM would exactly compensate for the change in the flux density of the shock continuum with distance from the shock front.
In view of this potential problem, we should also consider the alternative possibility: that the emission line arc represents the intrinsic structure of the AGN-photoionized ambient gas i.e. the observed arc-like morphology is not a consequence of the shock, and the resemblance to a bow shock is misleading. Arc-like structures in the ISM are readily produced as a consequence of galaxy mergers and interactions, and PKS2250-41 shows morphological evidence for interactions with at least one companion galaxy (Clark et al. 1997). However, it would seem a remarkable coincidence if, purely by chance, such a merger remnant exactly circumscribed a radio lobe. Furthermore, arc-like structures circumscribing the radio lobes have been observed in other radio galaxies with jet-cloud interactions (e.g. PKS1932-464, Villar-Martín et al. 1998 and Coma A, Tadhunter et al. in preparation).
Thus, no explanation for the ionization and distribution of the red narrow component seems entirely satisfactory, and this issue clearly warrants further investigation.
4.5 Shocked and ambient gas in high redshift radio galaxies
PKS2250-41 shares many similarities with high redshift radio galaxies. Therefore, what we learn studying this object will help us to understand the observed properties of very distant radio galaxies. Like many high-z radio galaxies, PKS2250-41 shows perturbed kinematics and a close correlation between the EELR and the radio structures. McCarthy & van Breugel (1989) noted that the brightest EELR in radio galaxies at z0.7 tend to be associated with the radio lobe closest to the nucleus of the host galaxy which moreover, is systematically more depolarized (Pedelty et al. 1989, Liu & Pooley 1991). PKS2250-41 also shows these asymmetries (Clark et al. 1997) which may arise, as proposed for high-z radio galaxies, as a consequence of an asymmetric gaseous environment surrounding the host galaxy.
We have shown that the strong interactions between the radio jet and the ambient gas imprint special features in the observed properties of the ionized gas, which differ from the ambient (non shocked) gas properties. Do we see these features in HzRG?.
At least some HzRG show, in addition to the high velocity gas associated with the radio structures, large halos of ionized gas extending far beyond the radio structures. Interestingly, the kinematics of this gas are rather quiescent compared to the inner structures. Examples include 1243+036 (3.6, van Ojik et al. 1996), 3C368 (1.1, Stockton et al. 1996) and 4C41.17 (3.8, Dey et al. 1997, Chambers et al. 1990). The high velocity gas in both 3C368 and 4C41.17 presents low ionization level compared to the low velocity gas.
1243+036, 3C368, 4C41.17 are examples of distant radio galaxies which show the presence of two types of ionized gas. The similarities with PKS2250-41 suggest that the narrow line gas (at least the gas detected beyond the radio structures) is probably quiescent ambient gas which has not interacted with the radio structures and is ionized by the AGN continuum and/or the shock UV continuum. On the other hand, the high velocity gas is shocked gas which has been heated, compressed and kinematically disturbed by the shocks.
Therefore it seems likely that the ambient and shocked gas have also been resolved in some of the high-z objects, and they present differences in their kinematics and ionization properties consistent with the results obtained for PKS2250-41. A similar kinematic study as described in this paper will be very fruitful in these objects. It will allow us to isolate the non-shocked ambient gas and study the properties of the gaseous halos in elliptical galaxies in the young Universe as well as to understand the way the observed properties are determined by the interaction with the radio-emitting plasma.
5 Summary and conclusions
We have studied the effects of the interaction between the ambient gas and the radio-emitting plasma in PKS2250-41. The results of this research provide clues for understanding the processes which determine the observed properties of the majority of very distant radio galaxies and to determine the rôle played by the interactions between the radio and optical structures in active galaxies in general.
We have resolved kinematically the emission from the gas which has passed through the shocks induced by the radio plasma and the emission from the ambient precursor gas. The properties of the two main gaseous components show marked differences.
Our analysis shows that the effects of the interactions can spread at least 15 kpc perpendicular to the radio axis — across the full extent of the radio lobes. The interacting gas presents broad line widths (FWHM900 km s-1), a low ionization level and weak HeII4686 compared to the ambient gas. We have presented the first evidence that the gas emitting the broad component is hotter (30,000 K) than the ambient gas (15,000 K). All of these properties, together with the morphological association with the radio structure, are consistent with the broad component being emitted by gas which has been heated and collisionally ionized by a jet-induced shock and is now radiatively cooling behind the shock front. This represents compelling evidence that jet-cloud interactions not only compress and accelerate the interacting warm clouds, but also ionize them.
The ambient gas is characterized by a relatively high ionization level and a more quiescent kinematics, consistent with gravitational motions. The properties of this ambient gas can be explained in terms of pure gravitational motions and photoionization by a hard continuum source. It is not yet clear whether this component is photoionized by the AGN or by UV photons emitted by the gas cooling behind the shock front. The arc shape circumscribing the radio lobe suggests that the second mechanism is dominant, although a large mass flow rate through the shock is required.
The similarities between the kinematic properties of PKS2250-41 and some high-z radio galaxies suggest that the ambient and the shocked gas have also been resolved in the more distant sources, while the similarities between PKS2250-41 and other jet-cloud interaction radio galaxies (3C171, PKS1932-464) in spite of their very different morphology, suggest that jet-cloud interactions have rather constant effects on the physical and kinematic properties of the emission-line gas in powerful radio galaxies.
Acknowledgments
The authors thank the referee, Dr. G. Bicknell, for a careful study of the paper and for providing useful comments which helped to improve it. We would like to thank Bob Fosbury for reading the manuscript and contributing useful comments. Thanks to L. Binette for his code MAPPINGS I, that we used to build the photoionization models presented here. M.Villar-Martín acknowledges support from PPARC.
References
- [1] Allen M.G., Dopita M.A., Tsvetanov Z.I., 1998, ApJ, 493, 517
- [2] Axon D., Marconi A., Capetti A., Macchetto F., Schreier E., Robinson A., 1998, ApJ, 496L, 75
- [3] Barthel P.S. 1989, ApJ, 336, 606
- [4] Best P.N., Longair M.S., Röttgering H.J.A., 1996, MNRAS, 280, L9
- [5] Bicknell G.V., Dopita M.A., & O’Dea, C.P. 1997, ApJ, 485, 112
- [6] Binette L., Wang J.C.L., Zuo L., Magris C.M., 1993a, AJ, 105, 797
- [7] Binette L., Wang J.C.L., Villar-Martín M., Martin P.G., Magris C.M., 1993b, ApJ, 414, 535
- [8] Binette L., Wilson A.S., Storchi-Bergman T., 1996, A&A, 312, 365
- [9] Capetti A., Axon D., Macchetto F., Sparks W.B., Boksenberg A., 1996, ApJ, 469, 554
- [10] Chambers K.C., Miley G.K., van Breugel W., 1987, Nature, 329, 604
- [11] Chambers K.C., Miley G.K., van Breugel W., 1990, ApJ, 363, 21
- [12] Clark N.E., Tadhunter C.N., Morganti R., Killeen N.B., Fosbury R.A.E., Hook R.N., Shaw M., 1997, MNRAS, 286, 558
- [13] Clark N.E., Axon D., Tadhunter C.N., Robinson A., O’Brien P., 1998, ApJ, 494, 546
- [14] Dai, W., Woodward, P., 1994, ApJ, 436, 776
- [15] Dey A., van Breugel W., Vacca W.D., Antonucci R., 1997, ApJ, 490, 698
- [16] Dickson R., Tadhunter C.N., Shaw M., Morganti R., 1995, MNRAS, 273, 29p
- [17] Dopita M.A., Sutherland R.S., 1995, ApJ, 455, 468
- [18] Dopita M.A., Sutherland R.S., 1996, ApJ, 102, 161
- [19] Ferruit P., Binette L., Sutherland R.S., Pecontal E., 1997, A&A, 322, 73
- [20] Fosbury R.A.E., 1989, in ESO Workshop in Extranuclear Activity in Galaxies, eds. E.J.A. Meurs and R.A.E. Fosbury, ESO Scientific Publications, p169
- [21] Hartigan P., Raymond J., Hartman L., 1987, ApJ, 316, 323
- [22] Klein R., McKee C., Colella P., 1994, ApJ, 420, 213
- [23] Koekemoer, A. M. 1998, in preparation
- [24] Liu & Pooley G., 1991, MNRAS, 249, 343
- [25] McCarthy P.J., Spinrad H., Djorgovsky S., Strauss M.A., van Breugel W., Liebert J., 1987, ApJ, 319, L39
- [26] McCarthy P.J., van Breugel W., 1989, in ESO Workshop on Extranuclear Activity in Galaxies , eds. E. Meurs and R.A. Fosbury, ESO Conf. and Workshop Proc. no 32, p55
- [27] McCarthy P.J., Baum S., Spinrad H., 1996, ApJS, 106, 281
- [28] Mihalas, D., Binney, J., 1981, Galactic Structure, Freeman.
- [29] Osterbrock D.E., 1989, The Astrophysics of Gaseous Nebulae and Active Galactic Nuclei, University Science Books
- [30] Pedelty J.A., Rudnick L., McCarthy P.J., Spinrad H., 1989, AJ, 97, 647
- [31] Röttgering H.J.A., van Ojik R., Miley G.K., Chambers K.C., van Breugel W., de Koff S., 1997, A&A, 326, 505
- [32] Scheuer P.A.G., 1995, MNRAS, 277, 331
- [33] Stockton A., Ridgway S.E., Kellogg M., 1996, AJ, 112, 902
- [34] Stone, J. M., Norman, M. L., 1992, ApJ, 390, L17
- [35] Sutherland R.S., Bicknell G.V., Dopita M.A., 1993, ApJ, 414, 510
- [36] Tadhunter C.N., Shaw M., Clark N.E., Morganti R., 1994, A&A, 288, L21
- [37] Taylor D., Dyson J.E., Axon D., 1992, MNRAS, 255, 351
- [38] van Ojik R., Röttgering H., Carilli C.L., Miley G.K., Bremer M.N., Macchetto F., 1996, A&A, 313, 25
- [39] Villar-Martín M., Tadhunter C.N., Morganti R., Clark N., Killeen N., Axon D., 1998, A&A 332, 479