POX 186: the ultracompact Blue Compact Dwarf Galaxy reveals its nature ††thanks: based on observations carried out at NTT in La Silla, operated by the European Southern Observatory, during Director’s Discretionary Time.
Abstract
High resolution, ground based and band observations of the ultra compact dwarf galaxy POX 186 are presented. The data, obtained with the ESO New Technology Telescope (NTT), are analyzed using a new deconvolution algorithm which allows one to resolve the innermost regions of this stellar-like object into three Super-Star Clusters (SSC). Upper limits to both masses (M 105 M⊙) and the physical sizes (60pc) of the SSCs are set. In addition, and maybe most importantly, extended light emission underlying the compact star-forming region is clearly detected in both bands. The color rules out nebular H contamination and is consistent with an old stellar population. This casts doubt on the hypothesis that Blue Compact Dwarf Galaxies (BCDG) are young galaxies.
Key Words.:
Galaxies: compact, dwarf, evolution, formation, photometry, starburst1 Introduction
Among the Blue Compact Dwarf Galaxy (BCDG) population, there exists a small class of very compact star-forming objects, unresolved on photographic and CCDs images. This small fraction (%) of BCDGs does not appear to possess any underlying stellar component substantially older than the starburst population (Thuan (1983); Kunth et al. (1988); Drinkwater & Hardy (1991)). The most representative galaxy of this kind is the star-forming dwarf POX 186 (RA:13h23m12.0s; DEC:-11∘ 22’; B1950). This relatively nearby galaxy (recession velocity km s-1) was discovered in a prism-objective survey search (Kunth et al. (1981)), and has been observed spectroscopically as part of a primordial He abundance study (Kunth & Sargent (1983)). Ground-based images taken at ESO (Kunth et al. (1988)) revealed a nearly round, barely resolved object with no apparent substructure. The luminosity of this galaxy is about (Kunth et al. (1988)) and population synthesis models predict that it should have a post-burst luminosity as low as . Therefore, this object may represent the smallest unit of galaxy formation. Given POX 186’s luminosity, its total luminous mass should be 108M⊙ (=80 km s-1 Mpc-1 and mass-to-light ratio of 1.). This exceeds by 1 to 2 order of magnitudes the mass of star clusters observed in our Galaxy or in neighboring galaxies.
It has been conjectured that POX 186 could be a young, isolated, giant star-forming cluster. The advent of HST, with its very high angular resolution, has permitted the discovery of so-called “Super-Star Clusters” (SSC) found in many star-forming dwarf and irregular galaxies. One of the first and most remarkable examples is He2-10 by Conti & Vacca (1994), where UV images obtained with the Faint Object Camera on HST revealed 10 bright star clusters near the center of the galaxy as well as a large number of fainter clusters in a starburst region (350 pc) away from the center.
In this paper, we present optical observations obtained with the New Technology Telescope (NTT) at ESO, La Silla (Chile), and report on the presence of an extended faint halo underlying the starburst component. We show also that, using deconvolution, POX 186 can be resolved into several substructures which can be explained in terms of SSCs.
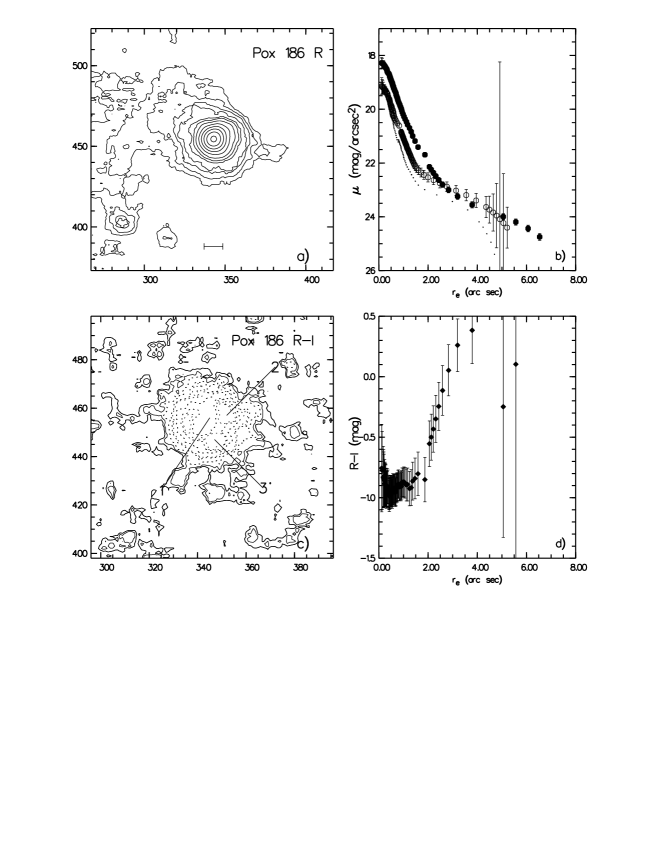
a) An band contour plot of POX 186, the size of the field is 18′′18′′, North is up, and East is right. The contour interval is 0.5 mag.. The lowest contour corresponds to a surface brightness of 24 mag arcsec-2. The bar corresponds to a linear size of 100 pc (the linear scale is 71 pc/arcsec). b) The light distribution profiles in (filled circles) and (open circles). The error bars on the light profiles have been computed assuming that Poisson statistics apply. The dotted profile corresponds to the profile of a nearby non-saturated star. c) A Contour plot of the map. The size of the field is 1212′′. The lowest contour corresponds to a color of –0.8 mag in the center of the galaxy; the intervals between the contours are 0.1 mag, and the dashed contours represent negative values. d) The color profiles, uncorrected for Galactic extinction. The errors are computed from the errors on the and profiles. Note the presence of 3 “blobs” on the map.
2 NTT observations
POX 186 was observed in the and bands at the NTT (ESO, Chile) with the SUperb Seeing Imager (SuSI) in February 1996. The pixel size of the detector is 0.128′′. The weather conditions were photometric and the seeing was better than 0.9′′. The exposures were split into two 10-minute exposures due to the high sky background.
The first part of the data reduction (i.e., bias subtraction and flat fielding using dome and sky flat-fields) was performed using the IRAF package. The cosmic-rays removal procedure available in MIDAS was applied to the images. As the scattered light from the moon caused an uneven sky-background around the galaxy, the sky was subtracted with a frame obtained by smoothing the reduced images with a median filter and a large smoothing box, while masking the objects in the frames. This was applied to each of the two frames which were then averaged.
2.1 Surface photometry
The photometric results are summarized in Table 1. This includes the asymptotic magnitude masym (extrapolated integrated magnitude), the effective surface brightness in mag/arcsec2 (surface brightness at the half light radius), the effective radius reff in arcseconds (half light radius) and the effective mean surface brightness (mag/arcsec2) (mean surface brightness within reff), for the and bands. Finally, the scalelength parameter () and the central surface brightness () derived by extrapolating the fit at the equivalent radius to zero, are given.
The errors on the integrated magnitudes are 0.05 mag in both the and bands. Errors on the surface brightness measurement were computed assuming that Poisson statistics applied.
| R | I | |||
|---|---|---|---|---|
| masym | 16.36 | 17.05 | ||
| 22.23 | 21.52 | |||
| reff | 3.75 | 2.35 | ||
| 21.20 | 20.90 | |||
| (exp) | 22.03 (0.04) | 21.68 (0.01*) | ||
| (r1/4) | 13.52 (0.21) | 13.23 (0.08) | ||
| (kpc-1) | 5.56 (0.72) | 6.14 (0.40) |
(*): 1- error
A 18′′18′′ band contour plot centered on POX 186 is shown in Fig. 1a. The bar indicates a linear size of 100 (H0 = 80 km s-1 Mpc-1). The surface brightness profiles in the band (filled circles) and band (open circles) are displayed in Fig. 1b. The color map (1212′′), and the color distribution profile as a function of the equivalent radius (De Vaucouleurs & Aguero (1973)) are displayed in Figs. 1c and 1d, respectively.
A more detailed explanation of the surface photometry and color distribution profiles is given in Doublier et al. (1997).
2.2 Images and Light distribution profiles
POX 186 is clearly resolved (see Fig. 1a) in our sub-arcsecond images (reff(R) = 3.75′′, reff(I) = 2.35′′). An obvious asymmetry in the external isophotes can be seen on the Eastern side of the nucleus. It is seen in both our and band images. Two different regions are seen on the color plot (fig. 1d). While the innermost region of the galaxy is blue (), the outer part shows a red color gradient. Over a region extending from 2′′ to 6′′ (i.e., over about 280 pc) away from the nucleus, the color increases from –0.8 mag to 0.4 mag. This color distribution translates into a color gradient of mag/kpc.
Furthermore, the map (Fig. 1b) reveals three distinct substructures in the central parts of the galaxy (labelled “1”, “2”, “3”), the largest of them being centered with respect to the outer isophotes. This suggests that the central nucleus, which was originally thought to be single, consists of smaller units.
Alternatively, the observed structures could be due to signal fluctuations due to poor alignment of the frames. Such an effect would be enhanced when creating the color maps. However, other objects (stars) do not show such artifacts. We can therefore safely consider these structures to be real and intrinsic to the galaxy.
We used the algorithm developed by Saglia et al. (1997), to fit the light distribution profiles in the and bands. The central parts of the two profiles are not well fitted by a r1/4 law. A model that includes an exponential profile and an r1/4 gives a better fit to the data; however, the best fit still leaves significant residuals in the center of the frame. This suggests that POX 186 is not a single spheroidal object, like a large star cluster. On the contrary, the galaxy appears to be composed of a nucleus with a profile broader than a r1/4 law, plus underlying emission compatible with an exponential profile.
3 Underlying galaxy and starburst
The extended features observed in the and frames and “knotty” center of the map have been deconvolved with a new deconvolution algorithm developed by Magain et al. (1998). The algorithm decomposes the images into a sum of point sources plus a diffuse deconvolved background smoothed on a length scale chosen by the user. As output, the program returns the photometry and position of the point sources, as well as a deconvolved image.
The main idea behind the new deconvolution technique, is to avoid deconvolution by the total Point Spread Function (PSF) of the image, Instead, a narrower function is used, allowing the spatial frequencies of the deconvolved image to stay within the limits imposed by the sampling theorem. As a consequence, most of the so-called “deconvolution artifacts” are avoided.
The good sampling of the images (pixel size of 0.128′′) and the good stability of the PSF across the field make our data well suited for deconvolution. The FWHM in the undeconvolved images is of the order of 0.85′′. The deconvolved images have a resolution of 0.38′′. This is dictated by the signal-to-noise of our data. The PSF needed for deconvolution was obtained from a star, about as bright as POX 186 and situated 1′ away.
We consider that the solution found by the deconvolution procedure is good when the residual map, in units of the photon noise, has the correct statistical distribution across the whole field, i.e. equal to one (or very close, see Courbin et al. (1998) and Burud et al. (1998) for more details on this procedure).
The residual maps obtained show significant structures when only one point source is used to model the center of POX 186. A second point source was added to obtain good residual maps in the band, whereas a third source had to be used to fit properly POX 186’s nucleus in the band. Note that adding more point sources leads to over-fitting the central parts of the galaxy. We can therefore conclude that the present data are compatible with a galaxy nucleus composed of 3 point sources in and at least 2 in .
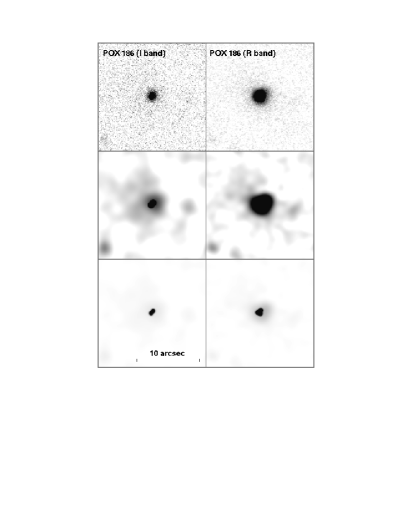
Figure 2 shows the and band images with different cut-off intensity in order to display better either the faint extensions of the galaxy, or the bright central region. While the diffuse halo of the galaxy was already detected in the reduced band frame (S/N 3), it is hardly seen in the frame (S/N 3) despite an obvious asymmetry of the image. This diffuse halo clearly shows up on the surface brightness profiles, where we can reach brightness levels as faint as a few percent of the sky background level. The diffuse halo can also be seen in the deconvolved images.
| R | I | |||||
|---|---|---|---|---|---|---|
| No | m | MR | Mass* | m | MI | Mass* |
| 1 | 19.23 | -11.59 | 2.3 | 19.61 | -11.21 | 1.2 |
| 2 | 19.27 | -11.55 | 2.2 | 19.85 | -10.97 | 0.9 |
| 3 | 19.47 | -11.35 | 1.8 | not | detected | - |
(*): Mass in units of 106 M⊙
From the deconvolved images, we obtained an estimate of the luminosity and the masses of the “clusters” (Table 2). Because of the limited S/N ratio and the heavy blending of the knots, the magnitude errors are large, about 0.5 mag. The absolute magnitudes are computed assuming = 80 km s-1 Mpc-1, and the masses are determined by assuming a mass-to-light ratio of 1 (recent HI observations of POX 186 set an upper limit of a few 106 M⊙, S. Coté, private communication). The masses are large compared with the observed masses of single SSCs (Meurer et al. (1995)). However, if the mass-to-light ratio estimates of Charlot et al. (1996) for a single burst stellar population of age less than 107 years () are more realistic, the “clusters” in POX 186 will have smaller masses (104 to 105 M⊙). This is similar to those of SSCs observed in other starburst galaxies.
The physical sizes of the knots are difficult to ascertain. They are unresolved and the only constraint we can set on their size is given by the seeing of the observations, 0.85′′, or about 60 pc. Their size on the deconvolved image, 0.384′′ (about 26 pc) only reflects the adopted resolution limit.
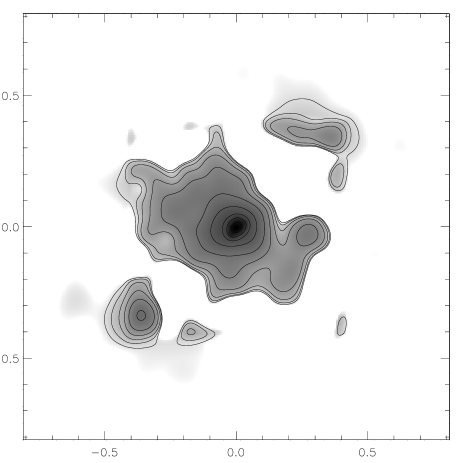
As a check on the accuracy of the deconvolution, we also generated the two-dimensional cross-correlation map of the and band “un-deconvolved” frames (Fig. 3). Only the levels above 0.5 are displayed in Fig. 3 (a level of 0. implies no correlation and a level of 1. implies full correlation). The cross-correlated image reproduces very well the structures seen in both deconvolved frames. This indicates that they are real and that they are not due to noise enhancement introduced by poor sky subtraction, or by the deconvolution process.
One of the knots in is not detected in the band, although the cross-correlation map shows an obvious asymmetry at the corresponding position on the frame. The residual maps after deconvolution in , are significantly better when three point source are considered. Detecting only two of them in the band may therefore indicate that the third is too faint. Indeed, the band magnitude of the counterpart of the “missing” knot would be about 20 mag. which is still consistent with the central index of –0.8.
The extended component of POX 186 shows a filamentary structure instead of a smooth light distribution as usually seen in BCDGs (Papaderos et al. (1996), Telles et al. (1997), Doublier et al. (1997)). Although this is at the limit of the noise level of the present data, the filaments can be seen in both the deconvolved images and the cross-correlation map. The low surface brightness component of POX 186 may be similar to the filamentary structures seen in dwarf irregulars, rather than the smoother surface profiles of BCDGs.
Further observations in the near-IR with high-sensitivity detectors and larger telescopes (the expected surface brightness of an evolved stellar population in band is below 21 mag. arcsec-2, i.e., the limit for 4 meter-class telescope with the current detectors) will elucidate the nature of the stellar population in this “halo”.
4 Discussion
4.1 Nature of the galaxy
We have shown that the faint halo seen around the nucleus of POX 186 is a real structure, rather than an artefact produced by sky background subtraction, or by the deconvolution.
The nature of this diffuse component could be due to an evolved stellar population, or to H emission contaminating the band, leaking from the star forming region. However, if the extension was due to H emission, the band profile would not be so similar. Moreover, the color distribution would not exhibit a steep color gradient. Its observed apparent increase is in fact due to a decrease of the contribution of the band flux with respect to the band. This is definitely not consistent with the contamination hypothesis of the band by H at large radii.
From the previous observations, no underlying component was detected, and it was argued that the red colors obtained by Kunth et al. (1988) ( = 1.28) were due to H emission contaminating the band filter. However, together with the color, the color of the faint extension is consistent with emission dominated by red giant stars of spectral type G (Johnson (1966)). From the observed emission-line ratios, we know that internal reddening is negligible, so that the color cannot be attributed to dust. There is therefore strong evidence for an extended faint component of old stars underlying a starburst region.
4.2 POX 186 among the other dwarf galaxies population
POX 186 is a very small and compact object compared with other BCDGs: its effective radius is less than 300 in , and less than 200 in , while the mean effective radius ( band) for a typical BCDG is about 800 (Doublier et al. (1997); Doublier et al. (1999)). The compactness index (ratio of the effective radius to the radius at 1/4th of the total luminosity) of POX 186 is r0.5/r in ; the mean compactness index value for BCDGs is 2.3 (Doublier et al. (1999)). It is 1.78 in the band. This indicates that the galaxy is much less compact in than in , supporting the hypothesis of the presence of an extended structure underlying the starburst component. This compares well with irregular galaxies which have compactness indexes of 1.6, whereas elliptical galaxies have larger compactness indexes of 2.9-3.0 (Fraser (1977); De Vaucouleurs & Aguero (1973)).
Using the color given by Kunth et al. (1988) to estimate a lower limit for the central surface brightness (B) in the band, we can place POX 186 in the diagram [, MB] derived by Binggeli & Cameron (1991). POX 186 is located in the continuation of the sequence defined by elliptical galaxies and spiral bulges. The exponential underlying component is located within the sequence defined by the dwarf irregulars and disks of spirals in the [, MB] plane. In the [, MB] diagram, the underlying component falls well below the bulk of dEs, dIS and S0s. It is therefore more likely to be associated to Low Surface Brightness galaxies than to dwarf irregulars.
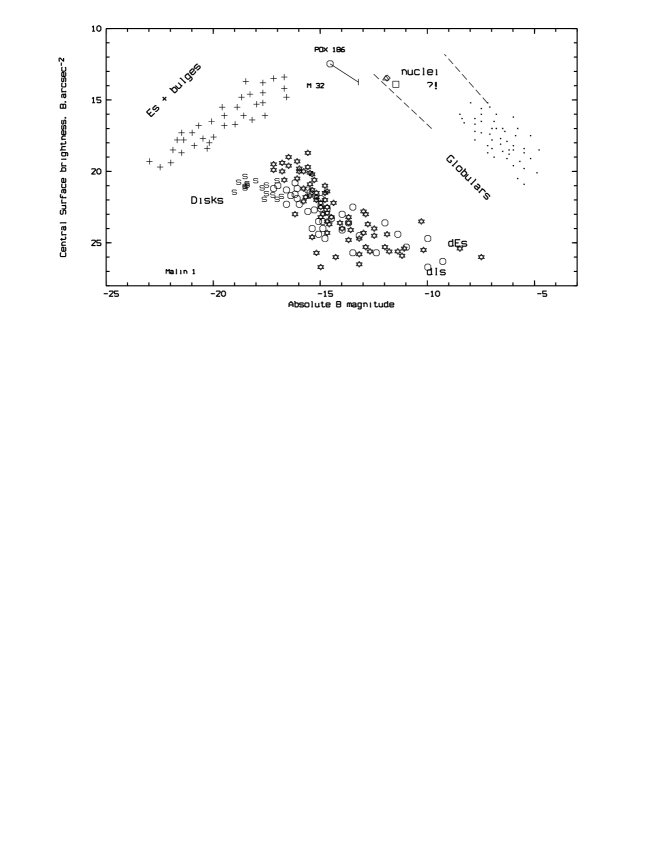
The 3 “clusters” lie well within the “galactic nuclei” sequence discussed by Binggeli & Cameron (1991) and Phillips et al. (1996), in the [, MB] plane. In addition, population synthesis evolutionary models predict that the star forming regions fade considerably following an instantaneous burst (about 3-5 magnitude in the B band; Cerviño & Mas-Hesse (1994)). If we apply the predicted dimming to the 3 clusters, they evolve to the Globular Cluster sequence in the [, MB] plane.
5 Conclusion
The primary result of our study is the detection of an extended faint component of old stars .
As revealed by optical CCD imaging, most BCDGs show a faint envelope surrounding the compact central starburst region (Thuan (1983); Hunter & Gallagher (1985); Kunth et al. (1988)). Near-infrared observations and evolutionary synthesis models have shown that these faint envelopes are composed of stars older than several Gyrs (Thuan (1983); Hunter & Gallagher (1985); Doublier et al. (1999)). However, any previous major episode of star formation must have been rather mild since the large value of the H equivalent width (370Å) observed in the very center of POX 186 (Kunth & Sargent (1983)) indicates that the underlying component does not contribute enough to the optical continuum so as to dilute significantly the emission line. Moreover, the optical spectrum shows a very high excitation and the overall measured metallicity is low (, Kunth & Sargent (1983)). Using a closed-box model for chemical enrichment, the present burst could account for most of the metal enrichment and continuum light (Marconi et al. (1994)). No HI has been detected in POX 186. It could be that it has been exhausted. Alternatively, the gas could have been highly ionized and/or dispersed by the strong winds generated by the massive stars in the clusters.
Our second result is the discovery of Super Star Clusters (SSCs) in POX 186. The deconvolution technique reveals the presence of at least two “clusters” in the center of POX 186, with properties similar to that of the SSCs observed by Meurer et al. (1995) in other starburst galaxies. They found SSCs in HST FOC UV images of a sample of nine starburst galaxies. The SSCs in their sample account for about 20% of the total observed UV flux. Similar SSCs have been discovered in several other irregular or starburst galaxies (e.g., NGC 1569, NGC 1705: O’Connell et al. (1994); NGC 1140: Hunter et al. (1994); M82: O’Connell et al. (1995); NGC 4214: Leitherer et al. (1996); NGC 253: Watson et al. (1996)). These clusters have luminosities in the range , diameters of the order of 10 pc or less, and estimated masses in the range (e.g., Hunter et al. (1994); O’Connell et al. (1994); Conti & Vacca (1994)). Typical sizes and upper-mass estimates of SSCs are consistent with those of Galactic globular clusters and it is suggested that these SSCs may be globular clusters in the process of formation, with ages of less than yrs (Conti & Vacca (1994)). At this point, we remark upon the work by Phillips et al. (1996) based on the nuclei and “knots” of late-type galaxies. They find an obvious overlap in properties between the large star clusters in these galaxies and the nuclei. Current discussions aim at establishing whether stellar-like cusps could be remnants of a previous starburst episode (Kormendy (1989)). We believe that the multiple sources observed in POX 186 could be SSCs like in other starbursting galaxies. Their derived absolute magnitudes agree well with those of SSCs observed in starburst galaxies. Clearly, it is mandatory to confirm the existence of the substructures in POX 186: SSCs and underlying galaxy. First, POX 186 remains one of the smallest star-forming galaxy: the exponential scale length of POX 186 ( 200 pc ) is small compared to other known BCGDs. Second, the presence of SSCs raises new questions about its future evolution. Finally, the presence of the underlying old component removes POX 186 from the “young” galaxy candidates list.
Acknowledgements.
Part of this work was performed during Daniel Kunth’s visit at ESO in a Visiting Astronomer program. The authors are thankful to M. Mas-Hesse for the very helpful discussion. VD wishes to thank the Institut d’Astrophysique de Paris where a good deal of the present work was done. FC is supported by ARC 94/99-178 “Action de Recherche Concertée de la Communauté Française” and Pôle d’Attraction Interuniversitaire P4/05 (SSTC, Belgium). We wish to thank the anonymous referee.References
- Binggeli & Cameron (1991) Binggeli, B. & Cameron, L. M.: 1991, A&A 252, 27
- Burud et al. (1998) Burud, I., Courbin, F., Lidman, C., Jaunsen, A. O., Hjorth, J., Ostensen, R., Andersen, M. I., Clasen, J. W., Wucknitz, O., Meylan, G., Magain, P., Stabell, R., & Refsdal, S.: 1998, ApJ 501, L5
- Cerviño & Mas-Hesse (1994) Cerviño, M. & Mas-Hesse, J. M.: 1994, A&A 284, 749
- Charlot et al. (1996) Charlot, S., Worthey, G., & Bressan, A.: 1996, ApJ 457, 625
- Conti & Vacca (1994) Conti, P. S. & Vacca, W. D.: 1994, ApJ 423, L97
- Courbin et al. (1998) Courbin, F., Lidman, C., Frye, B. L., Magain, P., Broadhurst, T. J., Pahre, M. A., & Djorgovski, S. G.: 1998, ApJ 499, L119
- De Vaucouleurs & Aguero (1973) De Vaucouleurs, G. & Aguero, E. L.: 1973, PASP 85, 150
- Doublier et al. (1999) Doublier, V., Caulet, A., & Comte, G.: 1999, .., submitted A&A
- Doublier et al. (1997) Doublier, V., Comte, G., Petrosian, A., Surace, C., & Turatto, M.: 1997, A&AS 124, 405
- Drinkwater & Hardy (1991) Drinkwater, M. & Hardy, E.: 1991, AJ 101, 94
- Fraser (1977) Fraser, C. W.: 1977, A&AS 29, 161
- Hunter & Gallagher (1985) Hunter, D. A. & Gallagher, J. S., I.: 1985, AJ 90, 1457
- Hunter et al. (1994) Hunter, D. A., O’Connell, R. W., & Gallagher, John S., I.: 1994, AJ 108, 84
- Johnson (1966) Johnson, H. L.: 1966, ARA&A 4, 193
- Kormendy (1989) Kormendy, J.: 1989, ApJ 342, L63
- Kunth et al. (1988) Kunth, D., Maurogordato, S., & Vigroux, L.: 1988, A&A 204, 10
- Kunth & Sargent (1983) Kunth, D. & Sargent, W. L. W.: 1983, ApJ 273, 81
- Kunth et al. (1981) Kunth, D., Sargent, W. L. W., & Kowal, C.: 1981, A&AS 44, 229
- Leitherer et al. (1996) Leitherer, C., Vacca, W. D., Conti, P. S., Filippenko, A. V., Robert, C., & Sargent, W. L. W.: 1996, ApJ 465, 717
- Magain et al. (1998) Magain, P., Courbin, F., & Sohy, S.: 1998, ApJ 494, 472
- Marconi et al. (1994) Marconi, G., Matteucci, F., & Tosi, M.: 1994, MNRAS 270, 35
- Meurer et al. (1995) Meurer, G. R., Heckman, T. M., Leitherer, C., Kinney, A., Robert, C., & Garnett, D. R.: 1995, AJ 110, 2665
- O’Connell et al. (1994) O’Connell, R. W., Gallagher, John S., I., & Hunter, D. A.: 1994, ApJ 433, 65
- O’Connell et al. (1995) O’Connell, R. W., Gallagher, John S., I., Hunter, D. A., & Colley, W. N.: 1995, ApJ 446, L1
- Papaderos et al. (1996) Papaderos, P., Loose, H. H., Fricke, K. J., & Thuan, T. X.: 1996, A&A 314, 59
- Phillips et al. (1996) Phillips, A. C., Illingworth, G. D., Mackenty, J. W., & Franx, M.: 1996, AJ 111, 1566
- Saglia et al. (1997) Saglia, R. P., Bertschinger, E., Baggley, G., Burstein, D., Colless, M., Davies, R. L., McMahan, Robert K., J., & Wegner, G.: 1997, ApJS 109, 79
- Telles et al. (1997) Telles, E., Melnick, J., & Terlevich, R.: 1997, MNRAS 288, 78
- Thuan (1983) Thuan, T. X.: 1983, ApJ 268, 667
- Watson et al. (1996) Watson, A. M., Gallagher, J. S., I., Holtzman, J. A., Hester, J. J., Mould, J. R., Ballester, G. E., Burrows, C. J., Casertano, S., Clarke, J. T., Crisp, D., Evans, R., Griffiths, R. E., Hoessel, J. G., Scowen, P. A., Stapelfeldt, K. R., Trauger, J. T., & Westphtptphal, J. A.: 1996, AJ 112, 534