02.13.2; 09.03.2; 09.07.1; 09.10.1; 11.08.1; 13.25.4
D. Breitschwerdt
email: breitsch@mpe.mpg.de 22institutetext: Heisenberg Fellow 33institutetext: Am Beisenkamp 12, D–44866 Bochum, Germany, email: Th.Schmutzler@t-online.de
†deceased
The dynamical signature of the ISM in soft X-rays
Abstract
We present the first dynamically and thermally self-consistent calculations of fast adiabatically expanding gas flows from the Galactic disk into the halo. It is shown that in a hot plasma () with a high overpressure with respect to the ambient medium, the dynamical time scale is much shorter than the intrinsic time scales (e.g. for recombination, collisional excitation and ionization etc.). Therefore dynamical models that use collisional ionization equilibrium (CIE) cooling functions for the evolution of the plasma are in general not correct. In particular, the emission spectra obtained from non-equilibrium calculations are radically different. We describe a method to obtain self-consistent solutions using an iterative procedure. It is demonstrated that soft X-ray background emission between 0.3 and 1.5 keV can be well explained by a superposition of line emission and delayed recombination of an initially hot plasma streaming away from the Galactic disk (outflow and/or winds). In addition to these local winds we also present calculations on global winds from spiral galaxies, which originate from a hot and quiescent galactic corona. We also emphasize that it is dangerous to derive plasma temperatures merely from line ratios of ionized species, such as N v/O vi, unless the dynamical and thermal history of the plasma is known.
keywords:
Magnetohydrodynamics (MHD) – (ISM:) cosmic rays – ISM: general – ISM: jets and outflows – Galaxies: halos – X-rays: ISM1 Introduction
The idea of a hot corona, surrounding our Galaxy and thereby confining infalling H i clouds was postulated more than 40 years ago by Spitzer (1956). With the discovery of the ubiquitous interstellar O vi absorption line (Jenkins & Meloy 1974; York 1974) by the Copernicus satellite, it became plausible that most of the interstellar medium (ISM) was filled by a hot and tenuous gaseous component, the so-called hot intercloud medium (HIM) consisting mainly of interconnected bubbles. Subsequently, McKee and Ostriker (1977) calculated the global mass and energy balance of the ISM, assuming pressure equilibrium between the various phases including the HIM, which was thought to be maintained by the energy input of supernova remnants (SNRs). In their global equilibrium model the hot gas (typical number density and temperature ) was not confined to the molecular gas disk with a scale height of , but would rise into the halo with a typical scale height of .
Moreover, part of the HIM (of order of ) was even thought to be leaving the gravitational potential well of the Galaxy in the form of a Galactic wind (see also Mathews & Baker 1971). However, detailed numerical simulations by Habe & Ikeuchi (1980) showed, that a minimum temperature of was required for a thermal Galactic wind, even when the support of centrifugal forces was included. Therefore, the bulk of the hot gas that is flowing out of the disk into the so-called disk-halo connection or the lower halo, would eventually become thermally unstable due to radiative losses and fall back to the disk, as it was discussed in the “Galactic fountain model” (Shapiro & Field 1976; Bregman 1980; Kahn 1981). For an alternative view, according to which the hot medium remains confined in individual bubbles due to an assumed high (magnetic) pressure of the ambient medium, and much of the energy is dissipated before break-out can occur, see e.g. Cox (1991) and Slavin & Cox (1993). However, as we shall see below, observations show the existence of an extended Galactic corona, emitting in soft X-rays; it is highly improbable that extragalactic infall alone can account for this, and therefore we think that the bulk of hot gas has to be supplied by the disk.
A later version of the fountain model with a somewhat different flavour is the “chimney model” (Ikeuchi 1988; Norman & Ikeuchi 1989), in which the circulation of the gas flow in the lower halo is achieved by channelling the gas through pipes (“chimneys”), which are physically connected to underlying OB-associations. In essence this model represents just a “clustered Galactic fountain”. Again, the total mass loss rate of the Galaxy leads to a loss of only a small fraction of the circulated material, depending on the star formation activity in the Galactic disk. The existence of a Galactic disk-halo outflow in the Perseus arm has been confirmed by recent observations of Normandeau et al. (1996).
It has been pointed out by Johnson & Axford (1971) and later shown by Ipavich (1975) that in principal the dynamic pressure of the high energy component of the ISM, i.e. the cosmic rays (CRs), could assist in driving a galactic wind, provided that a coupling mechanism between CRs and gas exists. It can be shown that the escape of CRs from the Galaxy is accompanied by the resonant generation of small scale MHD waves via the streaming instability (Lerche 1967; Kulsrud & Pearce 1969). Scattering off these waves reduces the particle drift speed to essentially the Alfvén speed and hence leads to a net forward momentum transfer to the gas via the frozen-in waves as a mediator. Models with realistic gravitational potential and geometry (flux tube formalism) for the Galaxy, demonstrate that CR driven winds with a total mass loss rate of order of are likely to occur in the Milky Way (Breitschwerdt et al. 1987, 1991). In this paper we formally distinguish between global winds, that originate from the large-scale expansion of a hot galactic corona, and local winds, which are linked to individual superbubble regions in the disk; in both cases the CRs assist in driving the outflow. It is clear that in reality also intermediate cases will occur.
Due to their SNR origin, outflows and winds should be best detected in the soft Xray regime ( keV). Starting with the pioneering observations of Bowyer et al. (1968), the existence of a diffuse soft X-ray component in the Galaxy has been established. Initially however, it was not clear whether this emission should be attributed to a purely Local Hot Bubble with an average extension of 100 pc (e.g., Tanaka & Bleeker 1977; Sanders et al. 1977), in which the solar is system is embedded, or whether an extended, diffuse halo component would be present as well. The latter was confirmed by the Wisconsin All Sky Survey (McCammon & Sanders 1990, and references therein) and with much higher sensitivity and spatial resolution by the Rosat All Sky Survey (e.g. Freyberg & Schmitt 1998; Wang 1998). The diffuse nature of the emission was demonstrated by so-called shadowing experiments (Snowden et al. 1991; Kerp et al. 1993), which were one of the first deep pointed Rosat observations. Due to the fast optics of the XRT (Trümper 1983) and the high sensitivity of the PSPC instrument, it was found (Snowden et al. 1991) that the X-ray intensity, , of a line of sight passing through the Draco nebula was substantially attenuated. Specifically, a satisfactory fit for the 1/4 keV band count rate was obtained by a simple extinction law, , with and denoting the foreground and the background intensity and the H i absorption cross section, respectively. Accordingly, roughly 50% of the emission is from beyond the Draco cloud; with distance limits between 300–1500 pc, this was clearly outside the Local Hot Bubble, and thus in contradiction with the standard assumption of this model. A more recent account of the 1/4 keV emission and its spatial (both local and halo) distribution is given by Snowden et al. (1998). We shall show here that in particular local winds push highly ionized gas into the halo. This gas cools but remains highly ionized. Its spectral signature is consistent with observations in the Wisconsin Survey and with a Rosat PSPC pointing toward the north Galactic pole .
The first search for diffuse soft X-ray emission in external galaxies was undertaken by Bregman & Glassgold (1982) and led essentially to a negative result. A few years later, a marginal detection of an X-ray halo, associated with the highly inclined spiral galaxy NGC 4631, was reported by Fabbiano & Trinchieri (1987) with the Einstein satellite. More recently, extended diffuse soft X-ray emission of another edge-on spiral galaxy, NGC 891, was detected with Rosat (Bregman & Pildis 1994), with a scale height of , comparable to the scale height of the diffuse -emission (Dettmar 1992). However, owing to its low Galactic latitude, the Galactic foreground absorption is large, and hence the measured count rate was too low to discriminate between different temperatures in the diffuse emission. Carrying out deep Rosat PSPC observations of NGC 4631, Wang et al. (1995) presented spatially separated spectra for the disk and the halo of NGC 4631 in the energy range between 0.15 and 2.0 keV. They found extended, diffuse emission in the 1/4 keV band reaching out to more than 8 kpc above the galactic midplane. There was also evidence for diffuse X-rays in the harder energy band (0.5–2.0 keV) with about half the vertical extension of the 1/4 keV band. From the spectral analysis, using a Raymond & Smith (1977) fit model, Wang et al. (1995) concluded that after correction for foreground H i-absorption, a single temperature fit of the halo emission is incorrect and that at least a two-temperature fit is required. However, these authors emphasized that “… in reality there is probably a continuous temperature distribution in the halo gas.” We expect spiral galaxies like NGC 891 and NGC 4631 to show a similar dynamical and thermal behaviour of their halo plasmas than our Galaxy. NGC 891 is often referred to as a twin galaxy to the Milky Way (cf. Dettmar, 1992), but NGC 4631 is generally considered not to be a typical example for a normal spiral galaxy, because there is strong evidence for a gravitational disturbance in the past by a companion galaxy. However, the important physical process, responsible for an extended halo, is most likely the star formation rate (SFR), which drives an outflow, and which may have been somewhat enhanced in the past. At present the SFRs are the same in these two spiral galaxies within a factor of two; also the scale heights, both for the nonthermal radio halo and the diffuse ionized gas are comparable (cf. Dettmar 1992), thus corroborating our previous arguments. Moreover, more localized outflows have been reported for galaxies with enhanced SFR like M (e.g. Schaaf et al. 1989) and NGC 253 (Vogler & Pietsch 1999; Pietsch et al. 1999) to which our theory also applies.
In an earlier paper (Breitschwerdt & Schmutzler 1994; henceforth Paper I) we have reported on how the soft X-ray background (SXRB) can be successfully modeled by the fast adiabatically expanding plasma in a galactic wind and in the Local Bubble. Here we elaborate on and extend these earlier investigations, showing in detail how the resulting non-equilibrium distribution of highly ionized species evolves in a galactic wind. The plasma in the Local Bubble will be discussed in a separate paper.
In Section 2 we describe in detail how dynamical and thermal evolution of the ISM are intertwined, and how a successful method of a self-consistent treatment works. In Sect. 3, the initial conditions and the physical state of the gas are discussed. Section 4 gives an overview of global and local galactic wind flows and their dynamical and thermal characteristics. Corresponding X-ray spectra are presented in Section 5 as well as implications for the determination of interstellar temperatures from line ratios. In Sect. 6, we discuss and summarize the main results of our investigations.
2 Self-consistent dynamical and thermal evolution of the ISM
Outflows and related dynamical processes have been calculated by numerous authors in different contexts, e.g. outflows from young stellar objects, from stellar wind bubbles, SNRs and from galaxies. Here we specifically refer to disk-halo related outflows like the expansion of superbubbles into a density stratified ambient medium (e.g. Tomisaka 1991), the flow obtained from a Galactic fountain (Bregman 1980; Kahn 1981; Avillez et al., 1998) or, emphasizing superbubbles as the underlying sources, from chimneys (Norman & Ikeuchi 1989). For instance, the work by Wang et al. (1995) and by Tomisaka & Bregman (1993) addresses the dynamics of galactic outflows (winds) and their spectral signatures. However, their approaches assume a simplified treatment of radiative cooling. More specifically, Tomisaka & Bregman (1993) tried to model the widely extended diffuse X-ray emission around M 82. They calculated a thermal galactic wind expanding into a static gas halo using a 2-D hydrodynamical code. However, the radiative cooling term in their calculation is based on the assumption of collisional ionization equilibrium (CIE). It is only for comparison with the observed X-ray spectra that they discuss their hydrodynamical model in terms of time-dependent ionization. Their arguments are mainly based on results of numerical models for young SNRs obtained by Hamilton et al. (1983).
Suchkov et al. (1994) have described in some detail the geometry and structure of galactic superwinds interacting with disk and halo gas. These authors also derive X-ray spectra and argue that the bulk of the soft X-ray emission should originate from the shocked disk and halo material, whereas the shocked wind would emit at significantly higher temperatures. But again these conclusions are based on CIE using a standard Raymond & Smith (1977) cooling function. However, they and other authors obviously didn’t realize the importance of the strong coupling between dynamics, thermal energetics and ionization states. In particular in the case of superwinds, fast adiabatic expansion drives the system rapidly into non-equilibrium as we will show below.
2.1 The basic equations of the dynamics
The dynamics of CR driven galactic winds have been discussed comprehensively by Breitschwerdt et al. (1991). The description of wind flows employing a three fluid model is based on the overall conservation laws of mass, momentum and energy for the thermal plasma, mean magnetic field, CRs and MHD wave field together with the hydrodynamic equivalent of a CR transport, and a wave energy exchange equation.
In their general form these conservation laws can be written as
| (1) |
| (2) |
| (3) |
where , , ℰ denote sources and/or sinks of mass, momentum and energy, respectively, and by an external body force (e.g. gravity) is specified. T is the momentum flux density tensor, the total energy density and the energy flux density for the system as a whole, given by
| (4) |
| (5) |
| (6) | |||||
Here we describe the thermal plasma by its mass density , thermal pressure , velocity and adiabatic index ; we treat the CRs hydrodynamically through their pressure (with being the isotropic part of the particle distribution function in phase space, and and denote the particle speed and momentum, respectively), energy density with (5/3) for ultra-relativistic (non-relativistic) particles, and diffusive energy flux density , where denotes the (Rosseland) mean CR diffusion coefficient. The electromagnetic effects of the mean fields are considered by the Maxwell stresses in Eq. (4) and the Poynting flux vector in Eq. (6), where is the electric and the magnetic field.
and are derived from Maxwell’s equations, which under the assumption of ideal MHD read
| (7) |
and
| (8) |
It is worth noting that the requirement of the magnetic field being free of divergence is contained in Faraday’s law as an initial condition.
The wave field is resonantly generated through a so-called streaming instability (Lerche 1967; Kulrud & Pearce 1969), which arises from a small scale anisotropy in the pitch angle distribution of the CRs due to a spatial pressure gradient of the CRs streaming away from the Galaxy. MHD (or for simplicity Alfvénic) waves satisfying a gyro-resonance condition are most efficiently excited (e.g. McKenzie & Völk 1982). The Alfvén velocity is denoted by and the mean square fluctuating magnetic field amplitude by . The symbols and I are used for the tensor product and the unit tensor, respectively.
The CR transport equation describes the effects of convection and diffusion of CRs in a scattering medium:
| (9) | |||||
where the scatterers (Alfvén waves) move predominantly in the forward direction at the Alfv́en velocity relative to the plasma flow velocity , and may represent energy losses or gains other than those due to adiabatic volume changes and resonant wave generation by the streaming instability.
The wave energy exchange equation describes the effects of the background flow and the CRs on the waves:
| (10) | |||||
where the wave pressure is defined by
| (11) |
and denotes additional wave energy losses or gains. It has been shown for global winds with a total plasma beta that nonsaturated nonlinear Landau damping may dominate the advection of waves in the plasma and hence lead to local dissipative heating (Zirakashvili et al. 1996; Ptuskin et al. 1997). Although in general such a redistribution of energy between the fluid components will change the dynamics and the resulting emission spectra, this effect has not been taken into account in this paper, but will be discussed elsewhere.
The system is closed by the definition of the Alfvén velocity
| (12) |
A more detailed discussion of the equations and their special terms is given in Appendix A of Breitschwerdt et al. (1991) and in Breitschwerdt (1994).
2.2 Simplified model equations for the dynamics
Using the concept of flux tubes with cross section area , where in the following all the variables are taken to be functions of the streamline coordinate only, we now concentrate on the system of dynamical equations which we have to solve for our special models. Here we neglect any source or loss term ( as well as ) other than radiative cooling (ℒ) and heating (𝒢), and assume the case of strong scattering of CRs, i.e. the averaged diffusion coefficient vanishes (). Thus the net energy loss term is given by
| (13) |
The equations of continuity and absence of magnetic monopoles read
| (14) |
and
| (15) |
respectively. The “heat equation” takes the form
| (16) |
and the wave energy exchange and CR transport are described by
| (17) |
| (18) |
Under the above assumptions, two adiabatic integrals can be readily derived. One is the wave action integral and is given by
| (19) |
and the other one results from the CR transport equation:
| (20) |
With the help of the other equations, the momentum equation can be transformed into a “wind equation”
| (21) |
here the “compound sound speed” corresponds to the long wavelength limit obtained from the kinetic equations,
| (22) | |||||
| (23) |
where , and denote the “sound speeds” for gas, CRs and waves, respectively, and describes the effective gravitational acceleration, derived from a mass distribution for the Galaxy, consisting of a bulge, disk and dark matter halo component (see Breitschwerdt et al. 1991). The Alfvén Mach number is defined as .
The dynamics are calculated assuming an ultrarelativistic CR component () and . Although the latter assumption is not consistent with the thermal treatment of the gas where the variation of is implicitly taken into account (cf. Sect. 2.3 and Schmutzler & Tscharnuter 1993), this formal inconsistency is neutralized, because the internal energy of the gas is balanced in the thermal equations and because we iterate each system of equations by using the updated quantities of the other one.
2.3 The thermal processes
We use a net radiative cooling rate which is a complicated function of several physical processes. They depend on gas temperature, gas density, element abundances, ionization states as well as the spectral energy density of external illuminating continuum photons. For the detailed calculations we use the code HOTGAS, which has been described in Schmutzler & Tscharnuter (1993). Here we just summarize the relevant physics in a short list of the processes taken into account and give the references for the atomic data.
The ten most abundant elements H, He, C, N, O, Ne, Mg, Si, S and Fe are considered with cosmic abundances given by Allen (1973). Ionization is driven by collisions with both thermal electrons and neutral atoms (Hollenbach & McKee 1989), as well as by charge exchange and photoionization. Hydrogen and helium can also be ionized by suprathermal electrons. These are produced by high energy photoionization and Auger effect (Shull 1979; Halpern & Grindlay 1980; Binette et al. 1985). We use the rates for thermal ionization including excitation-autoionization and charge exchange given in the excellent compilation of Arnaud & Rothenflug (1985) and the revision for iron according to the paper of Arnaud & Raymond (1992). In addition to charge exchange, which is also a recombination process, we consider both types of direct recombination due to two-body collisions: radiative and dielectronic recombination, where the last one is the inverse process to excitation-autoionization and is considered as a density dependent process (Jordan 1969). In the case of singly ionized atoms the code HOTGAS also takes corrections for three-body recombination into account, which is the inverse process to collisional ionization (Hollenbach & McKee 1989). The radiative recombination coefficients used here include all possible recombinations into excited levels and into the ground level. For hydrogen yet, we apply the “on-the-spot”-approximation (Osterbrock 1974). The coefficients are taken from Tarter (1971), Shull & Van Steenberg (1982a, 1988b), Aldrovandi & Péquignot (1973, 1976), Arnaud & Rothenflug (1985) and Arnaud & Raymond (1992). In addition, we assume that the Lyman continuum photons of recombining helium, the second most abundant element, ionize hydrogen.
The energy input from the external radiation field is taken into account due to the most important interactions of photons with atoms, ions and electrons. The total photoionization cross sections are taken from Reilman & Manson (1978, 1979) and are interpolated as a series of power laws. The required subshell cross sections are derived from the total one. For hydrogen and hydrogen like ions in the 1-s state we use the exact cross section formula (e.g., Vogel 1972). If the photon energies are much higher than the ionization potential, the extrapolated cross sections fall below the Thomson cross section. In these cases we follow the arguments of Halpern & Grindlay (1980) and calculate the Compton ionization cross sections for all ions.
High energy photons may ionize more likely an inner shell than an outer one. If the following reconfiguration of electrons releases a sufficient amount of energy, there is a certain probability of an additional emission of one or more of the outer electrons (Auger effect). We use the probabilities and number of emitted electrons per inner shell ionization worked out by Weisheit (1974).
The net cooling rate is balanced in detail by the appropriate heating terms due to photoionization, Compton ionization, Auger effect and the net energy exchange rate between photons and electrons due to Compton scattering (Levich & Sunyaev 1970, 1971) as well as by the most important radiative energy-losses. We determine the energy-loss due to Coulomb collisions of electrons and ions using the formula of thermal bremsstrahlung (Novikov & Thorne 1973) with the frequency averaged Gaunt factor given by Karzas & Latter (1961). Both types of recombination transform thermal energy into radiative loss. We derived the energy-loss rates from the corresponding volume emissivity given by Cox & Tucker (1969). In case of dielectronic recombination the first excitation energies tabulated in Landini & Fossi (1971) are used. However, the most important energy-loss due to thermal particle interactions results from collisional excitation followed by spontaneous line emission including two-photon continuum emission. Two-photon emission and some special transitions, such as fine structure lines, semiforbidden and forbidden lines have been implemented in a density dependent form (Mewe et al. 1985; Innes 1992). In total we consider 1156 line transitions in the spectral range from 1Å to 610m. The data are based on the work of Kato (1976), Stern et al. (1978), Osterbrock (1963, 1971), Osterbrock & Wallace (1977), Jura & Dalgarno (1972), Penston (1970), Giovarnadi et al. (1987) and Giovarnadi & Palla (1989).
In our calculations only tenuous gases () are considered and therefore neither three body recombination nor the density dependent suppression of some of the thermal processes contribute.
2.4 The equations of a thermally self-consistent approach
The set of equations to be solved consists of energy balance, time dependent state of ionization, charge conservation, and the equation of state. In addition, we have to provide the time variations of the pressure (or density or temperature) at least in a global way. Considering the 10 most abundant elements, the system of equations contains 103 ordinary differential equations together with 14 algebraic relations. We note that an adequate description of a pure hydrogen plasma can be given by 2 ordinary differential equations and 5 algebraic relations. In any case, such a system of non-linear ordinary differential equations is well known to be stiff and therefore requires an implicit method for an efficient solution (Schmutzler & Tscharnuter 1993).
We use the variables gas temperature , pressure , mass density , number of electrons per unit mass , number of ions per unit mass and internal energy per unit mass ; here and denote the nuclear and effective charge of an ion, respectively. The ions and electrons are assumed to have the same Maxwellian temperature, because the equilibrium distribution is typically reached on time scales shorter than recombination or ionization processes or radiative losses do occur.
The equation of energy balance reads:
| (24) |
where is the specific internal energy, defined as
| (25) |
Here gives the ionization potential of an ion with nuclear charge and effective charge . This definition implicitly considers the fact that the commonly used ratio of specific heats is not a constant (c.f. Schmutzler & Tscharnuter 1993). The net radiative cooling rate ℒ – 𝒢, expressed by the cooling function ℒ and a possible heating function 𝒢, represents only that part of the total radiative energy-loss which directly couples to the velocity distribution of the electrons, i.e. the thermal evolution of the gas. It depends on temperature, electron density and ionization states. Moreover, the contribution of an external photon field depends on photon density and energy spectrum.
Ion and electron densities are determined by the ionization and recombination rates, which also depend on temperature, particle densities and external photon field. Thus we have to solve at least 1 (in the case of a pure hydrogen plasma) or 102 (in case of a plasma consisting of the 10 most abundant elements) ordinary differential equations balancing the ionization states of all ions with of the form:
| (26) |
The functions contain all ionization and recombination rates which, due to charge exchange and ionization by collisions of neutral atoms, may also depend on the particle density of other ions . The dependence on possibly interacting photons is indicated by .
The abundances of atoms () are then given by the (1 to) 10 equations, in which also the relative chemical abundances in a gas with changing mass density are specified:
| (27) |
where denotes a normalized mean mass for a given chemical composition.
Charge conservation determines the electron density:
| (28) |
Pressure, temperature and mass density are tied into the equation of state by:
| (29) |
In order to take into account the dynamics in a global way, we have to fix one additional relation, for example, the time variation of the density (or pressure or temperature) according to the time scales of the dynamical behaviour of the gas:
| (30) |
A coupling between both systems of equations can be achieved by Eq. (30) on the thermal, and by the net radiative cooling term in Eq. (24) on the dynamical side. Although the dynamical equations in the stationary case do not contain an explicit time scale one can easily find the flow time
| (31) |
which allows to transform the dynamically determined density into a time-dependent function as input for Eq. (30). The solution of the thermal equations by Newton-Raphson iteration provides the net radiative cooling term as function of or (and) . By using this solution as an input for the dynamical equations, a new time-dependent density can be found. Since as well as are determined in a discrete form and each system of equations defines its appropriate step widths, we use taut cubic splines for interpolation. The complete procedure, which is shown in the form of a flow chart in Fig. 1, has to be iterated until the temperatures of each system, and , converge. The comparison of the two temperatures provides a good convergence check, because temperature is not used as a primary variable, and it is calculated independently in each system of equations. Typically one needs 3–4 iterations to find an excellent agreement between both temperatures. The deviations are found to be less than 0.5% for distances between the base of the flux tube and the critical point, and they are less than 3% at distances greater than 10 times that of the critical point.
The self-consistent solution describes the time-dependent (here this is equivalent to space-dependent) state of the gas in a volume element flowing along the flux tube. As a consequence of stationary wind models the state of the gas varies as a function of distance but it is constant at any given position.
3 The initial state of the gas
The time-dependent evolution of a gas depends not only on the thermodynamic path but also on the state of the gas at a given time, the initial state. The gas state is determined by the temperature, the density, the chemical composition and the ionization states of the elements. In most cases the initial state of the gas is unknown. Nevertheless, it should be possible to constrain the range of initial values by comparing observational results with those of calculated evolutions, if the latter ones are based on physically plausible assumptions.
The new generations of EUV and X-ray spectrometers, starting with EUVE, ASCA, AXAF and most importantly XMM, provide increasing resolution in energy and position. Thus, from a physical point of view, we expect the detection of many spectral features, which can only be understood within the framework of time-dependent models of the HIM, like the ones we present here. Of course, the appropriate analysis of these observations takes much more effort than the standard analysis of today, but we gain the chance of looking back in time and learning more about the “history” of the gas than by any fit with standard equilibrium models.
3.1 Initial ionization states
For galactic winds, driven by thermal gas and CRs, originating in SNRs or superbubbles, one may distinguish three major cases concerning the initial ionization states. The first one is the assumption of a gas just departing from collisional ionization equilibrium (CIE) or from an ionization state close to that. In CIE the ionization states are determined by the assumed initial temperature. Slight modifications are produced, for instance, by photoionization due to a locally acting photon field (e. g. the averaged stellar and extragalactic photon field). Ionization states close to CIE may be realized, if and the gas is kept at comparable temperatures for a time longer than the relevant recombination time scales.
Here we note that CIE in general is a bad approximation of the thermal state of plasmas with cosmic abundances for . Only plasmas with very low metallicities may approximately reach CIE, since then the radiative cooling time is longer than the recombination time scales. Although heating processes reduce the net cooling time as well, they directly affect the ionization stages. Thus the plasma may approach ionization equilibrium, but still differ from CIE.
The second case concerning the initial ionization states can be understood as follows: shock heated gas in SNRs may reach temperatures between and . However, it is known that the life time of a single SNR may not be long enough for the heated gas ever reaching CIE. If energy between ions and electrons is transferred mainly by Coulomb collisions, the electrons would come into equilibrium with the ions on a time scale of the order of (cf. Itoh 1978, Cox & Anderson 1982); here is the hydrodynamic energy released in a SN explosion, and is the number density of the ambient medium. Other collisional processes would operate on even longer time scales. This would only be significantly reduced, if heat conduction would be large (which is unlikely due to suppression by magnetic fields) or plasma instabilities would redistribute the energy more efficiently. In the case of non-equilibrium, a (local) galactic wind, fed from such sources, starts with “underionized” gas (with respect to the ionization states given by CIE at that temperature), in which hydrogen already may be fully ionized, whereas the ionization of the heavier elements may have reached only the (energetically) lowest or at most intermediate levels.
The third case is described by an “overionized” gas. It can be produced, for instance, by photoionization of gas in the neighbourhood of strong continuum sources, like X-ray binaries or an active galactic nucleus. Another possibility is fast adiabatic cooling of hot (), almost completely ionized gas expanding out of a superbubble. Because of recombination delay the cooled gas of several or consists of many more highly ionized species than a gas in CIE at these temperatures.
In this paper we concentrate on the first case. The other two cases are the subjects of further investigations.
3.2 Initial density and temperature
The particle density of the HIM is assumed to range from to . The most plausible interval for the initial temperature of gas fed into a galactic wind ranges from a few times to a few times . Both intervals, for temperature and density, cover those values derived from pressure equilibrium arguments in models of the ISM (e.g., McKee & Ostriker 1977). However, we are interested in dynamical processes in the ISM, which require various phases of the ISM being not in pressure equilibrium, at least in a local part. One finds that particle densities and temperatures in the given range provide a sufficient pressure to initiate a break-out of the Galactic disk.
The more moderate values of density and temperature may be typical for HIM distributed nearly uniform over the Galactic disk. As has been discussed by Breitschwerdt et al. (1987, 1991) CRs are able to couple to the thermal gas and to drive a galactic wind. According to the global distribution of both, moderate HIM and CRs, we expect global galactic winds.
The sources of the HIM, stellar wind bubbles, SNRs and superbubbles, produce gas at somewhat higher temperatures. At least in the vicinity of these sources the gas density and temperature reach values which are sufficient for a thermally driven break-out and wind. An extreme example of thermal winds is observed in M (e.g. Schaaf et al. 1989).
Thus, as long as star formation is important for the evolution of the ISM, we expect not only global galactic winds but also local winds to occur. The latter ones may start as thermally driven flows and proceed further out by the interaction with CRs. In Sect. 4 we present models for both types of galactic winds.
3.3 The chemical composition
The chemical composition of the gas in the Galactic plane is expected to be a function of position. For local Galactic winds one may expect higher abundances than solar, because of the enrichment by supernovae (SNe). However, it is unclear to what extent entrainment of ambient gas dilutes the mixture, as it is suggested by some ASCA observations (Ptak et al. 1997). In order to demonstrate the differences between self-consistent calculations and those in which the thermal processes just follow the dynamical time scale, we assume solar abundances for the models in this paper. The analysis of future observations with high spectral resolution based on thermally and dynamically self-consistent models will help to determine the chemical abundances in our Galaxy as well as in other galaxies.
3.4 The initial state of the nonthermal components of the ISM
Among the nonthermal ISM components the CRs are the primary driving agents of a galactic wind in spiral galaxies. The waves are largely self-excited by the CR streaming, and the magnetic field, , is treated statically here; for the dynamical rôle of we refer to Zirakashvili et al. (1996). The bulk of CRs below about is most likely of Galactic origin and are believed to be generated by diffusive shock acceleration with an efficiency of up to 50% of the available hydrodynamic SN energy (Berezhko & Völk 1997). CRs propagate diffusively through the ISM and their propagation is largely determined by collective effects. Treating them as a high energy gas is a short-cut that ignores the complicated dynamics resulting from the solution of a Fokker-Planck type transport equation. The energy density of the CRs is known from in situ measurements to be about about (s. Völk et al. 1989). Since CRs also fill the Galactic halo, and a particle reaching the solar system has spent considerable time out there, a value of this order should be representative for global winds. In the vicinity of SNRs and superbubbles, a higher value is possible. However, in order to be conservative, our initial value of the CR pressure, , is a factor of 3 below the locally measured for global winds and only a factor of 2–3 higher for local winds.
In the solar neighbourhood, energy equipartition between CRs and the magnetic field is roughly fulfilled. In our flux tube geometry, we describe the vertical component of and have therefore assumed a magnitude which is a factor of 2–5 smaller than the average disk value of . Since the wave field is predominantly generated by the CR streaming, we have assumed a negligible initial value of of 1% of the regular magnetic field energy density.
4 X-ray emission from galactic winds
The discussion in the previous sections has emphasized the necessity to critically examine the dynamical and thermal history of the ISM, if one wishes to interpret observations. Although in some circumstances the convenient assumption of CIE may be not too far off from the real situation, there is always a possibility that in general such an approach will be entirely misleading. Clearly, further and independent information is needed. For example a measurement of line widths, if possible, would give an upper limit for the temperature. However, in most cases, all that is available is an energy spectrum in a certain wave length range. Then, only a careful analysis of the physical state of the observed region and a determination of its dynamical and thermal properties will lead to a trustworthy interpretation. In the following, we shall demonstrate how the dynamical state of the ISM will change its spectral appearance in the EUV and X-ray wavebands.
Galactic winds can be crudely divided into two classes: global and local winds. The winds that have been described in the literature were mostly global winds, arising from a global hot ISM, which cannot be trapped in the galactic potential well. The pressure forces that cause the gas to escape from a galaxy may simply be due to random thermal motions (e.g. Mathews & Baker 1971), also including centrifugal forces due to galactic rotation (Habe & Ikeuchi 1980), or they can also be supported by the nonthermal energy content of the CRs (e.g. Breitschwerdt et al. 1987, 1991; Fichtner et al. 1991). A recent model by Zirakashvili et al. (1996) also takes into account the dynamical effects of magnetic stresses caused by a wound-up Parker type galactic magnetic field.
Star formation of massive hot stars takes place predominantly in OB associations. Since these stars evolve within less than years, SNRs and hypersonic stellar winds create a superbubble with a large overpressure compared to the average ISM. There is no way that such a region can be confined, e.g. by a global interstellar magnetic field, as it is assumed in some models (Edgar & Cox 1993). Instead, an upward expansion of gas and CRs will lead to elongated bubbles and chimneys. Some numerical simulations of superbubble expansion argue in favour of confinement within the thick extended H i and/or H ii-layer of the Galaxy (Tomisaka 1991; Mineshige et al. 1993), because of a magnetic field which is parallel to the shock surface. Therefore, depending on the magnitude of the field, magnetic tension can in principle considerably decelerate the flow, so that it will eventually stall before break-out. However, such an idealized field configuration is unrealistic, because the Parker instability (both linear and nonlinear) will break up the field into a substantial component parallel to the flow (Kamaya et al. 1996). The presence of CRs and magnetic fields in galactic halos is well known by the observation of synchrotron radiation generated by the electronic component (e.g. reviews by Beck et al. 1996). In our view, the combined overpressure of thermal gas and CRs will therefore eventually drive a local mass outflow with a comparatively high speed, which is causally connected to one or more underlying superbubble regions. The mass that is transferred to the lower halo, however, exceeds the mass that is ultimately driven out to infinity, depending on the total thermal and CR energy available. Therefore a substantial fraction of the gas is expected to fall back onto the disk in a fountain or chimney type fashion. The interaction with uprising gas will create shear and thus add to the turbulence in the halo. We note parenthetically, that such a process will support any operating turbulent halo dynamo.
The extreme case of star formation is realized in so-called starburst galaxies like M 82 or NGC 253, which are the most prominent and best studied examples. Conceptually, this just represents an extrapolation of local galactic winds to a region with enhanced star formation rate (SFR), according to the observed high far-infrared luminosities (Rieke et al. 1980). In M 82, radio observations (Kronberg et al. 1985) show an emission region extending to about 600 pc along the major axis and about 100 pc in vertical direction, consistent with a SN rate of . This inevitably leads to a thermally driven galactic wind (Chevalier & Clegg 1985), which has been directly observed in the form of an extended X-ray halo both with Einstein (Fabbiano 1988) and Exosat (Schaaf et al. 1989). Moreover, from the extension of the observed radio continuum halo, it is inferred that the relativistic electrons must be advected by a galactic wind with an average speed between 2000 km/s (Seaquist et al. 1985) and 4000 km/s (Völk et al. 1989), in order to compensate for heavy synchrotron and Inverse-Compton losses. There is further support for this interpretation from multifrequency radio observations, which reveal a fairly flat spectral index (Seaquist & Odegard 1991). Model calculations have shown (Breitschwerdt 1994), that such a behaviour is naturally explained by an accelerating galactic wind flow, that compensates for losses increasing with vertical distance from the disk in a constant halo magnetic field. In NGC 253 Rosat PSPC and HRI observations have shown (Pietsch et al. 1999) both a nuclear and an extranuclear outflow. It is interesting to note that the latter one, which is most prominent in an X-ray spur in the southern hemisphere, is causally connected to a region of increased star formation in the disk as seen in H (M. Ehle, private communication).
In the following we discuss the spectral signature in the soft X-rays of various dynamically and thermally self-consistent galactic wind flows.
4.1 Global winds from spiral galaxies (slow winds)
As far as the general properties of global winds are concerned we refer to the parameter studies for adiabatic flows performed by Breitschwerdt et al. (1991). Here we concentrate on the effect of cooling and the spectral characteristics of such outflows.
First of all we note that radiative cooling is relevant for global winds. An estimate of the cooling time gives yrs, using the isochoric cooling function for an initial gas temperature of K (Schmutzler & Tscharnuter 1993) and a gas density of . This value has to be compared to the flow time scale , where the integration runs from the inner boundary near the disk (reference level ) to the critical point , because at distances , the stationary flow is causally disconnected from the boundary conditions. For values labeled as reference model in Breitschwerdt et al. (1991) and here denoted as model M1 (, , , and , corresponding to a negligible wave pressure ), we find from the numerical calculations . We note that this time scale is an order of magnitude larger than the average superbubble lifetime. Therefore global galactic winds should be energetically sustained by a large ensemble of disk superbubbles rather than by individual star forming regions, as it is the case for local winds.
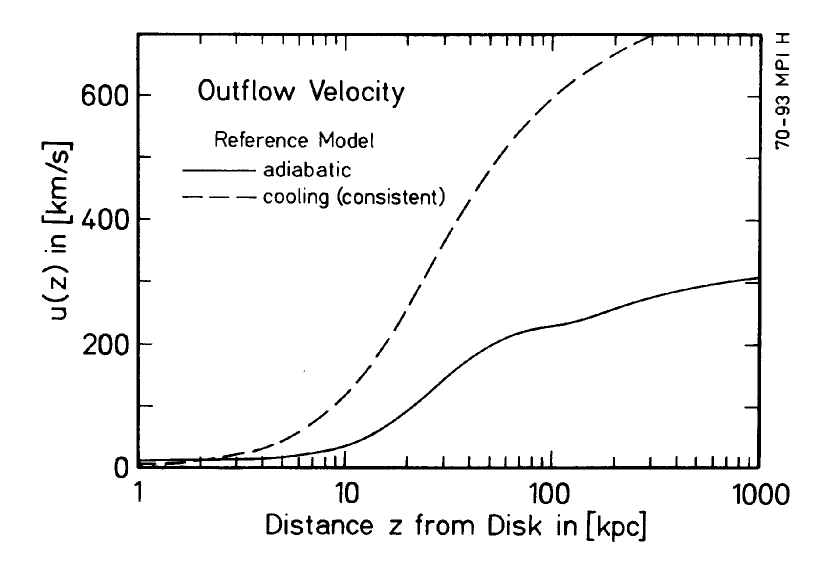
In the following we discuss the major results of our numerical simulations. The effect of adiabatic and radiative cooling can be studied most directly by comparing the respective temperature profiles (see Fig. 2).

In the adiabatic model, cooling by -work becomes noticeable only at distances from the disk. Up to the temperature is roughly a power law with index and at even larger distances increasing to . The latter value is close to the expected value of , because far out in the halo the wind velocity is close to its asymptotic value, and according to Eq. (14), . In an adiabatically expanding flow, , for .
Including radiative cooling, we find that already at , there is a sharp decrease in temperature from to almost within one kiloparsec. The reason for this behaviour lies in the low initial flow velocity of around 10 km/s, which leads to a flow time of about . The corresponding isochoric cooling time scale for a gas at is for and . Since the density has decreased by only 26% up to , the isochoric cooling function is not too bad an approximation.
It is worth pointing out, that due to recombination, the degree of ionization, defined as
| (32) |
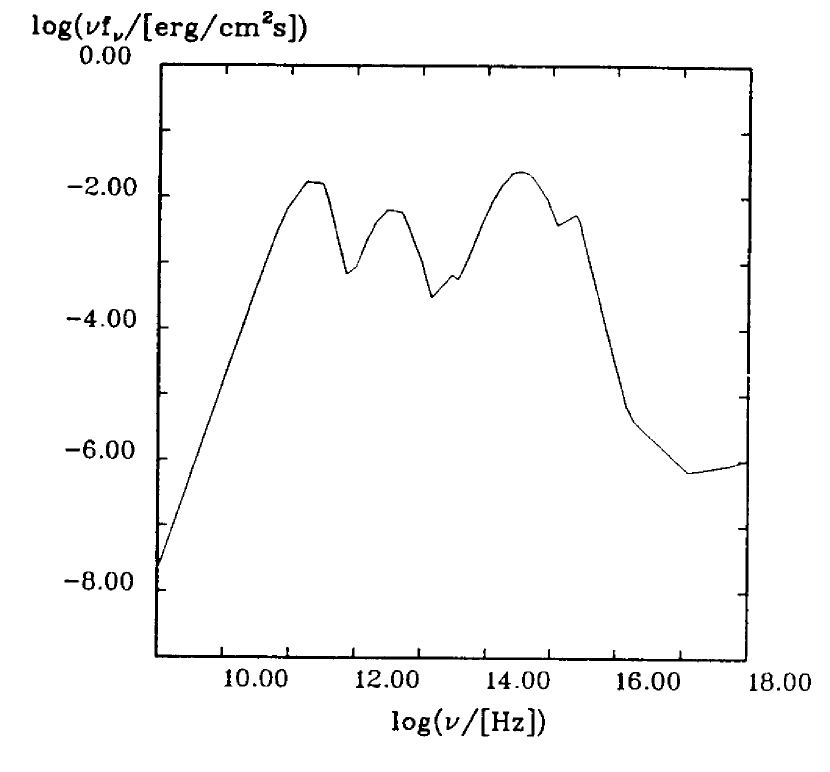
where denotes a times ionized atom (not to be confused with the distance variable ) with nuclear charge , drops from 1.0 to 0.9 at a distance of 3 kpc already. The corresponding amount of neutrals is then sufficiently large to damp away the self-excited waves by ion-neutral damping (Kulsrud & Pearce 1969). Near the sonic point of the flow, we have . This would lead to a redistribution of energy from the CRs to the thermal plasma with subsequent losses due to radiative cooling. However, it is has been argued (Breitschwerdt et al. 1991), that a diffuse radiation field from stars in the Galactic disk and also from extragalactic sources (AGNs, quasars, etc.) could provide the necessary photoionization in order to keep the halo fully ionized. We have used the data collected by Black (1987) and Dorfi (1992) and have closed the UV gap by spline interpolation, resulting from absorption in the Galactic disk, by a power law. The form of the spectrum is shown in Fig. 3.
The diffuse photon field acts also as a heat source , which has to be incorporated along with the cooling function in a self-consistent fashion, as it is shown below. It is included in the following calculations under the assumption that its spectral energy flux is independent of the vertical distance from the disk. This seems reasonable because the disk acts as an extended radiating surface, and therefore the energy flux remains constant for distances comparable to the diameter of the galaxy, and the extragalactic contribution is constant everywhere. It turns out, that is always sufficiently close to unity in order to suppress linear wave damping. However the energy input by photoionization cannot compensate for the heavy radiative losses between 1 and 3 kpc. The photon field gains influence at lower densities and is able to compensate for radiative but not for adiabatic losses. This analysis clearly shows the necessity for performing dynamically and thermally self-consistent calculations along the lines described in Section 2. The variables, which we use for iteration are the dynamical and the thermal temperature, and , respectively, as has been discussed in Sect. 2.4.
In the following we will present our results. The reduced initial velocity of the flow (), and hence a correspondingly reduced mass loss rate by a factor of 2.5 (see Fig. 4), gives rise to a substantial acceleration, and higher velocities at large distances from the Galactic plane. This fact can be attributed to the very large scale height of the CRs, which are unaffected by radiative cooling. Therefore their energy density (together with the wave energy density) leads to a significant acceleration of the reduced wind mass further out in the flow. With increasing flow velocity, adiabatic cooling dominates and the slopes of the temperature curves (adiabatic versus radiative cooling) in Fig. 5 and Fig. 6 are similar.

The new temperature profile as a function of distance from the disk is shown in Fig. 6.

As a result of the low initial velocity, the flow time becomes rather large and therefore radiative cooling close to the inner boundary is very efficient. From Fig. 6 we infer that already at , line cooling dominates and the temperature drops from the initial value of by more than one order of magnitude within the next kiloparsec. Therefore the resulting self-consistent temperature profile is much closer to an isochorically than to an adiabatically cooling gas. When the temperature is as low as only a few K, adiabatic cooling dominates line cooling.
4.2 Local winds from spiral galaxies (fast winds)
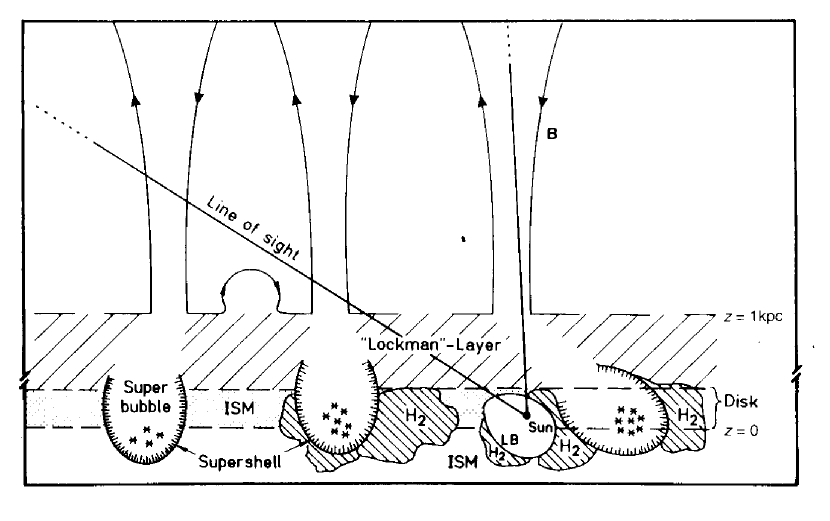
Observationally, the concept of local winds is supported by large scale filaments () protruding out into the galactic halo, as it is the case for a number of inclined spiral galaxies, like NGC 891, NGC 5775 and also the Milky Way (Dettmar 1992). The observation of vertical dust lanes may be interpreted as the dense walls of chimneys sticking out of the Galactic disk (Sofue 1991; Sofue et al., 1991). The analysis of the H i distribution in galaxies reveals the existence of supershells (Heiles 1979; 1984) as in our Galaxy, or distinct holes in H i like in M31 (Brinks & Shane 1984). Assuming that H i and hot gas are anticorrelated in the ISM on large scales, since the latter displaces the former, these findings suggest the existence of superbubbles with typical diameters between 100 and 1000 pc and a time integrated energy content of –. We have argued earlier, that these superbubbles are susceptible to break-out of the disk, most likely where the surface density is lowest, and thus feed the halo. It is therefore possible, that a flux tube in the direction of the north Galactic pole may have also been created by a nearby superbubble. In Fig. 7 we have sketched a plausible situation for our Galaxy, which we assume to be typical for other spirals as well, if observed edge-on.
Considering the huge amount of energy stored in superbubbles, which is mainly in thermal, kinetic and CR energy, it is clear, that the boundary conditions for localized outflows must be quite different from the global outflows discussed earlier.
As a typical example, we have chosen the following input values for the dynamical model (M2): , initial temperature , CR pressure , regular vertical magnetic field component and a fluctuating magnetic field of . The halo plasma consists of the 10 most abundant elements (cf. Section 2.3) with solar metallicity. As discussed earlier, we have assumed that the gas is in CIE, because of the high initial temperature due to SN heating. However, as we have already pointed out, below this assumption is no longer justified. In Fig. 8 the resulting velocity profiles of dynamically and thermally self-consistent solutions are shown.
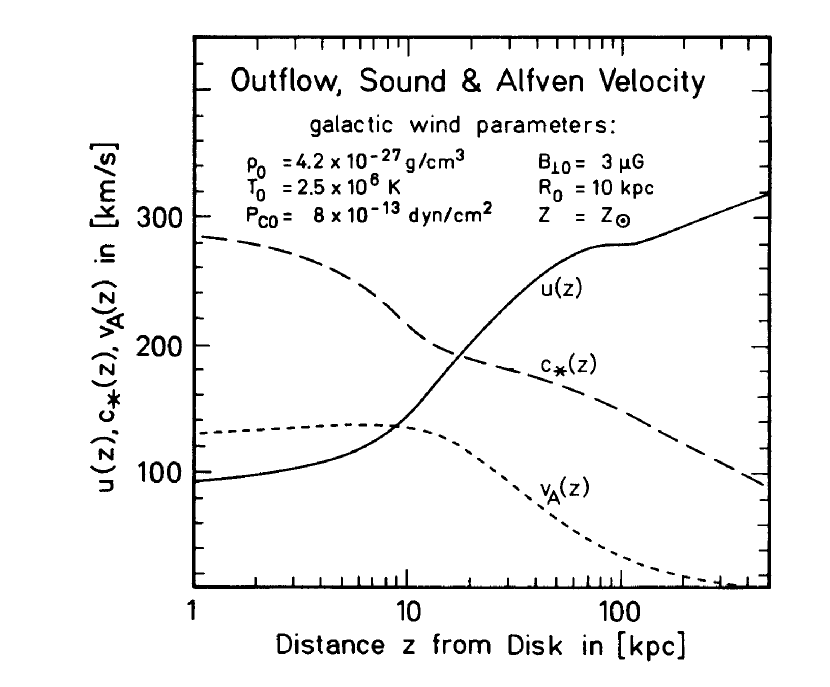
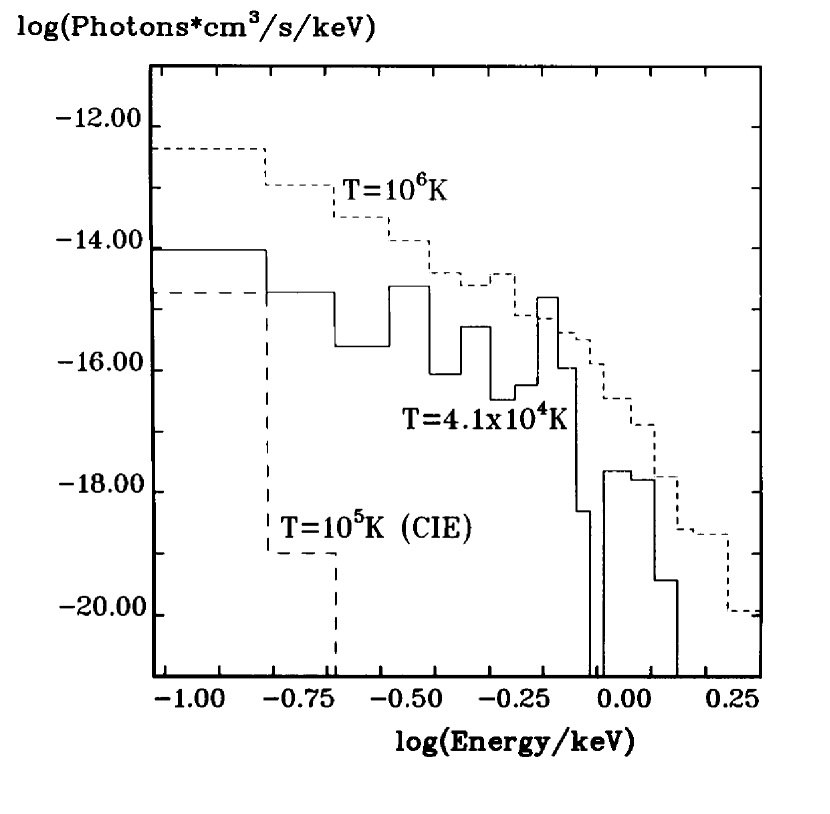
The initial velocity of the convergent solution, is a factor of more than 25 above that for a global wind. The sonic point of the flow is located at , a factor of 2 closer to the disk than in the global wind case, which is simply because of the higher energy input into the flow and the higher acceleration. The mass loss rate is . The crucial point is now, that despite a decrease in temperature by about two orders of magnitude out to due to fast adiabatic and some radiative cooling, many of the initial high ionization stages remain unchanged. Delayed recombination of these stages leads to X-ray emission predominantly in the so-called M-band (0.5–1.1 keV). This can be directly seen from Fig. 9, where we have shown the intrinsic spectra at different temperatures, corresponding to different distances in the flow. While the spectrum at is still similar to the initial spectrum at in CIE, the spectrum at does not change dramatically and still looks more like the spectrum than a corresponding CIE spectrum. In fact, a CIE plasma at would hardly emit any X-rays, simply because the kinetic temperature of the electrons for the excitation of inner levels would be too low. A spectrum at this temperature would be barely visible in this representation. For comparison, we have therefore plotted a CIE spectrum. The spectral difference of equilibrium vs. non-equilibrium emission of an optically thin plasma is indeed striking.
The major contributors of the highly ionized species to delayed recombination can be seen in Fig. 10, which shows a high resolution spectrum at .
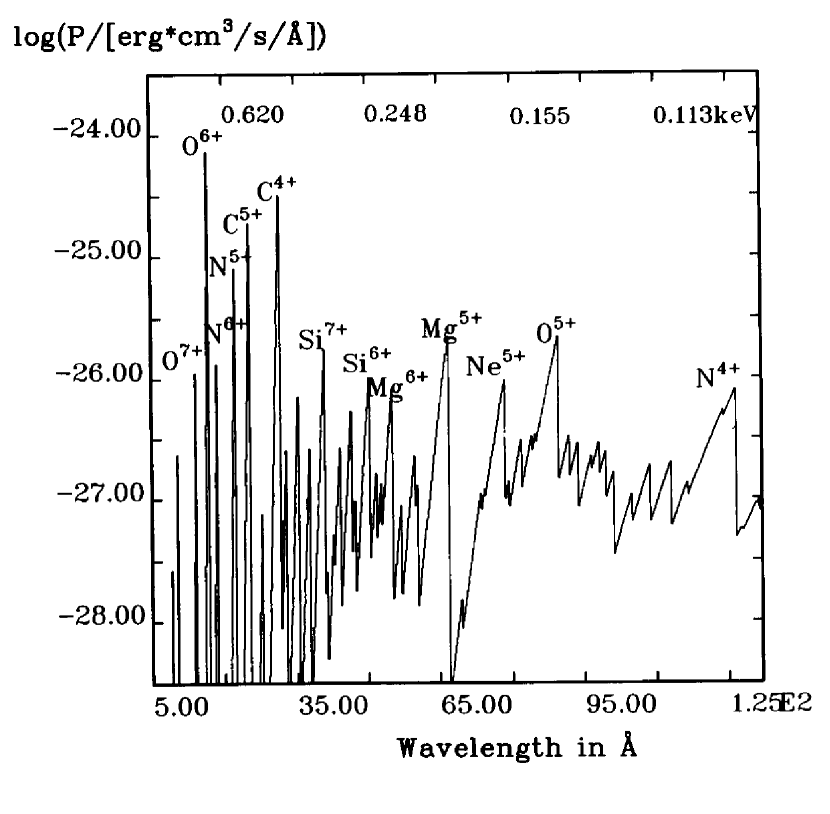
In this representation the recombination edges and the exponential decrease towards shorter wavelenghts become apparent.
In order to compare these calculations with observations of the soft X-ray background (SXRB), we need to integrate the local emission spectra along a line of sight weighted by the local density and include interstellar absorption.
5 Comparison and implications for observations
5.1 Contribution to the soft X-ray background
The observational data of the soft X-ray background obtained by the Wisconsin survey and the Rosat All-Sky Survey have been extensively reviewed, e.g. by McCammon & Sanders (1990) and Snowden (1996), respectively. The most important features to explain are:
-
1/4 keV band (C-band):
-
–
an increase in flux with Galactic latitude by a factor of 2–3
-
–
a distinct anticorrelation with H i
-
–
approximate constancy of the Be (77–) to B (130–) band ratio with increasing count rate, where a column density of represents unity optical depth for the Be-band
-
–
more than 50% of the flux in certain directions originates beyond 400 pc as inferred from Rosat PSPC shadowing experiments; for a recent discussion we refer to Snoweden et al. (1998)
-
–
-
0.5–1.1 keV band (M-band):
-
–
the emission is fairly isotropic in latitude and longitude (slight enhancement towards the Galactic center), if bright individual sources (such as the Cygnus superbubble, Eridanus cavity, Loop I etc.) are subtracted.
-
–
Before interpreting these results, one should be aware that unity optical depth at 1/4 keV corresponds to an H i column density of and at 0.5 keV to . Taking an average interstellar density of , the mean free path of a C-band photon is 100 pc and of an M-band photon is around 1 kpc.
Therefore for both energy bands, a purely extragalactic origin is ruled out regarding the observed emission in the Galactic plane. The pre-Rosat explanation that the C-band flux is entirely due to the thermal emission of a local hot () gas, displacing the H i (“displacement” model; Sanders et al. 1977; Snowden et al. 1990) and filling homogeneously a cavity of about 100 pc in radius, has been clearly ruled out by the so-called shadowing experiments. For example Herbstmeier et al. (1995) studied the shadows cast by the high latitude Complex M of high velocity clouds, which is at a distance of at least 1.5 kpc. They conclude, that 1/4 keV band emission also originates in a Galactic corona which extends up to several kiloparsecs from the plane except for some regions, where it could be less. Clearly, a successful model must be capable of explaining ultrasoft X-ray emission from beyond the Local Bubble, i.e. from the Galactic halo. Whereas the 1/4 keV diffuse X-ray emission is almost entirely thermal in origin, there is a contribution of about 60% (Wang & McCray 1993) to the 3/4 keV band from extragalactic point sources. Galactic point sources could also provide up to 15% of the flux (Schmitt & Snowden 1990). On the other hand there must be a contribution from the Galactic plane and the halo in order to explain the observed isotropy.
There is no doubt that the presence of the ultrasoft X-ray bands argues for a local contribution to the SXRB from the Local Bubble. It is also possible that even a small fraction of the emission in the M-band is of local origin (Sanders 1993). What is needed in order to substantiate these statements are shadowing experiments towards high column density regions inside the Local Bubble, such as the MBM clouds. However there are not many suitable targets (like e.g. MBM12 and MBM16; Magnani et al. 1985, 1996; Hobbs et al. 1988) that fulfill this requirement (Kuntz et al. 1997). We have shown (Paper I) that fast adiabatic cooling of an expanding Local Bubble can produce emission in these energy bands by delayed recombination of highly ionized species. Thus the problem of isotropy becomes less severe. Future XMM observations will help to clarify the contribution of M-band emission within the Local Bubble. The absolute M-band value in our models depends of course on the initial conditions, in particular on the initial temperature . The resulting lower temperature in the bubble at the present stage of evolution could explain the deficiency of EUV line emission, that was reported from observations with the EUVE satellite (Jelinsky et al. 1995). This deficiency also is one of the results of our model of the Local Bubble (Paper I) and we have presented a theoretical EUV spectrum in Schmutzler & Breitschwerdt (1996). For further results and discussion we refer the reader to Breitschwerdt (1996) and Breitschwerdt et al. (1996) and to a forthcoming paper, in which more details concerning the Local Bubble are addressed.
Here we will focus on the contribution to the soft X-ray background by the Galactic halo. In the following we discuss the spectral properties of diffuse X-ray emission in the direction of the north Galactic pole. To that end we have performed dynamically and thermally self-consistent calculations of a local outflow using the boundary conditions described in the previous section (cf. also Fig. 8) and subsequently integrated the local emission spectra along the line of sight. Note that in a Raymond & Smith emission model, the halo spectrum would be described by a single temperature, whereas we have a “multi-temperature” plasma in which the emission is in addition out of equilibrium at each kinetic temperature.
Let us briefly examine the power radiated away in X-rays. There has been criticism (Cox 1998) that the non-equilibrium emission from the Galactic halo as a result of an outflow (fountain or wind) would be insignificant in comparison to the bulk of X-rays coming from the disk-halo interface, which is in CIE. The line of argument is as follows. Recombination continuum is mainly due to heavy ions which have an abundance of relative to hydrogen. Each recombination gives an energy loss of . Taking a mass loss rate of averaged over the whole disk, gives corresponding to an energy loss rate of . Both sides of the Galactic disk contribute an energy flux of , which is of the order of a percent of the total measured energy flux from the SXRB.
However, there are two major objections against these arguments. Firstly, the mass loss rate of is a global value, averaged over the whole disk. It could in general easily be larger by a factor of 10 or so for a local outflow with a large overpressure. Secondly and more importantly, for a given initial temperature we have roughly of thermal energy; part of it is used for fast adiabatic expansion and another part for line cooling of collisionally excited lines. The crucial difference between quasi CIE models and the non-equilibrium emission model is that due to the expansion of the wind, the temperature is a function of time or distance from the disk (in a steady state). Thus the line cooling which produces a significant contribution at lower heights cannot be described by a Raymond & Smith model, because line cooling occurs at “different temperatures” as a function of distance from the plane; moreover, the emerging spectrum cannot be modeled by a superposition of a series of Raymond & Smith spectra at different temperatures. Even if the wind starts with a gas described by CIE, the ionization states differ more and more from those of CIE models with increasing distance from the disk.
Another way to look at it is the following. In the above argument by Cox it is assumed that recombination takes place instantaneously, or on a time scale comparable to that of the mass loss. However, at least for local winds this is definitely not the case. Our calculations show that recombination occurs very slowly if compared to the dynamical time scale, which means that upon integration along a line of sight we have to consider a time scale of about years, which corresponds to a vertical distance of the flow of 25 kpc from the disk. Therefore we see a larger amount of mass (of ions “frozen” into their ionization stages) recombining than the mass loss rate would indicate. This happens at the expense of a lower recombination rate at the beginning when the flow is set up. In a steady state model this requires that the flux tube must have reached a certain height above the disk, before delayed recombination becomes a significant contributor to the soft X-ray emission.
Note that in the model discussed here, at the initial velocity is quite significant. Moreover, the density as a function of is different from a CIE model, corresponding also to a relation for . The situation is different for the Local Bubble: here we observe a snapshot at time , i.e. at present, and do not integrate through the “historical path” of the plasma. Therefore, in this case the observed spectrum is entirely dominated by recombination continuum (Paper I).
In the calculations here, we have assumed that the flux tube lies within the opening angle of the Rosat PSPC. Attenuation of the X-ray flux by the Local Cloud () and/or the extended H i layer (“Lockman” layer; ) has been taken into account (Fig. 11). Our results show, that in the lower part of the halo, the spectrum is dominated by line emission. Once the temperature has fallen below , delayed recombination continuum becomes increasingly important, in particular in the M-band. We have found that volume elements up to a vertical distance of about 25 kpc contribute to the X-ray flux, as can be seen from the approximate constancy of the emissivity with decreasing temperature in Fig. 9 in this energy range. Further, our numerical simulations show that the density decreases as for . Let be the increment along the axis of the emission cone, which has the volume . The observable flux from the emitting volume is then given by , for .
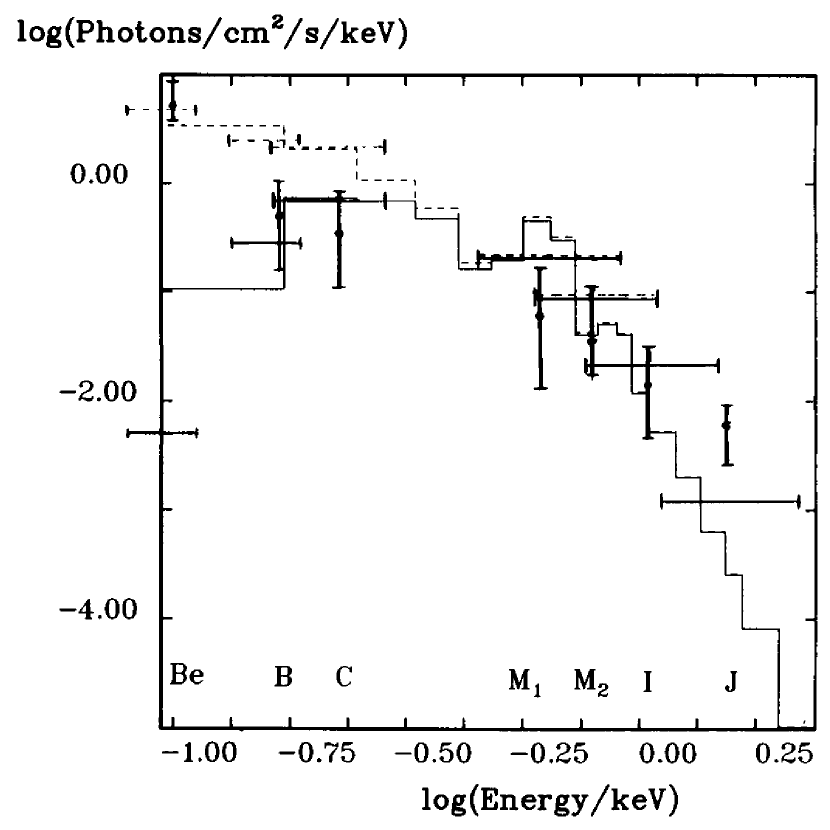
The calculated overall spectral distribution shows a remarkable quantitative agreement with the Wisconsin survey in the I-band, the M-band, the C-band and even the B-band. However it is clear, that most of the observed flux in the ultrasoft bands must be of local origin. We note that the model presented here is capable of reproducing the total observed flux in the various energy bands. This is of course unrealistic, because as we have already mentioned, there will be contributions from other sources. However, as long as it is not clear, what the fraction of emission by these sources is, we do not consider it appropriate to present a complex and detailed multicomponent model. But we note that our model is conservative, because there is no problem in explaining a reduced flux by simply relaxing the boundary conditions. In addition, the form of the spectrum of the Galactic wind and the Local Bubble is not vastly different, so that we need more detailed spectral information in order to disentangle both contributions. Deep pointed observations by XMM might just be able to provide such data.
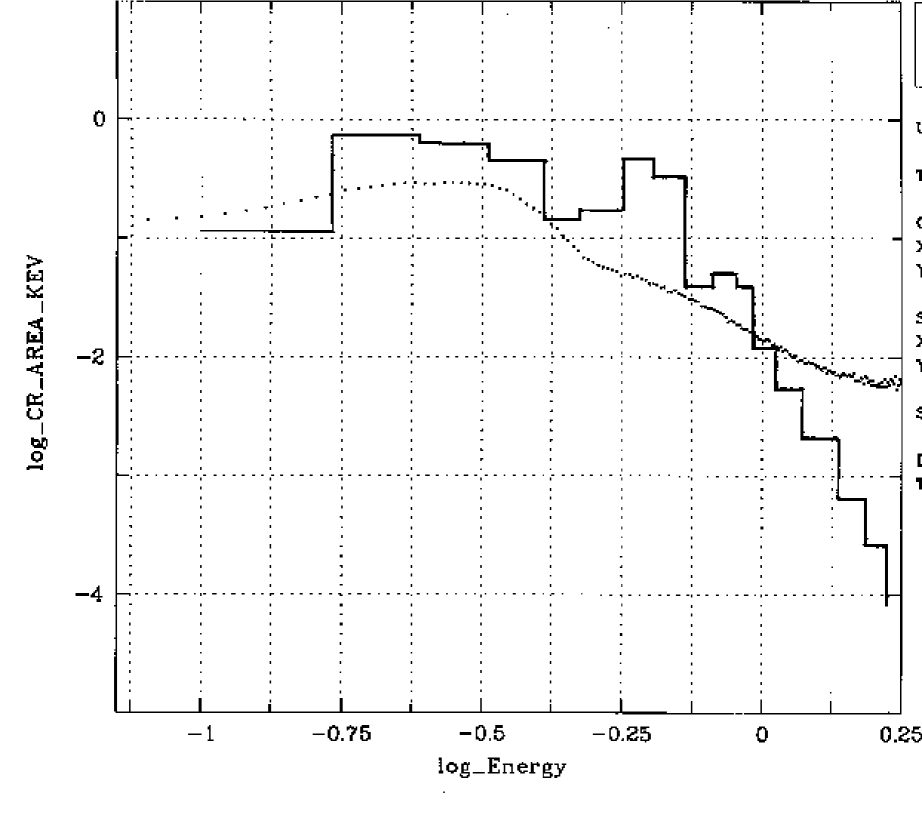
In comparison to earlier instruments, there has been considerable improvement in sensitivity and angular resolution by the Rosat PSPC. In Fig. 12 a PSPC spectrum of the SXRB in direction of the north Galactic pole is presented. It is taken from a deep pointed observation from the Rosat archive with all known point sources (stars, galaxies, clusters of galaxies etc.) being subtracted. The photon statistics are excellent, and the agreement with our model calculation discussed previously is again fairly good, with some deviation below 0.2 keV and above 1 keV. Below 0.2 keV the PSPC is not ground calibrated, so that data in this energy range are inherently uncertain. In addition the Rosat data still contain contributions from the foreground, i.e. the Local Bubble, and unresolved extragalactic background sources, which have not been removed. The latter is responsible for most of the flux above 1 keV, hence the higher observed flux at this energy. It should be noted however, that our calculations show a clear M-band excess. This discrepancy may be due to an initial temperature in the calculations that is somewhat too large. On the other hand, unless higher spectral resolution observations become available, a slight excess cannot be ruled out observationally.
Since the 1/4 keV band emission is mostly thermal in origin and a significant fraction in the halo is produced by expanding SNRs, superbubbles and Galactic wind, we expect a good deal of variation over the sky. This is confirmed by the recent analysis of the Rosat All-Sky-Survey data (Snowden 1996). We emphasize that our model is consistent with the results of the shadowing experiments, giving a natural explanation for the 1/4 keV band emission in the Galactic halo. In particular, fluctuations may be due to the line of sight cutting through different regions of neighbouring flux tubes. We have estimated (Paper I) that the number of flux tubes needed to explain the patchiness in the Wisconsin data is consistent with the observed area filling factor of superbubbles (Heiles 1990).
Direct observational evidence of gas flowing from the disk into the halo is still scanty. But X-ray observations tell us that hot gas is the dominant ISM component in the halo, at least by volume, and sources in the disk are available at large numbers with more than sufficient total energy. It is therefore tempting to assume that the flux tube in direction of the north Galactic pole in our model calculations is fuelled by gas from the neighbouring Loop I superbubble, which has an observed diameter of pc and is large enough to stick out into the halo. But also the giant radio Loops II and III, which have a similar apparent size to Loop I and hence must be close by, may have been good candidates for supplying hot gas in the past (since no observable X-ray enhancements are associated with them at present). Clearly, more investigations are necessary before we can draw any firm conclusions.
5.2 Temperature determination of interstellar plasmas


Highly ionized species such as C iv, Si iv, N v and O vi have been observed in absorption towards background objects with a known spectrum both in the Galactic disk with the Copernicus (e.g. Jenkins & Meloy 1974) and in the halo with the IUE satellite (Savage & deBoer 1981; Savage & Massa 1987; Danly et al. 1992). In order to determine the temperature of the plasma responsible for the absorption, a convenient method has been to measure the ratio of column densities of different lines, e.g. (York 1974). Since there is only a narrow range in temperature, where these two absorption lines intersect, the temperature of the plasma is fairly well determined. However, this is only true if the plasma is in CIE, a fact that has already been noted by York (1974). He mentioned that rapid cooling could lead to a lower temperature than would be inferred from the line ratios.
The situation is even more complicated. As a consequence of non-equilibrium cooling, the presence of individual highly ionized species depends again on the initial conditions and the thermal history of the plasma. Moreover, photoionization by an external photon field will also alter the ionization stages. To illustrate the effect of delayed recombination, we show in Fig. 13 and 14 the ionization state of nitrogen and oxygen, respectively. They result from our calculations of a fast adiabatic wind (model M2). The presence of highly ionized species at temperatures below is a consequence of recombination delay in a fast cooling plasma. The low ionization states at these temperatures are depopulated by the external photon field, whose influence grows with the density decrease of the outflowing wind.
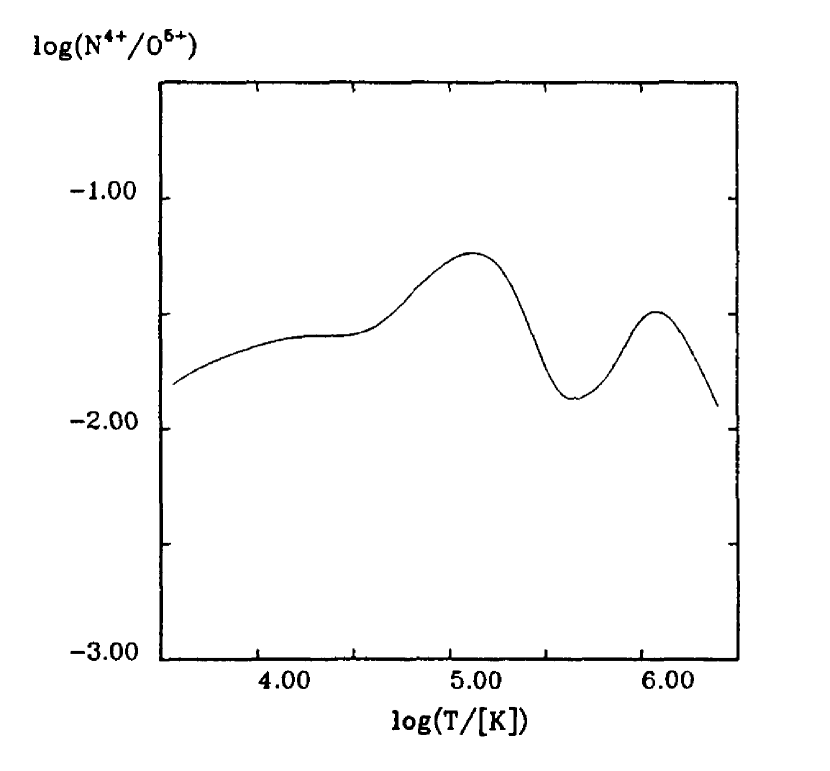
It is most instructive to see how the line ratio of varies with temperature. The most interesting feature is that there is no narrow region in which this ratio has a peak, but instead there is a rather broad plateau where the line ratio stays more or less at the same level. In Fig. 15 we show this line ratio again for model M2. Therefore caution must be applied if we were to infer temperature of interstellar plasmas from line ratios of just 2 species. Information on other species is therefore needed, thus constraining non-equilibrium ionization models.
6 Discussion and conclusions
Most information of the diffuse hot ISM is obtained in the form of electromagnetic radiation from optically thin plasmas. Under ideal conditions of thermal and ionization equilibrium, we can deduce the basic parameters of the plasma such as temperature, density and pressure directly from spectral fitting. However, the physical association of hot gas with violent events, such as the expansion of individual or multiple SNRs (including their merging) in the disk and the blow-out of superbubbles into the halo, introduces adiabatic cooling which drives the plasma very rapidly out of ionization equilibrium. As we have shown here, there is a need for a self-consistent treatment of the dynamical and thermal evolution of the plasma. There is no hope, in general, that a convenient CIE spectral fitting procedure gives any reasonable results, unless we have reliable information that dynamics is unimportant in a particular situation.
The basic physics behind the dynamical and thermal coupling is that the plasma preserves a memory of its initial conditions. Moreover, the emitted spectrum at any time during evolution does depend on the whole thermodynamic path of the cooling process. It has been shown (Cox & Anderson 1982) that the opposite process of ionization delay occurs when an adiabatic blast wave runs into an ambient medium which is at lower temperature than the hot interior. Once the gas has reached a temperature in excess of , and adiabatic cooling begins to dominate, then the spectra of SNRs are also modified by recombination delay. We have modeled the Local Bubble (Paper I) as a drastic example, in which a superbubble breaks out of a molecular cloud and the expanding shock wave runs down a density gradient.
On a larger scale, starburst galaxies and AGN winds may be additional candidates for a fast adiabatic outflow. As long as there are atoms that can be ionized, even at high temperatures of the order of –, delayed recombination might play a rôle, although the spectrum is largely determined by thermal bremsstrahlung. For example the absence of the 6.7 keV Fe-K line – which should be definitely present at these temperatures in a CIE plasma – in the ASCA spectra of M 82 (Moran & Lehnert, 1997) and NGC253 (Ptak et al., 1997), can be explained by a fast adiabatically expanding wind. We have performed numerical simulations, which will be discussed in detail elsewhere, in which the decreasing kinetic energy of the electrons falls rapidly below the threshold of collisional excitation of this Fe-line.
In summary however, it is fair to admit that cooling, and also the inverse process of heating, of interstellar plasmas are very complicated processes, which are still not fully understood and further detailed investigations are necessary.
Acknowledgements.
We thank P. Biermann, D. Cox, C. McKee, W. Tscharnuter and H. Völk for useful discussions. Special thanks to M. Freyberg who provided unpublished Rosat data of the soft X-ray background. DB acknowledges support from the Deutsche Forschungsgemeinschaft (DFG) by a Heisenberg fellowship. The Rosat project is supported by the German Bundesministerium für Bildung, Wissenschaft, Forschung und Technologie (BMBF/DLR) and the Max-Planck-Gesellschaft (MPG). TS did the final part of his work at the Institute for Theoretical Astrophysics (ITA), University of Heidelberg, supported by a fellowship of the DFG (Schm 1025/1 - 1). TS thanks the director of the ITA, W. Tscharnuter, for his warm hospitality and for providing excellent equipment.References
- [1] Aldrovandi, S.M.V., Péquignot, D. 1973, A&A 25, 137
- [2] Aldrovandi, S.M.V., Péquignot, D. 1976, A&A 47, 321
- [3] Allen, C.W. 1973, Astrophysical Quantities, 3rd ed., Athlone Press, London
- [4] Arnaud, M., Raymond, J. 1992, ApJ 398, 394
- [5] Arnaud, M., Rothenflug, R. 1985, A&AS 60, 425
- [6] Avillez, M.A., Berry, D.L., Kahn, F.D. 1998 in: Proceedings of the IAU Colloquium No. 166 “The Local Bubble and Beyond”, eds. D. Breitschwerdt, M.J. Freyberg, J. Trümper, Lecture Notes in Physics 506, 495
- [7] Beck, R., Brandenburg, A., Moss, D., Shukurov, A., Sokoloff, D. 1996, ARA&A 34, 155
- [8] Berezhko, E.G., Völk, H.J. 1997, Astroparticle Phys. 7, 183
- [9] Binette, L., Dopita, M.A., Tuoly, I.R. 1985, ApJ 297, 476
- [10] Black, J.H. 1987 in: Interstellar Processes, eds. D.J. Hollenbach and H.A. Thronson jr., Reidel Dordrecht, p. 731
- [11] Bowyer, C.S., Field, G.B., Mack, J.E. 1968, Nat 217, 32
- [12] Bregman, J.N. 1980, ApJ 236, 577
- [13] Bregman, J.N., Glassgold, A.E. 1982, ApJ 263, 564
- [14] Bregman, J.N., Pildis, R.A. 1994, ApJ 420, 570
- [15] Breitschwerdt, D. 1994, Habilitationsschrift, University of Heidelberg, 154p.
- [16] Breitschwerdt, D. 1996, Space Sci. Rev. 78, 173
- [17] Breitschwerdt, D., Egger, R., Freyberg, M.J., Frisch, P.C., Vallerga, J.V. 1996, Space Sci. Rev. 78, 183
- [18] Breitschwerdt, D., McKenzie, J.F., Völk, H.J. 1987, in: Interstellar Magnetic Fields, Springer, p. 131, eds. R. Beck und R. Gräve, Heidelberg
- [19] Breitschwerdt, D., McKenzie, J.F., Völk, H.J. 1991, A&A 245, 79
- [20] Breitschwerdt, D., Schmutzler, T. 1994, Nat 371, 774 (Paper I)
- [21] Brinks, E., Shane, W.W. 1984, ApJS 55, 179
- [22] Chevalier, R.A., Clegg, A.W. 1985, Nat 317, 44
- [23] Cox, D.P. 1991 in: The Interstellar Disk-Halo Connection in Galaxies, ed. H. Bloemen, Kluwer, p. 143
- [24] Cox, D.P. 1998 in: Proceedings of the IAU Colloquium No. 166 “The Local Bubble and Beyond”, eds. D. Breitschwerdt, M.J. Freyberg, J. Trümper, Lecture Notes in Physics 506, 121
- [25] Cox, D.P., Anderson, P.R. 1982, ApJ 253, 268
- [26] Cox, D.P., Tucker, W.H. 1969, ApJ 157, 1157
- [27] Danly, L., Lockman, F.J., Meade, M.R., Savage, B.D. 1992, ApJS 81, 125
- [28] Dettmar, R.-J. 1992, Fund. of Cosm. Phys. 15, 143
- [29] Dorfi, E.A. 1991 in: Interstellar Medium and Supernova Remnants, ed. J. van Paradijs, Lecture Notes in Physics
- [30] Edgar, R.J., Cox, D.P. 1993 ApJ 413, 190
- [31] Fabbiano, G. 1988, ApJ 330, 672
- [32] Fabbiano, G., Trinchieri, G. 1987, ApJ 315, 46
- [33] Fichtner, H., Neutsch, W., Fahr, H.J., Schlickeiser, R. 1991, ApJ 371, 98
- [34] Freyberg, M.J., Schmitt, J.H.M.M. in: Proceedings of the IAU Colloquium No. 166 “The Local Bubble and Beyond”, eds. D. Breitschwerdt, M.J. Freyberg, J. Trümper, Lecture Notes in Physics 506, 311
- [35] Giovarnadi, C., Natta, A., Palla, F. 1987, A&AS 70, 269
- [36] Giovarnadi, C., Palla, F. 1989, A&AS 77, 157
- [37] Habe, A., Ikeuchi, S. 1980, Prog. Theor. Phys. 64, 1995
- [38] Halpern, J.P., Grindlay, J.E., 1980, ApJ 242, 1041
- [39] Hamilton, A.J.S., Chevalier, R.A., Sarazin, C.L. 1983, ApJS 51, 115
- [40] Heiles, C. 1979, ApJ 229, 533
- [41] Heiles, C. 1980, ApJ 235, 833
- [42] Heiles, C. 1990, ApJ 354, 483
- [43] Herbstmeier, U., et al. 1995, A&A 298, 606
- [44] Hobbs, L.M., Penprase, B.E., Welty, D.E. Blitz, L., Magnani, L. 1988, ApJ 327, 356
- [45] Hollenbach, D., McKee, C.F. 1989, ApJ 342, 306
- [46] Ikeuchi, S. 1988, Fund. of Cosm. Phys. 12, 255
- [47] Innes, D.E. 1992, AA 256, 660
- [48] Ipavich, F. 1975, ApJ 196, 107
- [49] Itoh, H., 1978, PASJ 30, 489
- [50] Jelinsky, P., Vallerga, J.V., Edelstein, J. 1995, ApJ 442, 653
- [51] Jenkins, E.B., Meloy, D.A. 1974, ApJ 193, L121
- [52] Johnson, H.E., Axford, W.I. 1971, ApJ 165, 381
- [53] Jordan, C. 1969, MNRAS 142, 501
- [54] Jura, M., Dalgarno, A. 1972, ApJ 174, 365
- [55] Kahn, F.D. 1981, in: Investigating the Universe, ed. F.D. Kahn, Reidel Dordrecht, p. 1,
- [56] Kamaya, H., Mineshige, S., Shibata, K., Matsumoto, R. 1996, ApJ 458, 25
- [57] Karzas, W.J., Latter, R. 1961, ApJS 6, 167
- [58] Kato, T. 1976, ApJS 30, 397
- [59] Kerp, J., Herbstmeier, U., Mebold, U. 1993, A&A 268, L21
- [60] Kronberg, P.P., Biermann, P., Schwab, F.R. 1985, ApJ 291, 693
- [61] Kulsrud, R.M., Pearce, W.D. 1969, ApJ 156, 445
- [62] Kuntz, K.D., Snowden, S.L., Verter, F. 1997, ApJ 484, 245
- [63] Landini, M., Fossi, B.C.M. 1971, Solar Physics 20, 322
- [64] Lerche, I. 1967, ApJ 147, 689
- [65] Levich, E.V., Sunyaev, R.A. 1970, Astrophys. Letters 7, 69
- [66] Levich, E.V., Sunyaev, R.A. 1971, SvA 15, 363
- [67] Magnani, L., Blitz, L., Mundy, L. 1985, ApJ 295, 402
- [68] Magnani, L., Hartmann, D., Speck, B.G. 1996, ApJS 106, 447
- [69] Mathews, W.G., Baker, J.C. 1971, ApJ 170, 241
- [70] McCammon, D., Sanders, W.T. 1990, ARA&A 28, 657
- [71] McKee, C.F., Ostriker, J.P. 1977, ApJ 218, 148
- [72] McKenzie, J.F., Völk, H.J. 1982 A&A 116, 191
- [73] Mewe, R., Gronenschild, E.H.B.M., van den Oord, G.H.J. 1985, A&AS 62, 197
- [74] Mineshige, S., Shibata, K., Shapiro, P.R. 1993, ApJ 409, 663
- [75] Moran, E.C., Lehnert, M.D., 1997, ApJ 478, 172
- [76] Norman, C.A., Ikeuchi, S. 1989, ApJ 345, 372
- [77] Normandeau, M., Taylor, A.R., Dewdney, P.E. 1996, Nat 380, 687
- [78] Novikov, I.D., Thorne, K.S. 1973, in: Black holes, Les Houches, eds. C. De Witt, B. De Witt, Gordon and Breach, New York
- [79] Osterbrock, D.E. 1963, Planet. Space Sci. 11, 621
- [80] Osterbrock, D.E. 1971, in: Nuclei of Galaxies, Pont. Acad. Scient. Scripta Varia 35, ed. D.J.K. O’Connell, Amsterdam
- [81] Osterbrock, D.E. 1974, Astrophysics in gaseous nebulae, Freeman and Company, San Francisco
- [82] Osterbrock, D.E., Wallace R.K. 1977, ApJ 19, L11
- [83] Penston, M.V. 1970, ApJ 162, 771
- [84] Pietsch, W., et al. 1999, A&A (in preparation)
- [85] Ptak, A., Serlemitsos, P., Yaqoob, T., Mushotzky, R., 1997, AJ 113, 1286
- [86] Ptuskin, V.S., Völk, H.J., Zirakashvili, V.N., Breitschwerdt, D., 1997, A&A 321, 434
- [87] Raymond, J.C., Smith, B.W. 1977 ApJS 35, 419
- [88] Reilman, R.F., Manson, S.T. 1978, Phys. Rev. A 18, 2124
- [89] Reilman, R.F., Manson, S.T. 1979, ApJS 40, 815
- [90] Rieke, G.H., Lebofsky, M.J., Thompson, R.I., Low, F.J., Tokunaga, A.T. 1980, ApJ 238, 24
- [91] Sanders, W.T. (1993): Adv. Space Res. 13, (12)77
- [92] Sanders, W.T., Kraushaar, W.L., Nousek, J.A., Fried, P.M., 1977, ApJ Letters 217, L87
- [93] Savage, B.D., de Boer, K.S. 1981, ApJ 243, 460
- [94] Savage, B.D., Massa, D. 1987, ApJ 314, 380
- [95] Schaaf, R., Pietsch, W., Biermann, P.L., Kronberg, P.P., Schmutzler, T. 1989, ApJ 336, 722
- [96] Schmitt, J.H.M.M., Snowden, S.L. 1990, ApJ 361, 207
- [97] Schmutzler, T. 1987, Thesis, University Bonn
- [98] Schmutzler, T., Breitschwerdt, D. 1996, in: New Light on Galaxy Evolution (IAU Symposium No. 171), Eds. R. Bender, R. Davies, Kluwer Dordrecht, p. 442
- [99] Schmutzler, T., Tscharnuter, W.M. 1993, A&A 273, 318
- [100] Seaquist, E.R., Bell, M.B., Bignell, R.C. 1985, ApJ 294, 546
- [101] Seaquist, E.R., Odegard, N. 1991, ApJ 369, 320
- [102] Shapiro, P.R., Field, G.B. 1976, ApJ 205, 762
- [103] Shull, J.M. 1979, ApJ 234, 761
- [104] Shull, J.M., Van Steenberg, M. 1982, ApJS 48, 95; erratum 1982, ApJS 49, 351
- [105] Slavin, J.D., Cox, D.P. 1993, ApJ 417, 187
- [106] Snowden, S.L. 1996, in: Röntgenstrahlung from the Universe, Eds. H.-U. Zimmermann, J.E. Trümper, H. Yorke, MPE-Report 263, 299
- [107] Snowden, S.L., Cox, D.P., McCammon, D., Sanders, W.T. 1990, ApJ 354, 211
- [108] Snowden, S.L., Egger, R., Finkbeiner, D.P., Freyberg, M.J., Plucinsky, P.P. 1998, ApJ 493, 715
- [109] Snowden, S.L., Mebold, U., Hirth, W., Herbstmeier, U., Schmitt, J.H.M.M. 1991, Science, 252, 1529
- [110] Sofue, Y. 1991, in: The Interstellar Disk-Halo Connection in Galaxies, ed. H. Bloemen, Kluwer, p. 169
- [111] Sofue, Y., Wakamatsu, K., Malin, D.F. 1991, in: The Interstellar Disk-Halo Connection in Galaxies, ed. H. Bloemen, Kluwer, p. 309
- [112] Spitzer, L. jr. 1956 ApJ 124, 20
- [113] Stern, R., Wang, E., Bowyer, S. 1978, ApJS 37, 195
- [114] Suchkov, A.A., Balsara, D.S., Heckman, T.M., Leitherer, C. 1994, ApJ 430, 511
- [115] Tanaka, Y., Bleeker, J.A.M. 1977, Space Sci. Rev., 20, 815
- [116] Tarter, C.B. 1971, ApJ 168, 313
- [117] Tomisaka, K. 1991, in: The Interstellar Disk-Halo Connection in Galaxies, ed. H. Bloemen, Kluwer, p. 407
- [118] Tomisaka, K., Bregman, J.N. 1993, PASJ 45, 513
- [119] Trümper, J. 1983, Adv. Space Res., 2(4), 241
- [120] Völk, H.J., Klein, U., Wielebinski, R. 1989, A&A 213, L12
- [121] Vogel, U. 1972, Ph. D. Thesis, University Bonn
- [122] Vogler, A., Pietsch, W. 1999, A&A 342, 101
- [123] Wang, Q.D. in: Proceedings of the IAU Colloquium No. 166 “The Local Bubble and Beyond”, eds. D. Breitschwerdt, M.J. Freyberg, J. Trümper, Lecture Notes in Physics 506, 503
- [124] Wang, Q.D., McCray, R. 1993 ApJ 409, L37
- [125] Wang, Q.D., Walterbos, R.A.M., Steakley, M.F., Norman, C.A., Braun, R. 1995, ApJ 439, 176
- [126] Weisheit, J.C. 1974, ApJ 190, 735
- [127] York, D.G. 1974, ApJ 193, L127
- [128] Zirakashvili, V.N., Breitschwerdt, D., Ptuskin, V.S., Völk, H.J. 1996, A&A 311, 113