Toward the Evidence of the Accretion Disk Emission in the Symbiotic Star RR Tel
Abstract
In this paper, we argue that in the symbiotic star RR Tel the existence of an accretion disk around the hot companion is strongly implied by the characteristic features exhibited by the Raman-scattered O VI lines around 6830 Å and 7088 Å. High degrees of polarization and double-peaked profiles in the Raman-scattered lines and single-peak profiles for other emission lines are interpreted as line-of-sight effects, where the H I scatterers near the giant see an incident double-peaked profile and an observer with a low inclination sees single-peak profiles. It is predicted that different mass concentrations around the accretion disk formed by a dusty wind may lead to the disparate ratios of the blue peak strength to the red counterpart observed in the 6830 and 7088 features. We discuss the evolutionary links between symbiotic stars and bipolar protoplanetary nebulae and conclude that the Raman scattering processes may play an important role in investigation of the physical properties of these objects.
keywords:
stars : symbiotic — accretion disk — polarization — scattering — planetary nebulae — evolution1 Introduction
Symbiotic stars exhibit the thermal components typical of a cool star and a hot star in their spectra with additional emission nebulosity. It is usually thought that they form a binary system of a giant suffering a heavy mass loss and a white dwarf surrounded by an emission nebula (e.g. Kenyon 1986). The double-peaked profiles often observed in the emission lines of many symbiotic systems convincingly imply that the emission regions may be characterized by disk-type motions. The variability and nova-like outbursts may also be attributed to the existence of an accretion disk. Since the giant provides material to the hot star in the form of a stellar wind, it is plausible to expect that an accretion disk may be formed around the hot star (Robinson et al. 1994). Recently, Mastrodemos & Morris (1998) presented their numerical computations on disk formation in a wide binary system of a white dwarf and a giant through a dusty wind.
An important and distinct aspect of spectroscopy of symbiotic stars is provided by the Raman-scattered features around 6830 Å and 7088 Å, which are identified by Schmid (1989). According to him, they are originally the O VI 1032, 1038 doublet lines that are absorbed and re-emitted by atomic hydrogen initially in the ground state and finally to de-excite to the state. Basic atomic physics of the Raman-scattering processes is discussed by many researchers (Lee & Lee 1997a, Nussbaumer et al. 1989, Saslow & Mills 1969, Sadeghpour & Dalgarno 1992).
The Raman-scattered features are characterized by the strong polarization and the Doppler enhancement by a factor of attributed to the incoherence of scattering. Therefore, the broadened profiles and polarization are expected to carry much information about the physical properties of the emission regions and scattering geometry. This point is illustrated by the numerical works by Harries & Howarth (1997) and Schmid (1992) and by the spectropolarimetric observations performed by Harries & Howarth (1996), and Schmid & Schild (1990).
However, thus far it appears that neither numerical works nor observational reports successfully address the important role of the Raman-scattered features that they provide a unique view of the emission region from the neutral scatterers rather than in the line of sight to the observer. One good example of this point is found in the spectropolarimetry of the broad double-peaked H line in the radio galaxy Arp 102B by Corbett et al. (1998). They proposed that the single-peaked profile in the polarized flux is mainly associated with the different line of sight to the scatterers than the observer’s sight line that is prone to give a double-peaked profile in the direct flux. Similar but more interesting effects are expected in the case of the Raman-scattered lines, because these are purely scattered features with no direct component and furthermore the associated polarized fluxes carry additional and complementary information.
Recently, simultaneous observations of the Raman-scattered features and emission lines in the UV range have been performed (Espey et al. 1995, Birriel et al. 1998, Schmid 1998). In this regard, this viewpoint about the Raman-scattered lines is expected to be useful for building more elaborate models of symbiotic stars. In this Letter, we adopt this point to compute the profiles and polarization of the Raman-scattered O VI lines and explain many prominent features seen in the symbiotic star RR Tel, and discuss the evolutionary status in relation to bipolar protoplanetary nebulae.
2 Model
2.1 Accretion Disk in Symbiotic Stars
In this subsection, we give a brief description of our model adopted for the computation of the profiles and polarization of the Raman-scattered lines in the symbiotic star RR Tel. Spectropolarimetric observations of RR Tel have been performed by a number of researchers (e.g. Harries & Howarth 1996, Espey et al. 1995). The main features of the spectra of RR Tel include the clear double-peaked profiles, high degree of polarization and polarization flip in the red wing in the Raman-scattered lines. Because the scatterers responsible for the Raman-scattered lines are believed to be located near the giant, the double-peaked profiles imply that the emission regions are characterized by a disk-type motion.
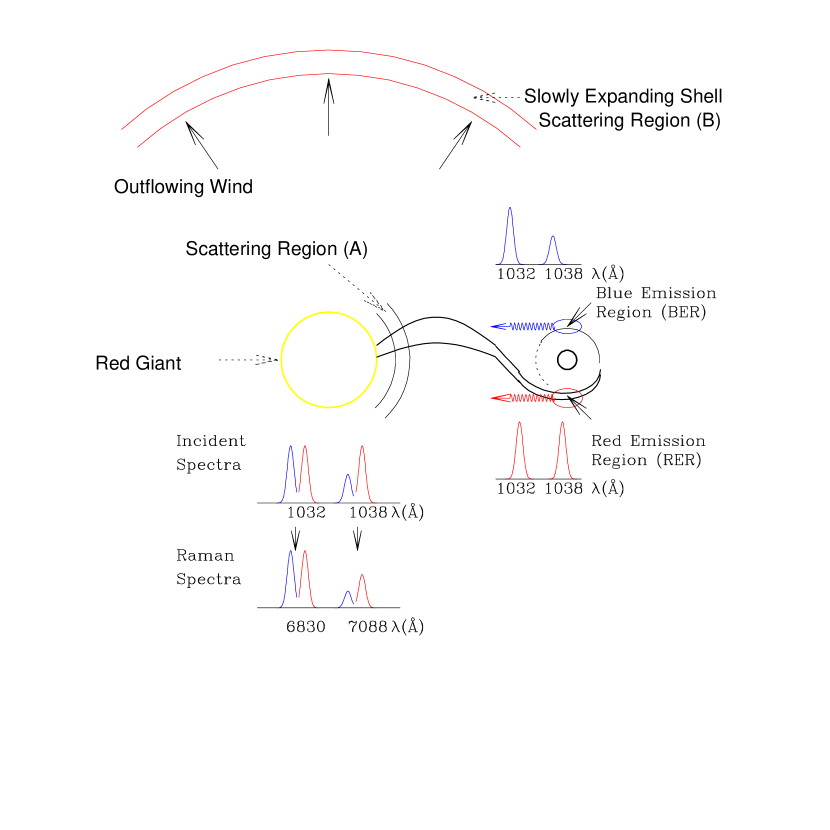
In Fig. 1 is shown a schematic diagram illustrating the accretion disk emission regions and the scattering geometry adopted in this Letter. There are two main emission regions around the hot star, that is, the red emission region (marked by ‘RER’) and the blue emission region (marked by ‘BER’), which give the red and blue components in the direction of the binary axis, respectively. Here, by the binary axis we mean the line connecting the two stars. According to Mastrodemos & Morris (1998) more mass concentration is expected in the RER than in the BER. We discuss this effect in the next section.
The scatterers are assumed to be concentrated mainly in two regions, that is, in region (A) near the giant star and in region (B) forming a slowly expanding shell. Solf (1984) investigated the bipolar mass outflow of the symbiotic star HM Sge and found that in addition to the outflow of velocity , there are slowly moving features near the equatorial plane. The amount of neutral hydrogen in region (B) is not certain at the moment, and in this paper it is assumed to be much smaller than that in region (A), but not negligible. It is also assumed that when the incident wavevector makes an angle less than with the binary axis, then the photon hits region (A) and otherwise it is scattered in region (B).
2.2 Double-Peaked Emission from an Accretion Disk
We follow the approximation adopted by Horne & Marsh (1986) to generate the line profiles from the disk inclined at various angles. The emission lines are assumed to be optically thick, and the disk obeys the Keplerian rotation. We also assume that the disk is geometrically thin with the disk height ratio . Since we do not know enough about the accretion disk in symbiotic stars and even less about the emission regions in the disk, we just take the line source function to be a simple power-law , which has been used by Horne & Marsh (1986) to match the line shape of H in Z Cha. Fig. 2 shows the line profiles for inclination angles , 30∘, 60∘, 90∘. The maximum velocity of the emission region is chosen to be and the thermal broadening has not been applied. We note that the low-inclination profile is narrower than the high-inclination counterpart.
In this paper, we do not attempt to reproduce the observational results by fitting accurately, and instead we want to point out the physical origins of the main characteristic features shown in the observational data. Therefore, for the computation of the generic profiles and polarization, we use two Gaussians to approximate the profiles in Fig. 2, and adopt the peak strength ratio as a new free parameter. It is referred to Lee & Lee (1997b) for the detailed description of the Monte Carlo computation of the scattered flux profile and polarization. (See also Harries & Howarth 1997, Schmid 1992)
3 Result and Discussion
3.1 Profile and Polarization
In Fig. 3 is shown the main result. We set the strength ratio of the blue part to that of the red part to be 2/3 and discuss this point in the next subsection. The top panel shows the flux and polarization of the component scattered near the giant. In Panel (b) the same quantities are shown for the radiation scattered in the spherical shell receding with velocity and total scattering optical depth . In the bottom panel is shown the sum of the preceding two components. Here, the polarization direction is represented by the sign, where the positive sign represents the polarization in the direction perpendicular to the binary axis whereas the negative sign the parallel direction.
The double-peaked profile in the top panel is obtained because the scatterers near the giant see a double-peaked incident source. This component is strongly polarized in the direction perpendicular to the binary axis. Because the relative velocity of the scatterers near the giant is ignored, the scattered flux profile is almost the same as the incident profile in the binary axis direction and the breadth of the feature represents mainly the kinematics of the source part.
In Panel (b), we obtain a broad profile with a single peak. The polarization is in the direction parallel to the binary axis and is weaker because region (B) subtends a larger solid angle than region (A) does. Due to the relative motion of the shell, the location of the peak is redshifted from the center. The single-peaked profile is obtained because the averaged profile incident to the shell is smooth with a single peak near the center.
In combining the two components we may see interesting fine points that may be revealed in the spectropolarimetry of symbiotic stars. Firstly, the strength of the scattered component is determined mainly by the scattering optical depth and the solid angle of the scattering region. Our choice is such that the shell has a small scattering optical depth so that the synthetic scattered flux is dominantly determined by the near axis-scattered component. In RR Tel, most emission lines are single-peaked and the Raman lines show the double-peaked profile, which strongly imply the emission regions in disk-type motion with low inclination.
Secondly, the shell-scattered component is red-shifted and single-peaked. Therefore, this component adds more flux to the red part and increases slightly the ratio of the red peak strength to that of the blue in the synthetic flux. However, since the shell-scattered component is polarized in the parallel direction, in the overlapping region with the flux scattered in region (A) the total polarized flux is reduced as a result of cancellation of polarization but remains still in the perpendicular direction. Because the shell-scattered component extends more redward than the component scattered in region (A), there remains a parallelly polarized flux in the reddest part where the (A)-scattered component does not contribute. The polarization flip in the red wing part is an important feature shown in many spectropolarimetric observations of symbiotic stars.
Finally, as Harries & Howarth (1996) pointed out, the overall profiles observed for many symbiotic systems are broader than the terminal speed of the stellar wind associated with K or M type giants and the commonest profile type is triply-peaked where the reddest component is often polarized oppositely compared with the remainder part. It turns out that the overall breadth of the profile is determined by the kinematics of the source part and the relative motion of the scatterers. Furthermore, by increasing the speed of the receding shell, we can also generate triply-peaked profiles with the polarization flipped in the reddest component.
3.2 O VI Doublet Strength Ratio
In this subsection we discuss a possible prediction of the symbiotic star model consisting of an accretion disk with a bipolar wind. According to Mastrodemos & Morris (1998), it is expected that the RER has a higher optical depth than the BER does. For the O VI 1034 doublet, the 1032 photons have twice larger optical depth than the 1038 counterparts. In an optically thin medium, the oscillator strength ratio becomes that of the emergent line strength ratio. However, in an optically thick medium the emergent line strength of the 1032 Å component becomes similar to that of the 1038 Å component. However, complications may occur in a non-stationary medium, where the sensitive dependence of the resonance scattering cross section on the velocity field may easily alter the escape probability so that it becomes eventually proportional to the velocity gradient (e.g. Sobolev 1963, Lee & Blandford 1997, Michalitsianos et al. 1988). Further complications can be expected if the medium is dusty, in which case resonantly scattered O VI photons are subject to destructions by the dust particles (e.g. Neufeld 1991).
It is an interesting possibility that if the BER is optically thin and the RER is thick, then the Raman-scattered line around 6830 Å will show a larger ratio of the blue peak strength to the red peak strength than the 7088 Å feature, as is depicted in Fig. 1. It appears that in RR Tel the 7088 Å feature has a weaker red part compared that of the 6830 Å feature (Harries & Howarth 1997). However, since the 7088 Å feature is much weaker, higher resolution spectroscopy with good signal to noise ratio must be invoked to exclude other possibilities such as selective interstellar absorptions.
Hayes & Nussbaumer (1986) proposed that the electron density and the size of the emission line region in RR Tel. A simple computation of the line center optical depth of the O VI 1034 doublet in the emission region gives
where is the temperature in units of , is the O VI fraction in number and is the oscillator strength of the O VI resonance transition (Rybicki & Lightman 1979). Apparently, the emission region in RR Tel is very optically thick and the O VI doublet strength ratio would be nearly 1:1 in the entire region, even if the BER is an order of magnitude rarer in mass concentration than the RER. Therefore, both high resolution spectroscopy and further theoretical work on the radiative transfer based on a more refined model will shed light on this point.
3.3 Evolutionary Status of Symbiotic Stars
Asymmetric morphologies in the emission nebulae have been known in many symbiotic systems including V 1016 Cyg (Schild & Schmid 1996), HM Sge (Solf 1983, Eyres et al. 1995). Solf(1984) emphasized that a large fraction of symbiotic stars exhibit bipolarity and that there is a remarkable morphological resemblance with postnova shells and protoplanetary nebulae. The spectroscopic similarity between symbiotic stars and bipolar protoplanetary nebulae has led many researchers to propose evolutionary links between them (e.g. Iben & Tutukov 1996, Corradi 1995, Corradi & Schwarz 1995). A supporting argument to this effect is that the binarity may play an important role in forming an aspherical morphology of the nebula, typically characterized by bipolarity (Morris 1987, Soker 1998). However, the binarity of symbiotic stars is well-established whereas that of the bipolar protoplanetary nebulae still remains controversial.
The accretion disk formation in a young planetary nebula has been discussed by a number of researchers (e.g. Morris 1987, Soker & Livio 1994). Recently, Mastrodemos & Morris (1998) presented an interesting numerical computation on the dusty wind accretion in a detached binary of a mass-losing AGB star and a hot star that may be responsible for the bipolar morphology in protoplanetary nebulae. They found that a permanent and stable accretion disk is formed around the hot companion with an efficient cooling associated with dust in the wind (see also Theuns & Jorissen 1993). In particular, they concluded tha the limiting binary separation for disk formation should be greater than 20 AU for their M4 model. Therefore, it is interesting that the evolutionary links between symbiotic stars and bipolar protoplanetary nebulae imply that the hypothesis of accretion disk emission in RR Tel is also rendered a strong case. Furthermore, as shown in Fig. 1 the bipolar wind along the disk axis may provide natural scattering sites for the Raman-scattered flux that constitutes the red wing part with polarization flip.
The Raman-scattered lines are characterized by the high polarization and broadened profiles, which enable one to put strong constraints on the scattering geometry. Therefore, the main spectroscopic and polarimetric features imply very plausibly that the symbiotic star RR Tel may possess an accretion disk with a bipolar outflow. So called ‘type 2’ symbiotic stars seem to show similar behaviors in the Raman scattered lines and exhibit bipolar type morphologies. Furthermore, about a half of symbiotic stars exhibit the Raman scattered lines. Fine-tuned conditions such as a restricted range of the initial mass ratios of the two constituent stars and the orbital parameters affecting the mass transfer rate may be needed for the co-existence of a large amount of neutral hydrogen and highly ionized nebulae which characterize the symbiotic phenomenon.
An interesting example is provided by Péquignot (1997), who performed high resolution spectroscopy on a young planetary nebula NGC 7027 and found a Raman scattered He II line blueward of H. Gurzadyan (1996) discusses the relation of NGC 7027 to symbiotic stars, noting that NGC 7027 shows high ionization lines along with a strong IR component. So far the Raman-scattering by H I is found to operate only in symbiotic stars except NGC 7027, and theoretical possibilities have been discussed in other astrophysical objects such as active galactic nuclei (Nussbaumer et al. 1989, Lee & Yun 1998). Therefore, it will remain an interesting possibility that similar processes are expected to operate in bipolar protoplanetary nebulae, in which case the Raman scattering can be regarded as an important tool that reveals the evolutionary links between symbiotic systems and bipolar protoplanetary nebulae.
Acknowledgements.
We are grateful to Dr. Hwankyung Sung and Sang-Hyeon Ahn for helpful discussions. We also thank the referee, who gave many suggestions that improve the presentation of this paper. HWL is supported by the Post-Doc. program (1998) at the Kyungpook National University. MGP gratefully acknowledges support from KOSEF grant 971-0203-013-2.References
- (1)
- (2) Birriel, J. J., Espey, B. R. & Schulte-Ladbeck, R. E., 1998, ApJ, 507, L75
- (3)
- (4) Corbett, E., Robinson, A., Axon, D., Young, S., Hough, J. 1998, MNRAS, 296, 721
- (5)
- (6) Corradi, R. L. M., 1995, MNRAS, 276, 521
- (7)
- (8) Corradi, R. L. M., & Schwarz, H. E. 1995, A&A, 293, 871.
- (9)
- (10) Espey, B. R., Schulte-Ladbeck, R. E., Kriss, G. A., Hamann, F., Schmid, H. M., Johnson, J. J., 1995, ApJ, 454, L61
- (11)
- (12) Eyres, S. P. S., Kenny, H. T., Cohen, R. J., Lloyd, H. M., Dougherty, S. M., Davies, R. J., Bode, M. F., 1995, MNRAS, 274, 317
- (13)
- (14) Gurzadyan, G. A., 1996, The Physics and Dynamics of Planetary Nebulae, Springer-Verlag, Berlin
- (15)
- (16) Harries, T. J., & Howarth, I. D., 1996, A & AS, 119, 61
- (17)
- (18) Harries, T. J., & Howarth, I. D., 1997, A & AS, 121, 15
- (19)
- (20) Hayes, M. A. & Nussbaumer, H., 1986, A& A, 161, 287
- (21)
- (22) Horne, K. & Marsh, T. R., 1986, MNRAS, 218, 761
- (23)
- (24) Iben, JR., I. & Tutukov, A. V., 1996, ApJS, 105, 145
- (25)
- (26) Kenyon, S. J., 1986, The Symbiotic Stars, CUP, Cambridge
- (27)
- (28) Lee, H. -W. & Blandford, R. D., 1997, MNRAS, 288, 19
- (29)
- (30) Lee, H. -W. & Lee, K. W., 1997, MNRAS, 287, 211
- (31)
- (32) Lee, K. W. & Lee, H. -W., 1997, MNRAS, 292, 573
- (33)
- (34) Lee, H. -W. & Yun, J. -H, 1998, MNRAS, 301, 193
- (35)
- (36) Mastrodemos, N. & Morris, M., 1998, ApJ, 497, 303
- (37)
- (38) Michalitsianos, A. G., Kafatos, M., Fathey, R. P., Viotti, R., Cassatella, A., & Altamore, A., 1988, ApJ, 331, 477
- (39)
- (40) Morris, M., 1987, PASP, 99, 1115
- (41)
- (42) Neufeld, D. A., 1991, ApJ, 370, L85
- (43)
- (44) Nussbaumer, H., Schmid, H. M.& Vogel, M., 1989, A& A, 211, L27
- (45)
- (46) Pequignot, D., Baluteau, J. -P., Morisset, C., Boisson, C., 1997, A& A, 323, 217
- (47)
- (48) Robinson, K., Bode, M.F., Skopal, A., Ivison, R. J., & Meaburn, J., 1994, MNRAS 269, 1
- (49)
- (50) Rybicki, G.B. & Lightman, A.P.,1979, Radiative Processes in Astrophysics (Wiley-Interscience),
- (51)
- (52) Saslow, W. M.,& Mills, D. L., 1969, Physical Review, 187, 1025
- (53)
- (54) Sadeghpour, H. R. & Dalgarno, A. 1992, J. Phys. B: At. Mol. Opt.Phys, 25, 4801
- (55)
- (56) Schild, H. & Schmid, H. M., 1996, A& A, 310, 211
- (57)
- (58) Schmid, H. M. 1989, A& A, 211, L31
- (59)
- (60) Schmid, H. M. 1992, A& A, 254, 224
- (61)
- (62) Schmid, H. M. 1998, Rev. of Modern Astronomy, in press
- (63)
- (64) Schmid, H. M. & Schild, H., 1990, A& A, 236, L13
- (65)
- (66) Sobolev, V. V., 1963, A Treatise on Radiative Transfer, D. Van Nostrand Company, Inc., Toronto
- (67)
- (68) Soker, N. & Livio, M. 1994, ApJ, 421, 219
- (69)
- (70) Soker, N. 1998, ApJ, 496, 833
- (71)
- (72) Solf, J., 1983, ApJ, 266, L113
- (73)
- (74) Solf, J., 1984, A& A, 139, 296
- (75)
- (76) Theuns, T., & Jorissen, A., 1993, MNRAS, 265, 946
- (77)