Small-scale anisotropy of cosmic rays above 1019eV observed with the Akeno Giant Air Shower Array
Abstract
With the Akeno Giant Air Shower Array (AGASA), 581 cosmic rays above 1019eV, 47 above 4 1019eV, and 7 above 1020eV are observed until August 1998. Arrival direction distribution of these extremely high energy cosmic rays has been studied. While no significant large-scale anisotropy is found on the celestial sphere, some interesting clusters of cosmic rays are observed. Above 4 1019eV, there are one triplet and three doublets within separation angle of 2.5 and the probability of observing these clusters by a chance coincidence under an isotropic distribution is smaller than 1 %. Especially the triplet is observed against expected 0.05 events. The distribution expected from the Dark Matter Halo model fits the data as well as an isotropic distribution above 2 1019eV and 4 1019eV, but is a poorer fit than isotropy above 1019eV. Arrival direction distribution of seven 1020eV cosmic rays is consistent with that of lower energy cosmic rays and is uniform. Three of seven are members of doublets above about 4 1019eV.
1 Introduction
Investigation on anisotropy of extremely high energy cosmic rays is one of the most important aspects to reveal their origin. In energies 1019eV, cosmic rays slightly deflect in the galactic magnetic field if they are protons of galactic origin, so that one could observe the correlation of their arrival directions with the galactic structure. Especially in the highest observed energy range, correlation of cosmic rays with the local structure of galaxies may be expected if their origins are nearby astrophysical objects and the intergalactic magnetic field is less than 10-9 gauss.
In the 1980’s, Wdowczyk, Wolfendale and their collaborators (Wdowczyk and Wolfendale (1984); Szabelski, Wdowczyk and Wolfendale (1986)) have shown that excess of cosmic rays from the direction of the galactic plane increases systematically with energy until a little above 1019eV, though the available data was not statistically enough at that time. Gillman and Watson (1993) have summarized anisotropies in right ascension and galactic latitude combining the Haverah Park data set with the data sets from the arrays at Volcano Ranch (Linsley (1980)), Sydney (Winn et al. (1986)) and Yakutsk (Efimov et al. (1986)). No convincing anisotropies were observed; but large amplitude of the second harmonics at (4 – 8) 1018eV was reported. Ivanov (1998) showed, with the Yakutsk data set, a north-south asymmetry in the galactic latitude distribution which is the southern excess with 3.5 deviation from an isotropic distribution in (5 – 20) 1018eV.
Recently, we have shown a significant anisotropy with first harmonic amplitude of 4 % in (0.8 – 2.0) 1018eV, which corresponds to the chance probability of 0.2 % due to fluctuation of an isotropic distribution (Hayashida et al. (1998)). This anisotropy shows broad cosmic-ray flow from the directions of the galactic center and the Cygnus regions. In the higher energies, no significant large-scale anisotropy was found. Bird et al. (1998) have shown the galactic plane enhancement in the similar energy range. These experiments show that significant fraction of cosmic rays around 1018eV come from galactic sources.
In the much higher energy range 4 1019eV, Stanev et al. (1995) have claimed that cosmic rays exhibit a correlation with the direction of the supergalactic plane and the magnitude of the observed excess is 2.5 – 2.8 in terms of Gaussian probabilities. Their result was mainly based on the Haverah Park data set. In the same energy range, such large-scale correlation with the supergalactic plane was not observed in the data sets of the AGASA (Hayashida et al. (1996)), SUGAR (Kewley, Clay and Dawson (1996)) and Fly’s Eye (Bird et al. (1998)) experiments. However, AGASA observed three pairs of cosmic rays above 4 1019eV within a limited solid angle of the experimental accuracy and the chance probability is 2.9 % if cosmic rays distribute uniformly in the AGASA field of view. Two out of three are located nearly on the supergalactic plane. If cosmic rays in each of these pairs come from the same source, the detailed study on energy, arrival time and direction distribution of these clusters may bring information on their source and the intergalactic magnetic field (Sigl and Lemoine (1998); Medina Tanco (1998)).
In the observed energy spectrum, there are two distinctive energies: 1019eV and 4 1019eV. The former is the energy where the spectral slope changes (Lawrence, Reid and Watson (1991); Efimov et al. (1991); Bird et al. (1994); Yoshida et al. (1995); Takeda et al. (1998)). This is interpreted as transition from galactic to extragalactic origin. The latter is the energy where the GZK effect (Greisen (1966); Zatsepin and Kuz’min (1966)), which is a series of energy loss through interaction with the cosmic microwave background photons, becomes important on their propagation from sources. It is important to study whether the arrival direction distribution of cosmic rays changes at these energies.
Recent result of the AGASA energy spectrum shows the extension beyond the expected GZK cutoff (Takeda et al. (1998)). Since the distance to sources of cosmic rays above the expected GZK cutoff is limited to 50 Mpc (Hill and Schramm (1985); Berezinsky and Grigor’eva (1988); Yoshida and Teshima (1993)), their arrival directions may be correlated with luminous matter distribution if they are astrophysical source origin such as hot spots of radio galaxies (Biermann and Strittmatter (1987); Takahara (1990); Rachen and Biermann (1993); Ostrowski (1998)), active galactic nuclei (Blandford (1976); Lovelace (1976); Rees et al. (1982)), accretion flow to a cluster of galaxies (Kang, Rachen and Biermann (1997)), relativistic shocks in gamma-ray bursts (Vietri (1995); Waxmann (1995)), and so on. There is another possibility that most energetic cosmic rays are generated through decay of supermassive “X” particles related to topological defects (Bhattacharjee and Sigl (1998), reference therein). In this case, arrival directions of most energetic cosmic rays are not necessarily associated with luminous matters. If such particles are the part of Dark Matter and are concentrated in the galactic halo, anisotropy associated with our galactic halo is expected (Kuzmin and Rubakov (1997); Berezinsky, Kachelriess and Vilenkin (1997)).
In this paper, we first examine large-scale anisotropy in terms of various coordinates using the data set of the Akeno Giant Air Shower Array (AGASA) until August 1998, including the old data set of the Akeno 20 km2 array (A20) before 1990. Then we search for the small-scale anisotropy above 1019eV with the AGASA data set.
2 Experiment
The Akeno Observatory is situated at 138 30 E and 35 47 N. AGASA consists of 111 surface detectors deployed over an area of about 100 km2, and has been in operation since 1990 (Chiba et al. (1992); Ohoka et al. (1997)). A20 is a prototype detector system of AGASA, operated from 1984 to 1990 (Teshima et al. (1986)), and is a part of AGASA after 1990.
Each surface detector consists of plastic scintillators of 2.2 m2 area. The detectors are placed with a separation of about 1 km. They are controlled and operated from a central computer through optical fiber network. Relative time difference among the detectors are measured with 40 nsec accuracy; all clocks at detector sites are synchronized to the central clock and signal-propagation time in cables and electronic devices are regularly measured at start of each run (twice a day). The details of the AGASA instruments have been described in Chiba et al. (1992) and Ohoka et al. (1997).
The accuracy on determination of shower parameters are evaluated through the analysis of a large number of artificial events. These artificial events are generated with taking account of air shower features and fluctuation determined experimentally. Figure Small-scale anisotropy of cosmic rays above 1019eV observed with the Akeno Giant Air Shower Array shows the accuracy on arrival direction determination for cosmic-ray induced air showers as a function of energies. The vertical axis denotes the opening angle between input (simulated) and output (analyzed) arrival directions. The opening angles including 68 % and 90 % of data are plotted. By analyzing artificial events with the same algorithm used above, the accuracy on energy determination is estimated to be 30 % above 1019eV (Yoshida et al. (1995)).
Table 1 lists the number of selected events, N(E), with zenith angles smaller than 45 and with core locations inside the array area. Events below 1019eV are used only a reference analysis in this paper. The difference of N(E 3.2 1019eV) N(E 1019eV) between A20 and AGASA arises from the difference of detection efficiency of each system. Seven events are observed above 1020eV, including one event after Takeda et al. (1998).
3 Results
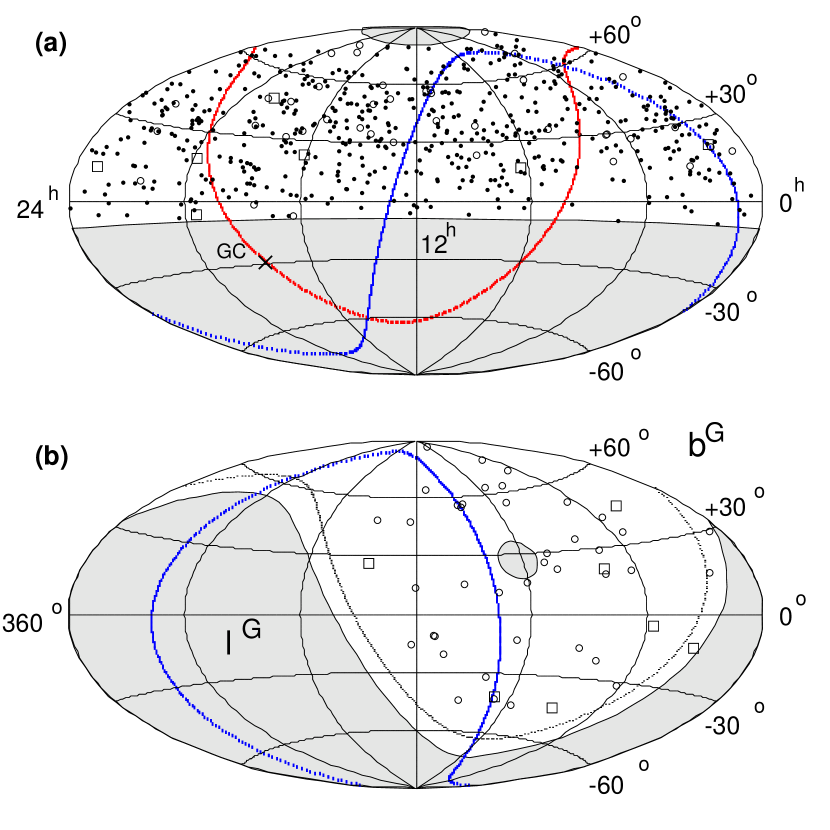
Figure Small-scale anisotropy of cosmic rays above 1019eV observed with the Akeno Giant Air Shower Array(a) shows arrival directions of cosmic rays with energies above 1019eV on the equatorial coordinates. Dots, open circles, and open squares represent cosmic rays with energies of (1 – 4) 1019eV, (4 – 10) 1019eV, and 1020eV, respectively. The shaded regions indicate the celestial regions excluded in this paper due to the zenith angle cut of 45. The galactic and supergalactic planes are drawn by the dashed lines. “GC” designates the galactic center. Figure Small-scale anisotropy of cosmic rays above 1019eV observed with the Akeno Giant Air Shower Array(b) shows arrival directions of cosmic rays only above 4 1019eV on the galactic coordinates. Details of the cosmic rays above 4 1019eV are listed in Table 2.
3.1 Analysis in the Equatorial Coordinates
3.1.1 Harmonic Analysis
In order to search for cosmic ray anisotropy, it is required to compare observed and expected event frequencies at each region. An expected frequency is easily estimated as far as the exposure in each direction can be obtained; the uniformity of observation time on solar time for several years, which results in the uniform observation in right ascension, is expected for a surface array detection system operating in stable like AGASA. The fluctuation of the observation time on the local sidereal time is (0.2 0.1) % which is small enough compared with anisotropy in this energy range, so that the exposure (observation time collection area) in right ascension is quite uniform.
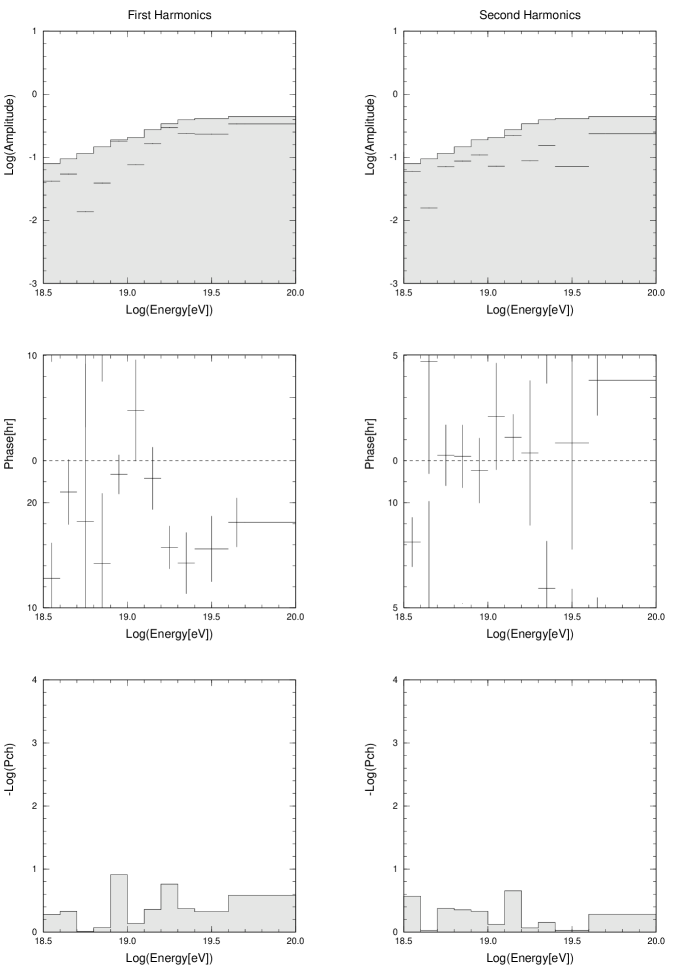
Figure Small-scale anisotropy of cosmic rays above 1019eV observed with the Akeno Giant Air Shower Array shows results of the first (left) and second (right) harmonics in right ascension. The amplitude (top), the phase (middle), and the chance probability (bottom) are shown in each energy bin. In the top panels of the harmonic amplitude, the shaded region is expected from statistical fluctuation of an isotropic distribution with the chance probability larger than 10 %. No significant anisotropy above this level is found above 3.2 1018eV. This is consistent with our previous paper (Hayashida et al. (1998)), in which zenith angles up to 60 were used.
3.1.2 Declination Distribution
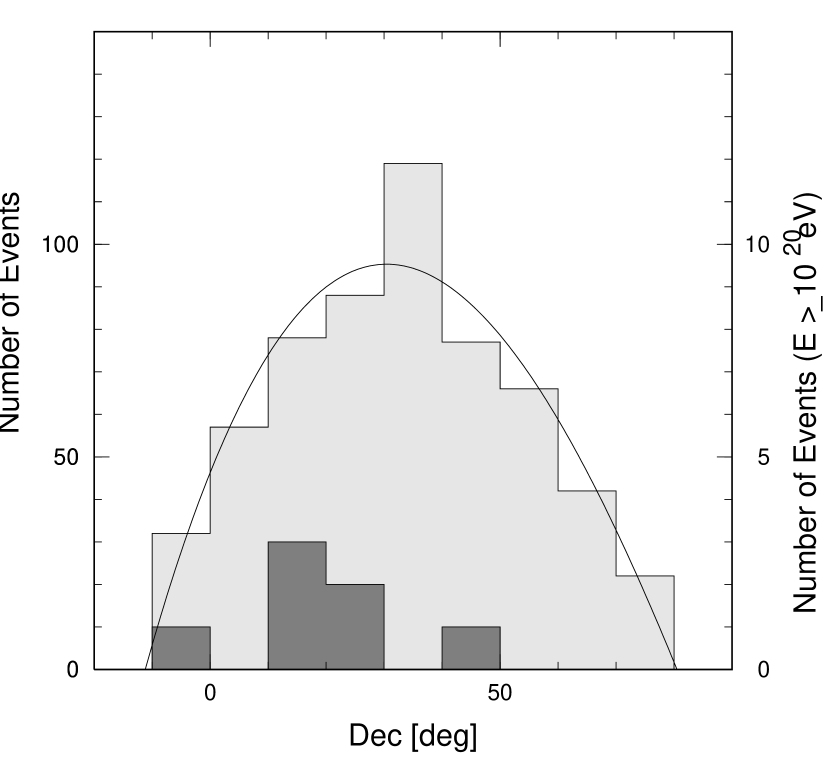
Figure Small-scale anisotropy of cosmic rays above 1019eV observed with the Akeno Giant Air Shower Array shows the declination distribution of events above 1019eV (light shaded histogram) and 1020eV (dark shaded histogram). A solid curve is a third order polynomial function fitted to the light shaded histogram. This curve is consistent with the zenith angle dependence of the AGASA exposure and considered to be the expected distribution if cosmic rays distribute isotropically on the celestial sphere. Since the trigger efficiency is independent of energy above 1019eV and zenith angle less than 45, this distribution is applied to in higher energies. Excess with 2.5 deviation is found in [30, 40] and this will be discussed later.
3.2 Analysis in the Galactic and Supergalactic Coordinates
3.2.1 Galactic and Supergalactic Plane Enhancement
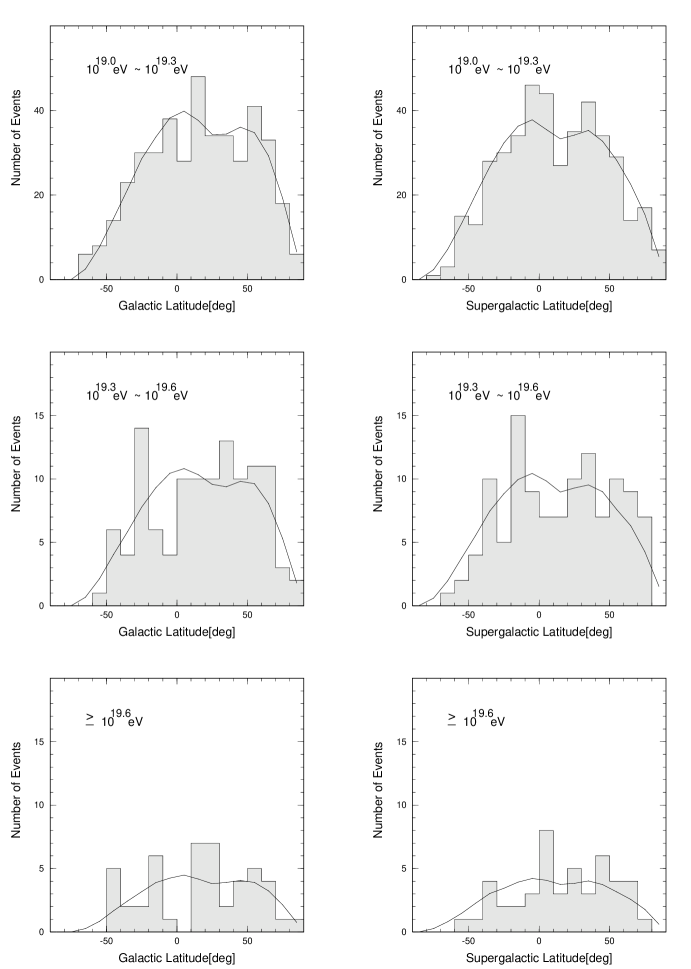
If cosmic rays have origin associating with nearby astrophysical objects, we may expect cosmic-ray anisotropy correlated with the galactic or supergalactic plane. Figure Small-scale anisotropy of cosmic rays above 1019eV observed with the Akeno Giant Air Shower Array shows the latitude distribution on the galactic (left) and supergalactic (right) coordinates in three energy ranges of (1 – 2) 1019eV (top), (2 – 4) 1019eV (middle), and 4 1019eV (bottom). A solid line in each panel indicates the cosmic-ray intensity expected from an isotropic distribution. In order to examine any preference for arrival directions along the galactic and supergalactic planes, the plane enhancement parameter introduced by Wdowczyk and Wolfendale (1984) was used. The value characterizes the anisotropy expressed by:
| (1) |
where is galactic or supergalactic latitude in radians, and are observed and expected intensities at latitude . A positive value suggests a galactic or supergalactic plane enhancement, indicates that arrival direction distribution is isotropic, and a negative shows depression around the plane. Figure Small-scale anisotropy of cosmic rays above 1019eV observed with the Akeno Giant Air Shower Array shows the dependence of on the primary energy for the galactic (left) and supergalactic (right) coordinates. Some excess can be seen around the supergalactic plane in the seventh energy bin ((E[eV]) [19.1, 19.2]), where . In other energies, the arrival direction distribution is consistent with an isotropic distribution.
3.2.2 Distribution
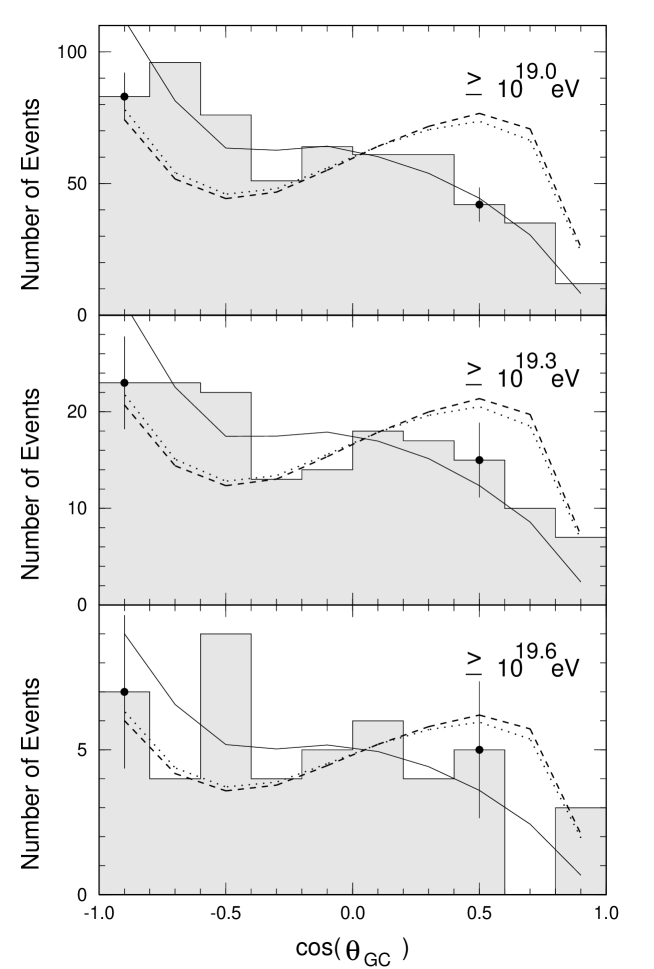
Figure Small-scale anisotropy of cosmic rays above 1019eV observed with the Akeno Giant Air Shower Array shows the () distribution, where is the opening angle between the cosmic-ray arrival direction and the galactic center direction, with energies above 1019eV (top), 2 1019eV (middle), and 4 1019eV (bottom). Histograms are the observed distribution and the solid curves are expected from an isotropic distribution. The observed distribution is consistent with the solid curve in all energy ranges. The dashed and dotted curves are expected from the Dark Matter Halo model (Berezinsky and Mikhailov (1998)) and will be discussed in Section 4.2.
3.3 Significance Map of Cosmic-Ray Excess/Deficit
There is no statistically significant large-scale anisotropy in the above one-dimensional analyses. Here, we search for two-dimensional anisotropy with taking account of the angular resolution event by event.
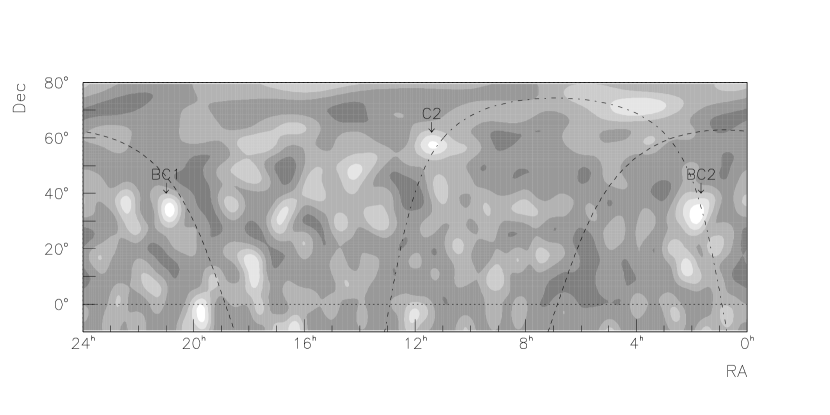
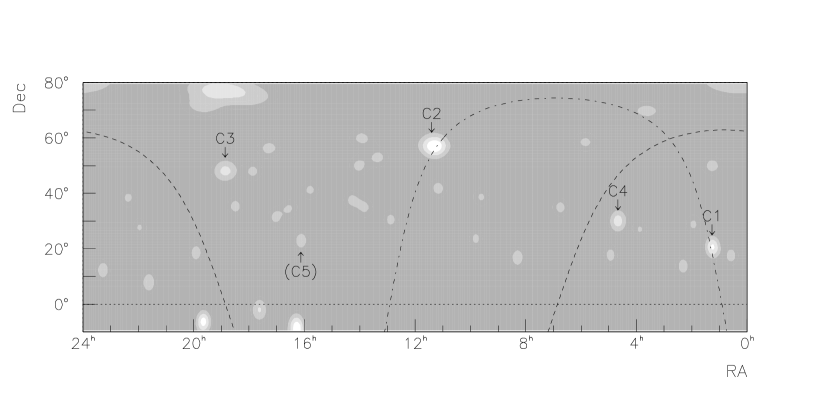
Figures Small-scale anisotropy of cosmic rays above 1019eV observed with the Akeno Giant Air Shower Array and Small-scale anisotropy of cosmic rays above 1019eV observed with the Akeno Giant Air Shower Array show the contour maps of the cosmic-ray excess or deficit with respect to an isotropic distribution above 1019eV and 4 1019eV, respectively. A bright region indicates that the observed cosmic-ray intensity is larger than the expected intensity and a dark region shows a deficit region. For each observed event, we calculate a point spread function which is assumed to be a normalized Gaussian probability distribution with a standard deviation of the angular resolution obtained from Figure Small-scale anisotropy of cosmic rays above 1019eV observed with the Akeno Giant Air Shower Array. The probability densities of all events are folded into cells of 1 1 in the equatorial coordinates. At each cell, we sum up densities within 4.0 radius for Figure Small-scale anisotropy of cosmic rays above 1019eV observed with the Akeno Giant Air Shower Array and 2.5 for Figure Small-scale anisotropy of cosmic rays above 1019eV observed with the Akeno Giant Air Shower Array. These radii are obtained from , and they would make excess regions clearer. The reference distribution is obtained from an isotropic distribution. In these figures, small statistics of observed and expected events result in bright regions at the lower and higher declination and hence bright spots below are not significant. Two distinctive bright regions are found in Figure Small-scale anisotropy of cosmic rays above 1019eV observed with the Akeno Giant Air Shower Array, which are broader than the angular resolution. They are referred to as broad clusters, such as the BC1 (20h50m, 32) and BC2 ( 1h40m, 35). The member events within 4 radius of BC1 are listed in Table 3. Four brighter regions in the middle declination are found in Figure Small-scale anisotropy of cosmic rays above 1019eV observed with the Akeno Giant Air Shower Array: the C1 – C4 clusters which are noted in the eighth column of Table 2. The C1 – C3 clusters follow the notation used in our previous analysis (Hayashida et al. (1996)). The C2 cluster is observed in both energy ranges.
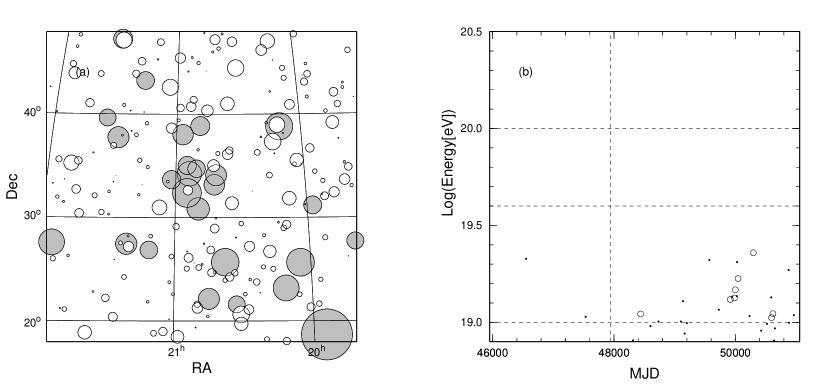
In Figure Small-scale anisotropy of cosmic rays above 1019eV observed with the Akeno Giant Air Shower Array, the contour map has eight steps in [, ]; lower two steps below are absent. The significance of deviation from an isotropic distribution are estimated to be 2.4 at the C2 cluster, 2.7 at the BC1 cluster, and 2.8 at the BC2 cluster. The arrival directions of cosmic rays around the BC1 cluster are shown in Figure Small-scale anisotropy of cosmic rays above 1019eV observed with the Akeno Giant Air Shower Array(a), and a radius of each circle corresponds to the logarithm of its energy. Shaded circles have energies above 1019eV and open circles below 1019eV. Figure Small-scale anisotropy of cosmic rays above 1019eV observed with the Akeno Giant Air Shower Array(b) shows the arrival time – energy relation, and open circles denote members of the BC1 cluster. The members of the BC1 cluster have energies between 1019eV and 2.5 1019eV and no excess of cosmic rays are observed below 1019eV around this direction. Five members of the BC1 cluster are observed around MJD 50,000. This cluster is in the direction of a famous supernova remnant — the Cygnus Loop which extends about 3 around (20h50m, 30 34). The BC2 cluster is the broader cluster without a clear boundary. The BC1 and BC2 clusters contribute the excess around shown in Figure Small-scale anisotropy of cosmic rays above 1019eV observed with the Akeno Giant Air Shower Array. The C2 and BC2 clusters are located near the supergalactic plane and lead the largest value in Section 3.2.1.
For small statistics of observed events, Figure Small-scale anisotropy of cosmic rays above 1019eV observed with the Akeno Giant Air Shower Array reflects the arrival directions of individual events (open squares and open circles in Figure Small-scale anisotropy of cosmic rays above 1019eV observed with the Akeno Giant Air Shower Array). The brightest peak is at the C2 cluster where three cosmic rays are observed against expected 0.05 events. It is possible that some of these clusters are observed by a chance coincidence. It should be noted, however, that two of these clusters — the doublet (C1) including the AGASA highest energy event and the triplet (C2) — lie near the supergalactic plane, as pointed in our previous analysis (Hayashida et al. (1996)). The arrival directions (left) and arrival time – energy relation (right) for the C1 (top) and C2 (bottom) clusters are shown in Figure Small-scale anisotropy of cosmic rays above 1019eV observed with the Akeno Giant Air Shower Array. A radius of each circle in the left panels corresponds to the logarithm of its energy, and open circles in the right panels denote members of the C1 and C2 clusters. Around the C2 cluster, several lower energy cosmic rays are observed very close to the C2 cluster.
3.4 Cluster Analysis
The threshold energy of 4 1019eV is one distinctive energy where the GZK effect becomes large as mentioned in Section 1. It is, however, quite important to examine what kind of dependence on threshold energy is operating.
To begin with, we estimate the chance probability of observing one triplet and three doublets from 47 cosmic rays above 4 1019eV. A cluster of cosmic rays is defined as follows:
-
1.
Define the -th event;
-
2.
Count the number of events within a circle of radius 2.5 centered on the arrival direction of the -th event;
-
3.
If this number of events exceeds a certain threshold value , the -th event is counted as a cluster.
This procedure was repeated for total 47 events and then the total number of clusters with was determined. The chance probability of observing this number of clusters under an isotropic distribution is obtained from the distribution of the number of clusters using 10,000 simulated data sets. These simulated data sets were also analyzed by the same procedure described above. Out of 10,000 simulations, 32 trials had equal or more doublets () than the observed data set, so that . And for triplets ().
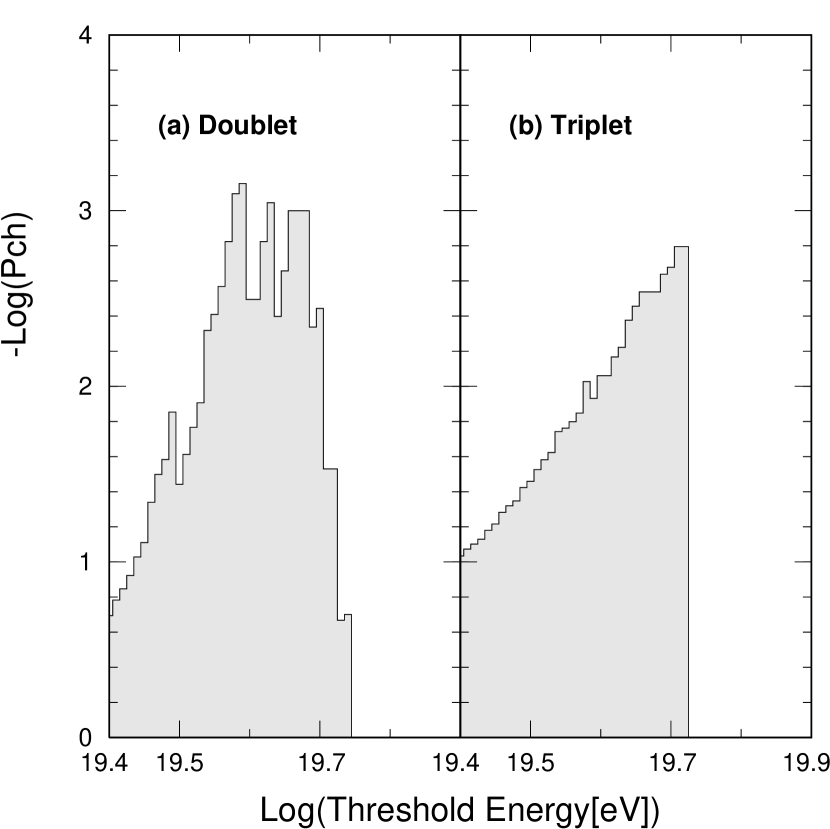
Then, the energy dependence for observing (a) doublets and (b) triplets are estimated and the results are shown in Figure Small-scale anisotropy of cosmic rays above 1019eV observed with the Akeno Giant Air Shower Array. When a new cluster is added above a threshold energy, a histogram changes discontinuously at that energy. At the maximum threshold energy where the triplet is detected, we find 0.16 % in Figure Small-scale anisotropy of cosmic rays above 1019eV observed with the Akeno Giant Air Shower Array(b). The narrow peaks of 0.1 % above 4 1019eV in Figures Small-scale anisotropy of cosmic rays above 1019eV observed with the Akeno Giant Air Shower Array(a) result from the C1, C3 and C4 doublets, and another doublet C5 is found just below 4 1019eV. Here, these chance probabilities are estimated without taking the degree of freedom on the threshold energy into account. However, the chance probabilities are smaller than 1 % and don’t vary abruptly with energies above 4 1019eV. This means that the threshold energy of 4 1019eV for doublet and triplet in Figure Small-scale anisotropy of cosmic rays above 1019eV observed with the Akeno Giant Air Shower Array may indicate any critical energy, and suggests that their sources are not very far being different from those below this energy.
3.5 1020eV Events
Seven events have been observed with energies above 1020eV, and their energies and coordinates are also listed in Table 2. Their declination are near while an isotropic distribution is shown by the solid curve in Figure Small-scale anisotropy of cosmic rays above 1019eV observed with the Akeno Giant Air Shower Array. To check whether these seven events distribute isotropically or not, we compare celestial distribution of seven 1020eV events with that for events between 1019eV and 1020eV in ten different coordinates. The Kolmogorov-Smirnov (KS) test (Press et al. (1988)) was used for avoiding any binning effect. The results are summarized in Table 4. The smallest KS probability in Table 4 is 2.5 % for the declination distribution; but this probability becomes larger using data set above 6.3 1019eV. One interesting feature is that five 1020eV cosmic rays come from south-west of the AGASA array, where the strength of the geomagnetic field component which is perpendicular to an air shower axis is larger than the other directions (Stanev and Vankov (1997)).
4 Discussion
4.1 Comparison with other experiments
Above 3 1018eV, no large-scale anisotropy has been found with the harmonic analysis and the fit. Gillman and Watson (1993) summarized the values using the data sets obtained mainly from the Haverah Park experiment. They obtained no significant deviation from . The result from the Fly’s Eye experiment (Bird et al. (1998)) is consistent with an isotropic distribution of cosmic rays with E 1019eV. The analysis with the Yakutsk data set (Ivanov et al. (1997)) shows no significant galactic plane enhancement above 1018eV. The results from all experiments are consistent with this work on no correlation of cosmic rays above 1019eV with the galactic plane. This may implicate the extragalactic origin of cosmic rays above 1019eV if they are mostly protons.
The BC1, BC2 and C1 – C5 clusters are found with energies 1019eV or 4 1019eV. The C2 and BC2 clusters lead the small preference along the supergalactic plane in the energy range of (E[eV]) [19.1, 19.2]. With the data sets of Haverah Park, Yakutsk, and Valcano Ranch (Uchihori et al. (1996)) and AGASA, another triplet is found at the position of the C1 cluster within experimental error box on arrival direction determination. This triplet at the C1 cluster position includes the AGASA highest energy event and a 1020eV Haverah Park event. It should be noted that these triplets at the C1 and C2 positions are close to the supergalactic plane.
4.2 Correlation with Galactic Halo
Kuzmin and Rubakov (1997) and Berezinsky et al. (1997) have suggested a cosmic-ray source model associated with Dark Matter distribution in our galactic halo. In this model, most energetic cosmic rays are generated through decay of supermassive particles which are trapped in the galactic halo and thus distribute symmetrically around the galactic center. The arrival directions of most energetic cosmic rays, therefore, exhibit anisotropy at the Earth (Berezinsky (1998)). From recent studies by Berezinsky and Mikhailov (1998) and Medina Tanco and Watson (1998), a significant anisotropy would be expected in the first harmonics of right ascension distribution, the amplitude of 40 % at phase about 250, which is independent of the ISO and NFW models of dark matter distribution in the galactic halo. The ISO and NFW models are described in Kravtsov et al. (1997) and Navarro, Frenk and White (1996), respectively. This expected anisotropy is consistent with the results of the harmonic analysis above 4 1019eV as shown in Figure Small-scale anisotropy of cosmic rays above 1019eV observed with the Akeno Giant Air Shower Array. However, this amplitude is explained with statistical fluctuation of an isotropic distribution.
As shown by the dashed and dotted curves in Figure Small-scale anisotropy of cosmic rays above 1019eV observed with the Akeno Giant Air Shower Array, the ISO and NFW models of Dark Matter distribution in the galactic halo lead excess toward the galactic center. Table 5 shows the reduced- values of the observed distribution with the isotropic, ISO and NFW models. Although the distribution expected from the ISO and NFW models are quite different from the observed distribution in energies above 1019eV, the reduced- values are close to one another above 2 1019eV and 4 1019eV. Above 2 1019eV, all three models are acceptable and it is hard to distinguish one from another.
4.3 Correlation with Nearby Galaxies
In Section 3.4, we calculated the chance probability of observing clusters under an isotropic distribution. If cosmic rays are astrophysical source origin, the non-uniform distribution of galaxies or luminous matters should be taken into account, as claimed by Medina Tanco (1998). He calculated trajectories of cosmic rays above 4 1019eV in the intergalactic magnetic field under the assumption that flux of cosmic rays is proportional to the local density of galaxies. The expected distribution of cosmic-ray intensity is no more uniform and this may result in a strong anisotropy. This is different from the results in this paper so that our estimation of the chance probability of observing clusters under an isotropic distribution is experimentally reliable. However, his calculation shows important results: the C2 cluster is on top of a maximum of the arrival probability for sources located between 20 and 50 Mpc; and the C1 cluster locates on a high arrival probability region for sources at more than 50 Mpc. This suggests the possibility that the members of these clusters are generated at different sources. One need accumulate further statistics to make arrival direction, time and energy relation to be clear (Medina Tanco (1998); Sigl and Lemoine (1998)) to distinguish whether the members of clusters come from a single source or unrelated sources.
4.4 Correlation with the Known Astrophysical Objects
As mentioned in Section 3.4, the BC1 cluster is in the direction of the Cygnus Loop (NGC6992/95). From the Hillas confinement condition of (magnetic field size) for cosmic ray acceleration (Hillas (1984)), the magnetic field in the shock of the Cygnus Loop is too small to accelerate cosmic rays up to 1019eV. And the observed energy distribution and bunch of arrival time of the cluster members don’t favor the diffusive shock acceleration. Another possible candidate is PSR 205336 with the period of 0.2215 sec and the magnetic field of about 3 1011 gauss (Manchester and Taylor (1981)). It may be plausible that such highly magnetized pulsar has accelerated cosmic rays up to 1019eV within a short time (Gunn and Ostriker (1969); Goldreich and Julian (1969)). It is highly desired to search for any signals from this direction in other energy range around MJD 50,000.
For the C1 – C5 clusters and 1020eV cosmic rays, coincidence with known astrophysical objects are searched for from three catalogs which are the second EGRET catalog (Thompson et al. (1995, 1996)), the CfA redshift catalog (Huchra et al. (1995)), and the eighth extragalactic redshift catalog (Veron-Cetty and Veron (1998)). The selection criteria are the following: (i) the separation angles within 4.0 from a member of each cluster, and 2.5 for the 1020eV cosmic ray; (ii) the redshift within 0.02. In the CfA catalog, only QSOs/AGNs are selected. Candidate objects are listed in Table 6. Out of these objects, Mrk 40 (VV 141, Arp 151) is an interacting galaxy and may be most interesting. It should be noted that Al-Dargazelli et al. (1996) claimed that nearby colliding galaxies are most favored as the sources of clusters (regions of excess events) defined by them using the world data available before 1996.
5 Summary
In conclusion, there is no statistically significant large-scale anisotropy related to the galactic nor supergalactic plane. The slight supergalactic plane enhancement is observed just above 1019eV and arises mainly from the BC2 and C2 clusters. Above 4 1019eV, one triplet and three doublets are found and the probability of observing these clusters by a chance coincidence is smaller than 1 %. Especially the triplet is observed against expected 0.05 events. Out of these clusters, the C2 (AGASA triplet) and C1 (doublet including the AGASA highest energy event or triplet together with the Haverah Park 1020eV event) clusters are most interesting; they are triplets found in the world data sets and are located near the supergalactic plane. One should wait for the further high-rate observation to distinguish whether the members of clusters come from a single source or different sources. The distribution expected from the Dark Matter Halo model fits the data as well as an isotropic distribution above 2 1019eV and 4 1019eV, but is a poorer fit than isotropy above 1019eV. The arrival direction distribution of the 1020eV cosmic rays is consistent with that of cosmic rays with lower energies and is uniform. It is noteworthy that three of seven 1020eV cosmic rays are members of doublets. The BC1 cluster is in the direction of the Cygnus Loop or PSR 205336 region. It is desirable to examine any signals from this direction in other energy band around MJD 50,000. We hope other experiments in TeV – PeV regions to explore the C1 – C5 clusters and 1020eV cosmic ray directions.
References
- Al-Dargazelli et al. (1996) Al-Dargazelli, S. S. et al. 1996, J. Phys. G: Nucl. Phys., 22, 1825.
- Berezinsky and Grigor’eva (1988) Berezinsky, V., and Grigor’eve, S. I. 1988, A&A, 199, 1.
- Berezinsky, Kachelriess and Vilenkin (1997) Berezinsky, V., Kachelriess, M, and Vilenkin, A. 1997, Phys. Rev. Lett., 79 4302.
- Berezinsky (1998) Berezinsky, V. 1998, Nucl. Phys. Proc. Suppl., 70, 419.
- Berezinsky and Mikhailov (1998) Berezinsky, V., and Mikhailov, A. 1998, astro-ph/9810277
- Bhattacharjee and Sigl (1998) Bhattacharjee, P., and Sigl, G. 1998, astro-ph/9811011
- Biermann and Strittmatter (1987) Biermann, P. L., and Strittmatter, P. A., 1987, ApJ, 322, 643.
- Bird et al. (1994) Bird, D. J. et al. 1994, ApJ, 424, 491.
- Bird et al. (1998) Bird, D. J. et al. 1998, astro-ph/9806096.
- Blandford (1976) Blanford., R. D., 1976, MNRAS, 176, 465.
- Chiba et al. (1992) Chiba, N. et al. 1992, Nucl. Instr. and Meth., A 311, 338.
- Efimov et al. (1986) Efimov, N. N. et al. 1988, Catalogue of Highest Energy Cosmic Rays, p.16.
- Efimov et al. (1991) Efimov, N. N. et al. 1991, Astrophysicsal Aspects of the Most Energetic Cosmic Rays, eds. M. Nagano and F. Takahara (World Scientific) p.20.
- Gillman and Watson. (1993) Gillman, M. S., and Watson, A. A. 1993, Proc. 23rd ICRR (Calgary), 2, 47.
- Goldreich and Julian (1969) Goldreich, P., and Julian, W. H. 1969 ApJ, 157, 869.
- Greisen (1966) Greisen, K., 1966, Phys. Rev. Lett., 16 748.
- Gunn and Ostriker (1969) Gunn, J. E., and Ostriker, J. P. 1969, Phys. Rev. Lett., 22, 728.
- Hayashida et al. (1996) Hayashida, N. et al. 1996, Phys. Rev. Lett., 77, 1000.
- Hayashida et al. (1998) Hayashida, N. et al. 1998, Astroparticle Physics, to be published.
- Hill and Schramm (1985) Hill, C. T., and Schramm, D. N. 1985, Phys. Rev. D, 31, 564.
- Hillas (1984) Hillas, A. M., 1984, ARA&A, 22, 425.
- Huchra et al. (1995) Huchra, J. P. et al. 1995, Harvard-Smithsonian Center for Astrophysics.
- Ivanov et al. (1997) Ivanov, A. A. et al. 1997, Prog. of 24th ICRC (Durban) OG6.3.6.
- Ivanov (1998) Ivanov, A. A. 1998, J. Phys. G: Nucl. Phys., 24, 227.
- Kang, Rachen and Biermann (1997) Kang, H., Rachen, P., and Biermann, P. L. 1997, MNRAS, 286, 257.
- Kewley, Clay and Dawson (1996) Kewley, L. J., Clay, R. W., and Dawson, B. R. 1996, Astroparticle Physics, 5, 69.
- Kravtsov et al. (1997) Kravtsov, A. V. et al. 1998, ApJ, 502, 48.
- Kuzmin and Rubakov (1997) Kuzmin, V. A., and Rubakov, V. A., 1998, Phys. Atom. Nucl. 61, 1028. [Yad. Fiz. 61, 1122]
- Lawrence, Reid and Watson (1991) Lawrence, M. A., Reid, R. J. O., and Watson, A. A. 1991, J. Phys. G: Nucl. Phys., 17, 733.
- Linsley (1980) Linsley, J. 1980, Catalogue of Highest Energy Cosmic Rays, p.44.
- Lovelace (1976) Lovelace, R. V. E., 1976, Nature, 262, 649.
- Manchester and Taylor (1981) Manchester, R.N. and Taylor, J. H. 1981, ApJ. 86, 1953.
- Medina Tanco (1998) Medina Tanco, G. A. 1998, astro-ph/9801060.
- Medina Tanco and Watson (1998) Medina Tanco, G. A., and Watson, A. A. 1998, Astroparticle Physics, to be published.
- Navarro, Frenk and White (1997) Navarro, J. F., Frenk, C. S., and White S. D. M. 1997, ApJ, 490, 493.
- Ohoka et al. (1997) Ohoka, H. et al. 1997, Nucl. Instr. and Meth., A 385, 268.
- Ostrowski (1998) Ostrowski, M., 1998, A&A, 335, 134.
- Press et al. (1988) Press, W. H. et al. 1988, in NUMERICAL RECIPES in C, (Cambridge University Press).
- Rachen and Biermann (1993) Rachen, P., and Biermann, P. L. 1993, A&A, 272, 161.
- Rees et al. (1982) Rees, M. J. et al. 1982, Nature, 295, 17.
- Sigl and Lemoine (1998) Sigl, G., and Lemoine, M. 1998, Astropart. Phys. 9, 65.
- Stanev et al. (1995) Stanev, T. et al. 1995, Phys. Rev. Lett., 75, 3056.
- Stanev and Vankov (1997) Stanev, T., and Vankov, H. P. 1997, Phys. Rev. D, 55, 1365.
- Szabelski, Wdowczyk and Wolfendale (1986) Szabelski, J., Wdowczyk, J., and Wolfendale, A. W. 1986, J. Phys. G: Nucl. Phys., 12, 1433.
- Takahara (1990) Takahara, F., 1990, Prog. Theor. Phys., 83, 1071L.
- Takeda et al. (1998) Takeda, M. et al. 1998, Phys. Rev. Lett., 81, 1163.
- Teshima et al. (1986) Teshima, M. et al. 1986, Nucl. Instr. and Meth., A 247, 399.
- Thompson et al. (1995) Thompson, D. J. et al. 1995, ApJS, 101, 259.
- Thompson et al. (1996) Thompson, D. J. et al. 1996, ApJS, 107, 227.
- Uchihori et al. (1996) Uchihori, Y. et al. 1996, Proc. Int. Symposium on Extremely High Energy Cosmic Rays: Astrophysics and Future Observations, edited by M. Nagano (Inst. of Cosmic Ray Research, University of Tokyo), p.50.
- Veron-Cetty and Veron (1998) Veron-Cetty, M. P., and Veron, P. 1998, ESO Scientific Report 18.
- Vietri (1995) Vietri, M., 1995, ApJ, 453, 883.
- Waxmann (1995) Waxman, E., 1995, Phys. Rev. Lett., 75, 386.
- Winn et al. (1986) Winn, M. M. et al. 1986, Catalogue of Highest Energy Cosmic Rays, p.68.
- Wdowczyk and Wolfendale (1984) Wdowczyk, J., and Wolfendale, A. W. 1984, J. Phys. G: Nucl. Phys., 10, 1453.
- Yoshida and Teshima (1993) Yoshida, S., and Teshima, M. 1993, Prog. Theor. Phys. 89, 833.
- Yoshida et al. (1995) Yoshida, S. et al. 1995, Astropart. Phys. 3, 105.
- Zatsepin and Kuz’min (1966) Zatsepin, G. T., and Kuz’min, V. A. 1966, Zh. Eksp. Teor. Fiz., 4, 114 [JETP Letters, 4, 78].
Accuracy on arrival direction determination. Closed and open circles are the opening angles encompassed 68 % and 90 % data.
Arrival directions of cosmic rays with energies above 1019.0eV on the (a) equatorial and (b) galactic coordinates. Dots, open circles, and open squares represent cosmic rays with energies of (1 – 4) 1019eV, (4 – 10) 1019eV, and 1020eV, respectively. The galactic and supergalactic planes are shown by the dotted curves. “GC” designates the galactic center.
Results of the harmonic analysis. (Top to bottom, the amplitude, the phases and the chance probabilities of the first (left) and second (right) harmonics.)
Declination distribution of the observed cosmic rays. (Light shaded histogram: 1019eV. Dark shaded histogram: 1020eV, the right-had vertical axis should be referred.)
Galactic (left) and supergalactic (right) latitude distribution. (Top: (1 – 2) 1019eV. Middle: (2 – 4) 1019eV. Bottom: 4 1019eV.)
Dependence of the plane enhancement factor on the energy. (Left: for the galactic coordinates. Right: for the supergalactic coordinates)
distribution. (Top: 1019eV. Middle: 2 1019eV. Bottom: 4 1019eV.) Here, is the opening angle between the cosmic-ray direction and the galactic center direction, with energies 1019eV (top), 2 1019eV (middle), and 4 1019eV (bottom). The solid, dashed and dotted curves indicate the distribution expected for the isotropic, ISO and NFW models, respectively.
Significance map of cosmic-ray excess/deficit above 1019eV. The dashed and dash-dotted curve indicate the galactic and supergalactic plane, respectively.
Significance map of cosmic-ray excess/deficit above 4 1019eV. The dashed and dash-dotted curve indicate the galactic and supergalactic plane, respectively.
BC1 cluster. (a) Arrival directions of cosmic rays around the BC1 cluster. Radius of each circle corresponds to (E[eV]), and shaded and open circles have energies above 1019eV and between 3 1018eV and 1019eV, respectively. (b) Arrival time – energy relation. Open circles denote members of the BC1 cluster and dots are cosmic rays near the BC1 cluster. After the vertical dotted line, A20 is combined into AGASA.
Arrival directions and arrival time – energy relation for the C1 and C2 clusters. Here, cosmic rays above 1019eV are plotted. (See also Figure 10)
Energy dependence of the chance probability of observing (a) doublets and (b) triplets.
| Array | 1019eV | 4 1019eV | 1020eV |
|---|---|---|---|
| A20 | 59 | 7 | 0 |
| AGASA | 522 | 40 | 7 |
| Total | 581 | 47 | 7 |
| Date | Time(JST) | Energy | Coordinates11The celestial coordinates are based on the J2000.0 coordinates. | Note | |||
|---|---|---|---|---|---|---|---|
| 84/12/12 | 14:18:02 | 6.81 1019 eV | 22h 21m | 38.4∘ | 93.3∘ | 15.7∘ | |
| 84/12/17 | 10:28:16 | 9.79 | 18h 29m | 35.3∘ | 63.5∘ | 19.4∘ | |
| 86/01/05 | 19:31:03 | 5.47 | 4h 38m | 30.1∘ | 170.4∘ | 11.2∘ | C4 |
| 86/10/23 | 14:25:15 | 6.22 | 14h 02m | 49.9∘ | 96.8∘ | 63.4∘ | |
| 87/11/26 | 17:49:20 | 4.82 | 21h 57m | 27.6∘ | 82.1∘ | 21.1∘ | |
| 89/03/14 | 02:45:39 | 5.27 | 13h 48m | 34.7∘ | 68.3∘ | 75.6∘ | |
| 89/08/16 | 08:32:01 | 4.07 | 5h 51m | 58.5∘ | 154.5∘ | 15.6∘ | |
| 90/11/25 | 11:05:39 | 4.51 | 16h 17m | 7.2∘ | 6.1∘ | 29.6∘ | |
| 91/04/03 | 00:32:40 | 5.09 | 15h 47m | 41.0∘ | 65.7∘ | 51.5∘ | |
| 91/04/20 | 08:24:49 | 4.35 | 18h 59m | 47.8∘ | 77.9∘ | 18.4∘ | C3 |
| 91/05/31 | 13:07:04 | 5.53 | 3h 37m | 69.5∘ | 136.6∘ | 11.2∘ | |
| 91/11/29 | 14:53:03 | 9.10 | 19h 06m | 77.2∘ | 108.8∘ | 25.6∘ | |
| 91/12/10 | 18:59:10 | 4.24 | 0h 12m | 78.6∘ | 121.0∘ | 15.9∘ | |
| 92/01/07 | 03:16:49 | 4.51 | 9h 36m | 38.6∘ | 184.3∘ | 48.0∘ | |
| 92/01/24 | 12:26:17 | 4.88 | 17h 52m | 47.9∘ | 74.8∘ | 29.4∘ | |
| 92/02/01 | 17:20:52 | 5.53 | 0h 34m | 17.7∘ | 117.2∘ | 45.0∘ | |
| 92/03/30 | 03:05:30 | 4.47 | 17h 03m | 31.4∘ | 53.6∘ | 35.6∘ | |
| 92/08/01 | 13:00:47 | 5.50 | 11h 29m | 57.1∘ | 143.2∘ | 56.6∘ | C2 |
| 92/09/13 | 08:59:44 | 9.25 | 6h 44m | 34.9∘ | 180.5∘ | 13.9∘ | |
| 93/01/12 | 02:41:13 | 10.122The energies are re-evaluated after the system response have been checked in October 1997. | 8h 17m | 16.8∘ | 206.7∘ | 26.4∘ | |
| 93/01/21 | 07:58:06 | 4.46 | 13h 55m | 59.8∘ | 108.8∘ | 55.5∘ | |
| 93/04/22 | 09:39:56 | 4.42 | 1h 56m | 29.0∘ | 139.8∘ | 31.7∘ | |
| 93/06/12 | 06:14:27 | 6.49 | 1h 16m | 50.0∘ | 127.0∘ | 12.7∘ | |
| 93/12/03 | 21:32:47 | 21.3 | 1h 15m | 21.1∘ | 130.5∘ | 41.4∘ | C1 |
| 94/07/06 | 20:34:54 | 13.4 | 18h 45m | 48.3∘ | 77.6∘ | 20.9∘ | C3 |
| Date | Time(JST) | Energy | Coordinates | Note | |||
|---|---|---|---|---|---|---|---|
| 94/07/28 | 08:23:37 | 4.08 1019 eV | 4h 56m | 18.0∘ | 182.8∘ | 15.5∘ | |
| 95/01/26 | 03:27:16 | 7.76 | 11h 14m | 57.6∘ | 145.5∘ | 55.1∘ | C2 |
| 95/03/29 | 06:12:27 | 4.27 | 17h 37m | 1.6∘ | 22.8∘ | 15.7∘ | |
| 95/04/04 | 23:15:09 | 5.79 | 12h 52m | 30.6∘ | 117.5∘ | 86.5∘ | |
| 95/10/29 | 00:32:16 | 5.07 | 1h 14m | 20.0∘ | 130.2∘ | 42.5∘ | C1 |
| 95/11/15 | 04:27:45 | 4.89 | 4h 41m | 29.9∘ | 171.1∘ | 10.8∘ | C4 |
| 96/01/11 | 09:01:21 | 14.4 | 16h 06m | 23.0∘ | 38.9∘ | 45.8∘ | C5 |
| 96/01/19 | 21:46:12 | 4.80 | 3h 52m | 27.1∘ | 165.4∘ | 20.4∘ | |
| 96/05/13 | 00:07:48 | 4.78 | 17h 56m | 74.1∘ | 105.1∘ | 29.8∘ | |
| 96/10/06 | 13:36:43 | 5.68 | 13h 18m | 52.9∘ | 113.8∘ | 63.7∘ | |
| 96/10/22 | 15:24:10 | 10.5 | 19h 54m | 18.7∘ | 56.8∘ | 4.8∘ | |
| 96/11/12 | 16:58:42 | 7.46 | 21h 37m | 8.1∘ | 62.7∘ | 31.3∘ | |
| 96/12/08 | 12:08:39 | 4.30 | 16h 31m | 34.6∘ | 56.2∘ | 42.8∘ | |
| 96/12/24 | 07:36:36 | 4.97 | 14h 17m | 37.7∘ | 68.5∘ | 69.1∘ | |
| 97/03/03 | 07:17:44 | 4.39 | 19h 37m | 71.1∘ | 103.0∘ | 21.9∘ | |
| 97/03/30 | 07:58:21 | 15.0 | 19h 38m | 5.8∘ | 33.1∘ | 13.1∘ | |
| 97/04/28 | 13:46:18 | 4.20 | 2h 18m | 13.8∘ | 152.9∘ | 43.9∘ | |
| 97/11/20 | 07:23:25 | 7.21 | 11h 09m | 41.8∘ | 171.2∘ | 64.6∘ | |
| 98/02/06 | 00:12:26 | 4.11 | 9h 47m | 23.7∘ | 207.2∘ | 48.6∘ | |
| 98/03/30 | 08:17:26 | 6.93 | 17h 16m | 56.3∘ | 84.5∘ | 35.3∘ | |
| 98/04/04 | 20:07:03 | 5.35 | 11h 13m | 56.0∘ | 147.5∘ | 56.2∘ | C2 |
| 98/06/12 | 06:43:49 | 12.0 | 23h 16m | 12.3∘ | 89.5∘ | 44.3∘ | |
| 97/04/10 | 02:48:48 | 3.89 | 15h 58m | 23.7∘ | 39.1∘ | 47.8∘ | C5 |
| Name | Date | Energy | Coordinates11The celestial coordinates are based on the J2000.0 coordinates. | |||
|---|---|---|---|---|---|---|
| BC1 | 95/10/09 | 1.47 1019eV | 20h 50m | 30.8 | 73.9 | 8.2 |
| 95/11/23 | 1.68 | 20h 54m | 34.2 | 77.1 | 6.8 | |
| 95/07/18 | 1.31 | 20h 42m | 33.2 | 74.8 | 5.5 | |
| 95/09/24 | 1.33 | 20h 41m | 34.1 | 75.4 | 4.8 | |
| 91/07/02 | 1.10 | 20h 55m | 35.1 | 77.9 | 6.4 | |
| 96/08/02 | 2.29 | 20h 55m | 32.4 | 75.9 | 8.1 | |
| 97/05/28 | 1.06 | 20h 50m | 34.7 | 77.1 | 5.9 | |
| 97/06/20 | 1.11 | 21h 02m | 33.7 | 77.8 | 8.4 | |
| BC2 | 1h 40m | 35 | 134 | 27 | ||
| KS-Probability | KS-Probability | |||
|---|---|---|---|---|
| Azimuth Angle () | 0.268 | Zenith Angle () | 0.867 | |
| Right Ascension () | 0.202 | Declination () | 0.025 | |
| Ecliptic Longitude | 0.085 | Ecliptic Latitude | 0.449 | |
| Galactic Longitude () | 0.182 | Galactic Latitute () | 0.540 | |
| Supergalactic Longitude () | 0.654 | Supergalactic Latitude () | 0.167 |
| 1019eV | 2 1019eV | 4 1019eV | |
|---|---|---|---|
| isotropic distribution | 2.0 | 1.7 | 1.8 |
| ISO model | 11.8 | 2.2 | 1.7 |
| NFW model | 10.0 | 1.9 | 1.6 |
| Event ID | Astrophysical object |
|---|---|
| C1 | Mrk 359 (z 0.017) |
| C2 | NGC 3642 (z 0.005), Mrk 40 (z 0.02), Mrk 171 (z 0.01) |
| 970330 (1.5 1020eV) | H 1934063 (z 0.011) |