ISOCAM EXTRAGALACTIC MID-INFRARED DEEP SURVEYS UNVEILING DUST-ENSHROUDED STAR FORMATION IN THE UNIVERSE
Abstract
ISOCAM extragalactic mid-infrared deep surveys have detected a
population of strong infrared emitters ten times more numerous than
expected if there were no evolution from z 0.2 (IRAS) up to the
maximum redshift of these galaxies (z1.5). The mid-infrared
cosmic background produced by these galaxies (, at 15 m above 50 Jy) is larger
than 30 per cent of the energy radiated in the I band by the optical
galaxies detected in the HDF, which are two orders of magnitude more
numerous. This fraction is much higher than in the local universe
(z0.2) as probed by IRAS, where all integrated infrared emission
from 8 to 1000 m makes 30 per cent of the optical starlight
(Soifer Neugebauer 1991). Even assuming a conservative spectral
energy distribution (SED), they produce a major contribution to the
140 DIRBE background measured by Hauser (1998,
) and Lagache (1999,
). This is both a confirmation of
the strong infrared cosmic background that was first detected by Puget
(1996) and the first identification of the galaxies
responsible for a large fraction of this background at 140 m.
We were able to identify the galaxies responsible for this strong
infrared emission in the region of the Hubble Deep Field (HDF plus its
flanking fields) due to the large number of ground-based observations
of HDF galaxies. We find that these bright (several times
) and massive () infrared galaxies have a typical redshift of
z0.7 and optical colors similar to field galaxies. The
fraction of galaxies with morphological signs of interactions is
larger at higher redshift. This is consistent with the nature of local
luminous infrared galaxies (LIGs, with ) found by IRAS, which often exhibit evidence
of galaxy interaction or merging (Sanders Mirabel 1996) and
indicates that interactions should play a crucial role in the
evolution of galaxies as expected from bottom-up scenarios.
Keywords: cosmological surveys; mid-infrared; galaxy evolution.
1. INTRODUCTION
Early-type galaxies and the central bulges of spirals are expected to have rapidly converted most of their primordial gas into stars as indicated by their red colors, typical of old stellar populations, and the lack of remaining fuel to entertain new star formation. The bulk of these stars was therefore expected to have formed during a major episode of star formation and the distant galaxies which should have experienced this process were called ’primeval’ galaxies. The failure of optical searches for such primeval galaxies, expected to exhibit strong Ly- emission lines (Djorgovski Thompson 1992), was interpreted with the help of two scenarios which are not mutually exclusive. On one hand, the predictions of bottom-up cosmological scenarios of galaxy formation (White Frenk 1991) and the observational evidence for merging galaxies, suggest that primeval galaxies simply do not exist, because galaxy formation is a continuous process. On the other hand, strong dust extinction could have masked these major episodes of star formation so that primeval galaxies should be found in infrared surveys (Franceschini 1991, 1994).
Optical surveys found a strong evolution of the population of blue galaxies as a function of redshift for galaxies below z=1 (Canada-France Redshift Survey, CFRS, Lilly et al. 1995, Hammer et al. 1997). At larger redshifts, Steidel (1996) used the U and B drop out technique to select galaxies at redshifts 3 and 4 from their broad-band colors. Madau (1996) translated these observations into a famous plot showing the average star formation history of the universe, which could also be seen as the universal history of an ideal galaxy. In this plot, the formation of stars per cubic megaparsec of the universe was expected to peak at a redshift close to 1 and then decrease at larger redshifts. However, when observed spectroscopically, the drop-out galaxies were found to exhibit a flat spectrum in the UV, indicative of a strong dust extinction which could lead to an underestimation of the associated star formation rates (SFR) of these galaxies by a factor of three and maybe even as much as ten (Pettini 1997, Meurer 1997).
In the local universe, direct infrared observations from IRAS (Soifer Neugebauer 1991) showed that the infrared luminosity from 8 to 1000 m of galaxies is about 30 per cent of that from starlight. The population of LIGs only produce about 6 per cent of this integrated infrared emission. Hence, although the detection by IRAS of LIGs, which appeared to be the strongest starbursts ever detected, was legitimately considered as a breakthrough, it was not supposed to change our understanding of the history of star formation because of the marginal proportion of stars born in these galaxies. However, analyses of IRAS extragalactic source counts showed evidence for strong evolution at low flux levels for ULIGs (ultra-LIGs, , Hacking 1987, Lonsdale Hacking 1989, Lonsdale 1990). More recently, Kim Sanders (1998) found a very strong density evolution for ULIGs with a 60 m flux between 0.5 Jy and 1.5 Jy of the form . This result was only tentative because of the small redshift range sampled by IRAS luminous galaxies (z0.27), but it is an indication that ULIGs and maybe also LIGs should have played a stronger role in the past. The second argument in favor of such an evolution was found by Puget et al. (1996) who detected a strong cosmic infrared background (CIRB) in the 300 m to 1 mm range in the COBE-FIRAS data. This result was then confirmed by Guiderdoni (1997) and by a positive detection at lower wavelength using another instrument on-board COBE, DIRBE. The exact value of the COBE-DIRBE CIRB at 140 m is still a matter of debate (Hauser et al. 1998, find a value of , while Lagache et al. 1999, find ), but most importantly its existence is now confirmed by independant teams and suggests that the rest-frame infrared emission of galaxies is much higher at high redshift than estimated locally (z0.2) by IRAS.
Several cosmological surveys have been performed with ISOCAM, on-board ISO, in directions of low zodiacal and Galactic cirrus mid-infrared emission, ranging from large and shallow ones (several square degrees, complete down to 2 mJy) to narrow and very deep ones (a few square arc-minutes, complete down to 50 Jy). These surveys were performed in the two main broad-band filters of ISOCAM: the 6.75 m LW2 filter and the 15 m LW3 filter, respectively centered on the rest-frame parts of the SED which are dominated by aromatic features (7 m band) and by the thermal emission of very small dust grains (VSGs). We will show in the following that with a thousand times better sensitivity and sixty times better spatial resolution than IRAS, ISOCAM mid-infrared extragalactic surveys have unveiled most of the star formation in the universe below z1 and identified most of the galaxies contributing to the COBE-FIRAS 140 m cosmic background. The galaxies responsible for most of the mid-infrared light are located at z0.7 and have a bolometric luminosity larger than . We will discuss this result considering the role of interactions and comparing the relative roles of star formation and Active Galaxy Nuclei (AGN) activities.
2. ORIGIN OF THE MID-IR EMISSION AND K-CORRECTION
The rest frame mid-IR emission of galaxies can be divided into three components:
-
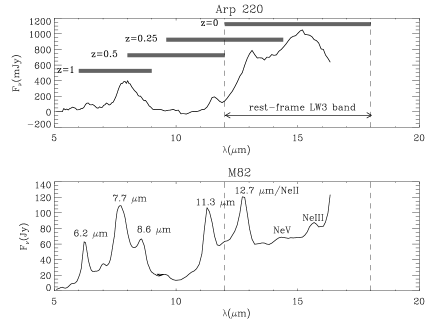
UIBs: the Unidentified Infrared Bands (UIBs), detected at 6.2, 7.7, 8.6, 11.3 and 12.7 m as well as their underlying continuum, dominate the mid-IR emission below 12 m (see figure 1). The carriers of these UIBs are proposed to be aromatic carbon species such as PAHs (Polycylic Aromatic Hydrocarbons, Léger Puget 1984, Puget Léger 1989, Allamandola 1989) or coal grains (Papoular 1991). Below 12 m, where the SED is dominated by the UIBs, the intensity of the interstellar radiation field produces only small changes in the shape of the spectrum. This is strong indication that the carriers of the UIBs are transiently heated by the absorption of individual photons (Boulanger 1998).
-
Warm dust (T150 K): Very Small Grains (VSGs) of dust heated by optical-UV photons emitted by stars produce a continuum at (Désert 1990).
-
Forbidden lines of ionized gas: NeII (12.8 m), NeIII (15.6 ), SIV (10.5 m), ArII (7 m). These lines are good indicators of the star formation activity, particularly the NeIII/NeII ratio, which is correlated to the temperature of the stars ionizing the ISM.
For local galaxies, the LW2 (5-8.5 m) and LW3 (12-18 m) filters measure respectively the MIR emission due to UIBs and to VSGs (emission lines are negligible in these broad-band filters). The LW3 band becomes more and more dominated by UIBs with increasing redshift, due to k-correction (see figure 1). At z1, the effective LW3 band corresponds to the rest-frame LW2 band typically, so it probes UIBs, not hot dust, and above z1.5, dust emission (UIBs + VSGs) becomes too faint to be detected by ISOCAM.

The k-corrections for the SED of M82 and Arp 220 have been plotted in figure 2. A galaxy with an SED like M82, or Arp 220, will be fainter in with increasing redshift up to a redshift of typically z0.4-0.5. Above this redshift, however, the k-correction will become negative, i.e. the galaxy will appear brighter, due to the entrance of the UIBs into the LW3 band, with a maximum around z0.7. Indeed, in very deep ISOCAM surveys, like in the HDF field, we will see that most of the galaxies are located above z=0.4, with a mean redshift of z=0.7. Above a redshift of z1.4, the k-correction falls rapidly, which explains why there is a cut-off in the redshift distribution of ISOCAM galaxies.
The MIR emission of a galaxy is correlated with its star formation activity as illustrated by the case of the Antennae galaxy (Vigroux 1996, Mirabel 1998). Most of the star formation in this system, as probed by ISOCAM, takes place in a source lying in the overlapping region of the two interacting galaxies, NGC 4038/4039. This source is optically faint and most of the optical emission arises from the two galactic nuclei. In this case, one would underestimate the SFR when using only the optical-UV part of the SED. It is not straightforward, however, to estimate a star formation rate in starburst regions with good precision using only the MIR flux of a galaxy. Indeed, the MIR results from a mixture of stochastic heating (UIBs) and thermal emission at high temperature (VSGs), while the FIR results from thermal emission of big grains at lower temperature. However, assuming that the physics of local galaxies is representative of that of more distant ones, one can still compare the properties of local and distant galaxies in order to quantify the evolution of galaxies.
3. DESCRIPTION OF THE ISOCAM EXTRAGALACTIC SURVEYS
| Region | Name | area | [Fmin,Fmax] | texp | CIRB |
|---|---|---|---|---|---|
| (mJy) | ksec | ||||
| A2390 | Ultra-Deep Survey | 6.8 arcmin2 | [0.05,0.2] | 5-25 | 10.4 (43 ) |
| [0.03,0.2] | 5-25 | 20.9 (60 ) | |||
| HDF-North | Ultra-Deep Survey | 27.4 arcmin2 | [0.1,0.3] | 6.4-19.2 | 0.70.3 (30 ) |
| Marano Field | Ultra-Deep Survey | 49 arcmin2 | [0.1,1.0] | 5.4-9.7 | 1.350.5 (57 ) |
| Lockman Hole | Deep Survey | 484 arcmin2 | [0.4,1.5] | 0.9 | 0.50.2 (21 ) |
| Lockman Hole | Shallow Survey | 0.45 deg2 | [1.2,5] | 0.18 | 0.20.1 (9 ) |
| ELAIS fields | Very Shallow Survey | 12 deg2 | [2,50] | 20 sec | 0.20.1 (9 ) |
Before the launch of ISO, there was a great deal of discussion about the best strategy that would both optimize the instrument capabilities and the scientific outcome of the ISOCAM mid-infrared extragalactic surveys. Large surveys would have to be shallow because they are time consuming. They would probe the brightest objects at large distances and would otherwise give good statistics for nearby objects. Pencil beams could go much deeper, although limited by the confusion limit of a 60-cm telescope, and could probe a comparable volume of the universe, with a large extent over redshift or time. Because there was no obvious answer to this question, Guaranteed Time deep surveys were divided into a shallow survey, a deep survey and an ultra-deep survey, and in order to be less biased by large-scale structures, it was decided to perform these two types of surveys in the northern (Lockman Hole) and in the southern (Marano Field) hemispheres. These fields were obviously chosen because of their low foreground Galactic emission (low zodiacal and cirrus emission) but also because they were already covered at other wavelengths and in particular in the X-ray by ROSAT and now other satellites. We will see in the next section that this choice was beneficial. It allowed us to achieve good statistics over a large flux range and in particular around 1 mJy where we found a rapid change in the slope of the number counts. The use of the lensing magnification of galaxies in the line of sight of galaxy clusters, like A2390 (Altieri 1998, see also Metcalfe , these proceedings), allowed us to complete the number counts below 100 .
These surveys were complemented by other surveys from the ISO Open Time. The European Large Area Infrared Survey (ELAIS, european consortium of 19 institutes lead by M.Rowan-Robinson, see these proceedings), for sources above 2 mJy, and the ISOCAM-HDF (P.I. M.Rowan-Robinson, Rowan-Robinson 1997, Aussel 1999, Désert 1999) which improved the log N-log S and allowed us to identify the galaxies responsible for the infrared excess (Aussel these proceedings).
Finally, the combination of all surveys is statistically significant from 50 Jy up to 50 mJy and even 300 mJy, including IRAS (see Table 1). Hence they cover four orders of magnitude in flux and therefore give a very strong constraint on the evolution of galaxies in the universe below typically z1.4 (upper limit due to k-correction). We have only mentioned in Table 1 those surveys used to derive the log N-log S presented in this paper. Column 3 gives the total area covered by each survey. The depth of the surveys is not homogeneous over this total area but the variation of the signal-to-noise ratio as a function of the position in the mosaic was taken into account in the source detection and in the determination of the number counts. Column 4, [Fmin,Fmax], gives the flux range over which the number of detections is statistically significant. Column 5, texp, gives the exposure time per sky position, i.e. after co-addition of all pixels which observed the same position on the sky. This exposure time depends on the number of redundancies for this given position and was summarized with two numbers when a large fraction of the image is seen at very different depths. The last column gives the integrated contribution of the sources detected in each survey to the 15 m cosmic background, i.e. 2.350.8 above the 0.05 mJy level, or the less statistically significant value of 3.31.3 above 0.03 mJy. Other ISOCAM extragalactic surveys were performed during ISO lifetime: Taniguchi (1997) made an ultra-deep survey of the Lockman Hole in the LW2 7 m band, a new ISOCAM-HDF observation was performed on the southern HDF field (P.I. M.Rowan-Robinson, Oliver 1999) and both a deep and a second ultra-deep survey were also performed on the Marano Field (P.I. C.Cesarsky). Finally, one of the CFRS fields at 1415+52 was also covered by ISOCAM at 7 m (Flores 1998a) and 15 m (Flores 1998b). With a sensitivity close to the Lockman Hole Deep Survey on a smaller area, it allowed us to identify some ISOCAM detections (see Section 5.).
4. DATA ANALYSIS
The data analysis of ISOCAM images appeared to be more complex than expected. The main culprits for this major difficulty are the cosmic ray impacts inducing memory effects on the detectors. It was therefore decided to develop two different techniques which were used independantly on the same datasets. The resulting source lists with position and photometry were compared in order to check the robustness of the two tools. We also decided to perform some Monte-Carlo simulations in order to estimate the level of incompleteness and the photometric accuracy as a function of the source fluxes. The two techniques have been applied to the ISOCAM-HDF ultra-deep survey and published in the same issue of AA (see Desert et al. 1999, for the ’three-beam technique’, and Aussel et al. 1999, for the ’PRETI technique’).
ISOCAM data are subject to standard gaussian noise (photon and readout noises) and to errors associated with the flat-fielding and dark current substraction. But the main limitation of ISOCAM deep surveys comes from its thick and cold pixels:
-
because they are thick, ISOCAM pixel detectors are very sensitive to cosmic ray impacts (4.5 pixels receive one glitch per second). The behaviour of these glitches can be divided into three families:
-
–
”normal glitches”: the more common ones, which correspond to electrons and last only one or two readouts. They are easily removed with a median filtering (the combination of several scales for the median allows the best correction).
-
–
”faders”: these glitches as well as the following ones are probably associated with protons and alpha particles. They induce positive peaks in the detector response, which can last several readouts. Since ISOCAM is best used in the raster mode, a real source will look like these glitches, i.e. a positive response over the number of readouts spent on a given position of the sky.
-
–
”dippers”: some glitches are followed by a trough extended over more than one hundred readouts.
-
–
-
ISOCAM pixels are cold, so that electrons move very slowly within them and therefore induce a transient behaviour: a pixel will take several hundred readouts to stabilize when moving from the background to the position of a source on the sky and inversely. Because of time limitation, one is therefore limited to non stabilized signals which results in an uncertainty on the photometry. This uncertainty is strongly reduced by the partial correction of the transient behaviour and by the use of simulations to define a statistical distribution of measured fluxes for any given input flux. The final uncertainty on ISOCAM deep survey fluxes is on the order of 20 per cent.
In order to facilitate the separation of sources from cosmic ray impacts, ISOCAM surveys were performed using the raster mode with a redundancy (number of different pixels falling successively on a given sky position) ranging from 2 for the shallowest survey (ELAIS) to 88 for the deepest surveys (Marano Field Ultra-Deep survey; 64 for the HDF field).
4.1. Data reduction techniques
Four different techniques applied to the ISOCAM-HDF (North) image have been compared: the ’Saclay technique’, called PRETI (Starck 1998), the ’Orsay technique’, called three-beam technique (see Désert 1999), the ’Imperial College technique’ (see Serjeant 1997) and the ’Carlo Lari technique’ (Lari 1999). After comparison, all four techniques reach the same result at 15 m, and find a small difference at 7 m. This will be discussed in a common paper that will be submitted soon. The use of simulated ISOCAM images was of great help in this work.
In the following, we give a brief description of the tool that we have developed at Saclay, PRETI. This tool is based on a multi-resolution wavelet transform which separates the temporal history of each individual pixel into several timelines, each associated with a given frequency in the variation of the signal. This technique developed by J.L.Starck consists in searching for patterns in the wavelet space (or frequency space), which correspond to the ’bad’ glitches, namely the faders and the dippers. Indeed, being extended, a bad glitch will be detected over several successive scales and appear as a pattern in the wavelet, or frequency, space. After having isolated this pattern, one can then substract it from the original signal, which in fact means subtracting a smooth function without the high-frequency contribution corresponding to the gaussian noise of the detector and where faint sources are hidden. When the data cubes have been cleaned of their glitches, they can be co-added to produce a mosaic image on which standard source detection techniques can be applied. This final step was done using again a multi-resolution wavelet transform, applied spatially instead of temporally. The techniques (1) and (2) were applied to all surveys: they agree on the photometry at the 20 per cent level and the differences in astrometry are less than the pixel size.
4.2. Simulations
We performed simulations in order to quantify the sensitivity limit (minimum detected flux, below the completeness limit), the completeness limit (flux above which all sources are detected) and the photometric accuracy. These simulations were performed with real datasets (in order to simulate realistic glitches) in which we introduced fake sources including the PSF and their modeled transient. For this, we used a long staring observation of more than 500 readouts and analyzed it as if it was a mosaic. In a raster observation, a real source will only be detected when the camera points toward its direction, while the sources present in a staring observation will remain present over the whole observation and hence will be removed as part of the low frequency component of the signal. We added to this simulated raster containing real ISOCAM noise some simulated sources with their PSF and transient behavior and then analyzed the data with the different techniques described above. The simulations were used to set the parameters of the data reduction technique and then to estimate the rate of detections of sources per flux bin as well as the error bar on the photometry. We used them to calculate the 90 per cent confidence level error bars shown in the log N-log S (figure 4).
5. NATURE OF THE GALAXIES DETECTED IN ISOCAM EXTRAGALACTIC SURVEYS
The detailed study of the properties of ISOCAM galaxies is only beginning but with the help of the large number of multi-wavelength observations of the HDF (Williams 1996) and of the CFRS field at 1415+52 (Lilly 1995), the second most observed field at all wavelengths after the HDF, one can already begin this work.
In the CFRS field, Flores (1998b) have found that two thirds of the galaxies detected by ISOCAM at 15 m down to a flux density of 250 Jy were starburst galaxies as probed by their radio emission at 6 and 21 cm. They recalculated the history of the metal production or star formation per unit volume of the universe, plotted by Madau (1996) and Lilly (1995) using only the optical and UV information on CFRS galaxies, for the dust extinction and found a correction factor of about three. Hence, optical-UV light would only probe 25 per cent of the star formation in the universe below z=1. This strong uncertainty on this correction factor needs to be reduced by more statistics not only on infrared galaxies but also on template SEDs of local galaxies, since the database of Schmitt (1998) that they used only contains 59 galaxies. However, the excess that we find in the number counts (see Section 6.) and the strong 15 m cosmic background (see Section 7.), confirm that this plot should indeed be corrected by a non negligible factor for dust extinction.
In the ISOCAM-HDF, we identified 36 sources, among the 44 detections at 15 , with an optical counterpart from the catalog of Barger (1999) limited to I22.5. The mean redshift of these galaxies is and most of them are located between z=0.4 and 1.4 (as expected from the k-correction, see Section 5.1.). The mean ratio of their effective fluxes at 15 m over the K band is close to that found for M82, if it was redshifted at z=0.7. Hence, we used the SED of M82 to determine the rest-frame 15 m flux of these galaxies, although we are aware of the strong uncertainty associated with this estimate. The mean 15 m luminosity of ISOCAM-HDF galaxies, is about ten times larger than that of M82 so this assumption should be quite conservative since ISOCAM-HDF galaxies should be even more active than M82 and closer to LIGs and ULIGs. Assuming that ISOCAM-HDF galaxies present SEDs similar to that of M82, their mean infrared luminosity would be of the order of and they would be classified as LIGs (Sanders Mirabel 1996). For a typical ratio of M/LK of about 1.5 (Charlot, private communication), they would have a mean mass of .
5.1. Origin of the infrared emission: star formation versus AGN
The major source for the huge energy radiated by these galaxies should be star formation activity. Indeed, only a few per cent of AGNs have been identified optically, in the radio or in the X-ray in our sample of ISOCAM galaxies (see also Aussel , these proceedings). Genzel (1998) found that only 20-30 per cent of the energy radiated by local ULIGs is powered by AGN activity, and this fraction should be even lower for our galaxy sample since they are mainly LIGs. However, the fraction of galaxies harboring an AGN (but not dominated by its radiation) should be much larger: Genzel (1998) detected the presence of an AGN in at least 50 per cent of the ULIGs that they studied. It was recently suggested by Fabian Iwasawa (1999) that if the hard X-ray background detected around 30 keV by HEAO1 were produced by dusty AGNs (Seyferts 2) as indicated by its flat slope, then these dusty AGNs should produce a contribution to the CIRB of , i.e. between 10 and 20 per cent of the CIRB measured by COBE-DIRBE. Such a contribution of AGNs to the CIRB would be reasonable if most of it was produced by LIGs and ULIGs and ISOCAM surveys seem to favor this option.
5.2. Optical properties of the faint 15 m galaxies
Using available data on the HDF, especially in the optical and NIR from Barger (1999), we find that the optical colors of the galaxies detected above 100 Jy (ISOCAM-HDF completeness limit, Aussel 1998) do not strongly differ from field galaxies (see Aussel , these proceedings). Hence it would not have been possible to discriminate the ISOCAM galaxies from their optical colors only.
The study of the spectroscopic properties of these galaxies is still underway (spectra made available to the community by the group of the University of Hawaii, Barger 1999). However, we have already found that a large fraction of ISOCAM-HDF galaxies exhibit weak emission lines and strong Balmer Hδ absorption lines characteristic of the presence of a large number of A stars with an age of typically one Gyr. On the other hand, galaxies with strong emission lines detected in the field are not detected at 15 . We also found the same result in the list of spectra obtained after a multi-spectroscopic follow-up of 15 m ISOCAM detections in the field of a nearby galaxy cluster, A1689 (P.I. P.A.Duc, see Fadda , these proceedings). Flores (1998b) had already found the same result on the CFRS field at 1415+52 and interpreted this result as a proof that the galaxies with dust-enshrouded star formation detected by ISOCAM have been forming stars during the last few 108 years. The lack of detection by ISOCAM of emission line galaxies was suggested to be due to the low metallicity of these galaxies. A completely independant spectroscopic survey of post-starburst galaxies in clusters of galaxies located at redshifts z=0.4-0.5 seems to already confirm this result (Dressler 1999, Poggianti 1999). They propose that galaxies with weak or no emission lines but strong Balmer absorption lines, that they call e(a), are most probably dust-enshrouded starbursts using only optical arguments based, for example, on the ratio of the OII over Hα equivalent widths.
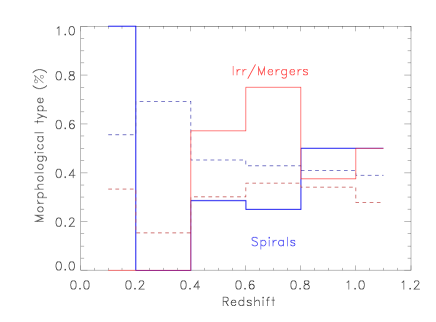
A possible scenario for the origin of these dusty starbursts galaxies, found both in ISOCAM extragalactic surveys and in the optical spectroscopic surveys of distant clusters, could be linked to the effects of galaxy interactions. Indeed, Poggianti Wu (1999) find an exceptionally high fraction of e(a) spectra among local LIGs where the fraction of interacting galaxies is very high. ISOCAM detections of CFRS galaxies also present morphological signatures of interactions and we find a morphological segregation with increasing redshift in the ISOCAM-HDF with more interacting galaxies with increasing redshift (see figure 3).
6. NUMBER COUNTS
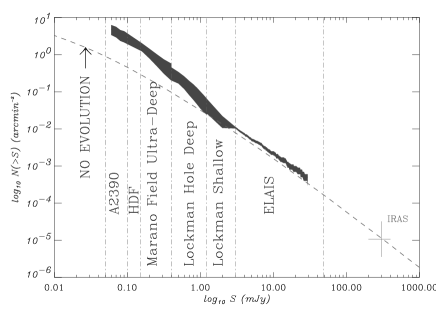
The most impressive result after three years of data analysis and calibration is the consistency of all different surveys as shown by the log N-log S plot over four orders of magnitude in flux density when including the IRAS point (figure 4). The number counts are perfectly fitted by a no-evolution model normalized to IRAS (Franceschini 1998) above the 1 mJy level typically, while they strongly diverge from this law below 1 mJy, with an increasing difference which reaches a factor of 10 at the faintest fluxes (around 50 Jy). Although k-correction can be negative as shown in figure 2 and therefore could explain a part of the excess at low fluxes, it can certainly not reproduce an excess of a factor of 10 as we find here. The detailed modeling of this evolution is quite complex and a paper will be devoted to this subject (Franceschini , 1999). However, the increasing fraction of interacting galaxies as a function of redshift detected in the ISOCAM-HDF (figure 3) may explain the behavior of the log N-log S, if LIGs were to begin to dominate the number counts above z0.4 and completely dominate them at z0.7. There was already a hint of such a strong evolution of LIGs and ULIGs in the analysis of local ULIGs by Kim Sanders (1998, see Section 1. Introduction).
We learned from the previous section about the nature of the galaxies that were detected in ISOCAM surveys that this excess is produced by a few LIGs, two orders of magnitude less numerous than optical galaxies detected in the HDF (see Aussel 1998). Hence, the luminosity function of galaxies should be different at z0.7, the mean redshift of ISOCAM-HDF galaxies, than locally, favoring luminous galaxies. The flattening of the log N-log S at low fluxes implies that we are not far from having identified most of the galaxies producing the mid-infrared background and indicates that we should be able to give a good constraint on the cosmic background produced by these sources.
7. COSMIC INFRARED BACKGROUND
Integrating the 15 m number counts over the whole flux range, one finds a conservative value of about above 50 Jy and 3.31.3 above 30 Jy, with less confidence. This corresponds to 30-45 per cent of the cosmic background seen with the HST in the I-band (, Lagache 1999). This fraction is very high since locally IRAS showed that it is the total infrared luminosity of galaxies, i.e. from 8 to 1000 m, which is about 30 per cent of that from starlight (Soifer Neugebauer 1991). Assuming a conservative SED one would then expect these galaxies to emit at least as much energy in the far infrared than in the optical. In particular, one can estimate the effective ratio of their 140 m over 15 m energy densities at the mean redshift of 0.7 and compare it to the COBE-DIRBE value. A conservative ratio would be of the order of three, like for M82, although a more realistic one would be higher than that. In this conservative case, they would produce more than 50 per cent of the COBE-DIRBE CIRB found by Lagache (1999, ) and about 30 per cent of the value found by Hauser (1998, ). This is only a lower limit since a ratio of 3 is probably too conservative and since the number counts have not completely flattened yet. The minimum ratio of the energy densities at 140 m over 15 m is about 10, hence if the faint 15 m galaxies were moderate ULIGs, they would produce the whole COBE-DIRBE background.
8. CONCLUSION
ISOCAM extragalactic surveys are nearly four orders of magnitude more sensitive than IRAS in the 15 m range. They teach us that a few luminous and massive infared galaxies located at a mean redshift of 0.7 produce most of the 15 m and probably also DIRBE-140 m cosmic background. Assuming a conservative spectral energy distribution for these galaxies, one find that they emit as much energy in the infrared than the two orders of magnitude more numerous optical galaxies detected in the HDF. The galaxies producing this infrared excess present morphological signs of interaction. Hence, both dust extinction and galaxy interactions played a major role in galaxy evolution since z1.
Additional conclusions will be reached only after having collected a statistically larger sample of optical counterparts to ISOCAM galaxies, in particular, in the ultra-deep surveys performed in the Marano Field where we have detected hundreds of very faint 15 galaxies. The large amount of energy released by these galaxies will be one of the key questions for the next spatial telescopes, like SIRTF and FIRST, and at larger redshifts for the ground-based sub-millimeter interferometer LSA-MMA. The Next Generation Space Telescope (NGST) would give a unique insight into the origin of their activity, and in particular the proportion of the energy due to AGN activity, if it were to observe up to 25-30 m.
ACKNOWLEDGMENTS
We would like to thank Suzanne Madden for very fruitful scientific discussions and for her advises in the redaction of this paper.
References
- 1 Allamandola, L.J., Tielens, A.G.G.M., Barker, J.R., 1989, ApJS 71, 733
- 2 Altieri B., Metcalfe L., Kneib J.P. 1998, A&A, in press, astro-ph/9810480
- 3 Aussel H., Cesarsky C., Elbaz D., Starck, J.L. 1998, A&A 342, 313
- 4 Barger A. J., Cowie L. L., Trentham N., Fulton E., Hu E. M., Songaila A., Hall D. 1999, AJ 117, 102
- 5 Boulanger, F. 1998, Star Formation with the Infrared Space Observatory, Lisbon, Portugal, J.Yun R.Liseau (Eds.), ASP Conf. Ser., Vol.132, p.15.
- 6 Charmandaris, V., Mirabel, I.F., Tran, D., , 1998, in Extragalactic Astronomy in the Infrared, T.Thuan, G. Mamon, J.T.T.Van (eds), XVIIth Moriond Astr. Meeting, Ed. Frontière, p.283
- 7 Désert F.-X., Boulanger F., Puget J.-L. 1990, A&A 237, 215
- 8 Désert, F.-X., Puget, J.-L., Clements, D.L., Pérault, M., Abergel, A., Bernard, J.-P., Cesarsky, C.J. 1999, A&A 342, 363
- 9 Djorgovski, S., Thompson, D. 1992, in IAU Symp. 149, ’The Stellar Populations of Galaxies’, ed. B.Barbuy and A.Renzini (Dordrecht: Kluwer), p.337
- 10 Dressler, A., Smail, I., Poggianti, B.M., 1999, ApJS, in press, astro-ph/9901263
- 11 Fabian, A.C., Iwasawa, K., 1999, MNRAS in press, astro-ph/9901121
- 12 Flores H., Hammer F., Désert F.-X. 1998a, A&A, in press, astro-ph/9811201
- 13 Flores H., Hammer F., Thuan T. 1998b, ApJ, in press, astro-ph/9811202
- 14 Franceschini A., Toffolatti L., Mazzei P., Danese L., De Zotti G., 1991, A&A Suppl.Ser. 89, 285
- 15 Franceschini A., Mazzei P., de Zotti G., Danese L. 1994, ApJ 427, 140
- 16 Franceschini, A. 1998, in Extragalactic Astronomy in the Infrared, T.Thuan, G. Mamon, J.T.T.Van (eds), XVIIth Moriond Astr. Meeting, Ed. Frontière, p.509.
- 17 Franceschini, A. 1999, in preparation
- 18 Genzel R., Lutz D., Sturm E., Egami E., Kunze D. 1998, ApJ 498, 579
- 19 Guiderdoni B., Bouchet F.R., Puget J.-L., Lagache G., Hivon E. 1997, Nature 390, 257
- 20 Hacking, P.B., Houck, J.R., 1987, ApJS 63, 311
- 21 Hammer F., Flores H., Lilly S.J., 1997, ApJ 481, 49
- 22 Hauser, M.G., Arendt, R.G., Kelsall, T., 1998, ApJ 508, 25
- Hughes D. H., Serjeant S., Dunlop J., Rowan-Robinson M., Blain A. 1998, Nature 394, 241
- Kim, D.C., Sanders, D.B. 1998, ApJS 119, 41
- Lagache G. 1999, AA, in press.
- 23 Lari, C. 1999, in preparation
- Léger A., Puget J.L. 1984, A&A 137, L5
- 24 Lilly S. J., Le Fèvre O., Hammer F., Crampton D. 1995, ApJ 460, L1
- 25 Lonsdale, C.J., Hacking, P., 1989, ApJ 339, 712
- 26 Lonsdale, C.J., Hacking, P., Conrow, T.P., Rowan-Robinson, M., 1990, ApJ 358, 60
- 27 Madau P., Ferguson H. C., Dickinson M. E., Giavalisco M., Steidel C. C., Fruchter A. 1996, MNRAS 283, 1388
- Meurer G. R., Heckman T. M., Lehnert M. D., Leitherer C., Lowenthal J. 1997, AJ 114, 54
- 28 Mirabel I.F., Vigroux L., Charmandaris V., Sauvage M., Gallais P. et al. 1998, A&A 333, L1
- 29 Oliver S. J. , 1996, In Wide-Field Spectroscopy and the Distant Universe, ed. SJ Maddox, Singapore World Sci., p.264
- 30 Oliver S. J. , 1998, IAP workshop on Wide-Field Surveys.
- 31 Papoular, R., Reynaud, C., Nenner, I., 1991, AA 247, 215
- 32 Pettini M., Steidel C. C., Adelberger K. L., Kellogg M., Dickinson M. 1997, to appear in ‘ORIGINS’, ed. J.M. Shull, C.E. Woodward, and H. Thronson, (ASP Conference Series), astro-ph/9708117
- 33 Puget J.-L. Léger, A. 1989, Ann.Rev.Ast.Ap. 27, 37
- 34 Poggianti, B.M., Smail, I., Dressler, A., 1999, ApJ, in press, astro-ph/9901264
- 35 Poggianti, B.M., Wu, 1999, in preparation
- 36 Puget J.-L. , Abergel A., Bernard J.-P., Boulanger F., Burton W. B. et al. 1996, A&A 308, L5
- 37 Puget, J.-L. et al. 1999, these proceedings
- 38 Scoville, N.Z., Soifer B.T. 1991, in Massive Stars in Starbursts, ed. Leitherer C., Walborn N., Heckman T., Norman C., Cambridge Univ. Press, p.233
- 39 Searjeant, S.B.G., Eaton, N., Oliver, S.J., 1997, MNRAS 289, 457
- 40 Soifer B.T., Neugebauer G. 1991, AJ 101, 354
- 41 Spinoglio L., Malkan M.A., Rush B., Carrasco L.,Recillas-Cruz E. 1995, ApJ 453, 616
- 42 Starck J.-L., Aussel H., Elbaz D., Cesarsky C. J., 1998, in Extragalactic Astronomy in the Infrared, T.Thuan, G. Mamon, J.T.T.Van (eds), XVIIth Moriond Astr. Meeting, Ed. Frontière, p.509.
- 43 Steidel C.C., Giavalisco M., Pettini M., Dickinson M., Adelberger K.L. 1996, ApJ 462, L17
- 44 Rowan-Robinson M., Mann R. G., Oliver S. J., Efstathiou A., Eaton N. , 1997, MNRAS 289, 490
- 45 Sanders, D.B., Mirabel, I.F., 1996, Ann. Rev. Astron. Astrophys. 34, 749
- 46 Saunders W., Rowan-Robinson M., Lawrence A., Efstathiou G., Kaiser N. et al. 1990, MNRAS 242, 318
- 47 Schmitt, H., Kinney, A., Calzetti, D., Storchi-Bergmann, T., 1997, AJ 114, 592
- 48 Serjeant, S.B.G., Eaton, N., Oliver, S.J. 1997, MNRAS 289, 457
- 49 Smail I., Ivison R. J., Blain A. W. 1997, ApJL 490, 5
- 50 Taniguchi, Y., Cowie, L.L., Sato, Y. 1997, A&A 328, L9
- 51 Tran D. 1998, PHD thesis, Université de Paris XI.
- 52 Vigroux L., Mirabel I. F., Altieri B., Boulanger F., Cesarsky C. J. 1996, A&A 315, L93
- 53 White, S. D. M., Frenk, C. S. 1991, ApJ 379, 25
- 54 Williams, R.E., Blacker, B., Dickinson, M. 1996, AJ 112, 1335