email: soeren@astro.ku.dk 22institutetext: Sternwarte der Universität Bonn, Auf dem Hügel 71, D-53121 Bonn, Germany
email: richtler@astro.uni-bonn.de
Young massive star clusters in nearby galaxies ††thanks: Based on observations made with the Nordic Optical Telescope, operated on the island of La Palma jointly by Denmark, Finland, Iceland, Norway, and Sweden, in the Spanish Observatorio del Roque de los Muchachos of the Instituto de Astrofisica de Canarias, and with the Danish 1.5-m telescope at ESO, La Silla, Chile.
Abstract
Using ground-based UBVRI CCD photometry we have been carrying out a search for young massive star clusters (YMCs) in a sample consisting of 21 nearby spiral galaxies. We find a large variety concerning the richness of the cluster systems, with some galaxies containing no YMCs at all and others hosting very large numbers of YMCs. Examples of galaxies with poor cluster systems are NGC 300 and NGC 4395, while the richest cluster systems are found in the galaxies NGC 5236 (M83), NGC 2997 and NGC 1313. The age distributions of clusters in these galaxies show no obvious peaks, indicating that massive clusters are formed as an ongoing process rather than in bursts. This is in contrast to what is observed in starbursts and merger galaxies. The radial distributions of clusters follow the H surface brightnesses. For the galaxies in our sample there is no correlation between the morphological type and the presence of YMCs.
Key Words.:
Galaxies: individual – photometry – spiral – star clusters1 Introduction
During the last decade many investigations have revealed the presence of “young massive star clusters” (YMCs) or “super star clusters” in mergers and starburst galaxies, and it has been speculated that these objects could be young analogues of the globular clusters seen today in the Milky Way. It is an intriguing idea that globular clusters could still be formed today in some environments, because the study of such objects would be expected to provide a direct insight into the conditions that were present in the early days of our own and other galaxies when the globular clusters we see today in the halos were formed.
Probably the most famous example of a merger galaxy hosting “young massive clusters” is the “Antennae”, NGC 4038/39 where Whitmore & Schweizer (1995) discovered more than 700 blue point-like sources with absolute visual magnitudes up to . Other well-known examples are NGC 7252 (Whitmore et. al. 1993), NGC 3921 (Schweizer et. al. 1996) and NGC 1275 (Holtzman et. al. 1992). All of these galaxies are peculiar systems and obvious mergers. In fact, in all cases investigated so far where star formation is associated with a merger, YMCs have been identified (Ashman & Zepf 1998).
But YMCs exist not only in mergers. They have been located also in starburst galaxies such as NGC 1569 and NGC 1705 (O’Connell et. al. 1994), NGC 253 (Watson et. al. 1996) and M82 (O’Connell et. al. 1995), in the nuclear rings of NGC 1097 and NGC 6951 (Barth et. al. 1995), and in the blue compact galaxy ESO-338-IG04 (Östlin et. al. 1998). The magnitudes of YMCs reported in all these galaxies range from to , and the effective radii ( = the radius within which half of the light is contained) have been estimated to be of the order of a few parsec to about 20 pc, compatible with the objects deserving the designation “young globular clusters”.
All of the systems mentioned above are relatively distant, but in fact one does not have to go farther away than the Local Group in order to find galaxies containing rather similar star clusters. The Magellanic Clouds have long been known to host star clusters of a type not seen in the Milky Way, i.e. compact clusters that are much more massive than Galactic open clusters (van den Bergh 1991, Richtler 1993), and in many respects resemble globular clusters more than open clusters. Some of the most conspicuous examples are the years old cluster in the centre of the 30 Doradus nebula in the LMC (Brandl et. al. 1996), shining at an absolute visual magnitude of about -11, and the somewhat older object NGC 1866 (about years), also in the LMC (Fischer et. al. 1992), which has an absolute visual magnitude of . Even if these clusters are not quite as spectacular as those found in genuine starburst galaxies, they are still more massive than any of the open clusters seen in the Milky Way today. YMCs have been reported also in M33 (Christian & Schommer 1988), and in the giant Sc spiral M101 (Bresolin et. al. 1996).
Taking into account the spread in the ages of the YMCs in the Antennae, Fritze - v. Alvensleben (1998) recovered a luminosity function (LF) resembling that of old globular clusters (GC’s) to a very high degree when evolving the present LF to an age of 12 Gyr. Elmegreen & Efremov (1997) point out the interesting fact that the upper end of the LF of old GC systems is very similar to that observed for YMCs, open clusters in the Milky Way, and even for HII regions in the Milky Way, and this is one of their arguments in favour of the hypothesis that the basic mechanism behind the formation of all these objects is the same. They argue that massive clusters are formed whenever there is a high pressure in the interstellar medium, due to starbursts or other reasons as e.g. a high virial density (as in nuclear rings and dwarf galaxies). However, this doesn’t seem to explain the presence of YMCs in apparently undisturbed disk galaxies like M33 and M101.
So it remains a puzzling problem to understand why YMCs exist in certain galaxies, but not in others. In this paper we describe some first results from an investigation aiming at addressing this question. It seems that YMC’s can exist in a wide variety of host galaxy environments, and there are no clear systematics in the properties of the galaxies in which YMC’s have been identified. And just like it is not clear how YMCs and old globular clusters are related to each other, one can also ask if the very luminous YMCs in mergers and starburst galaxies are basically the same type of objects as those in the Magellanic Clouds, M33 and M101.
| Name | Type | (2000.0) | (2000.0) | Obs. | |||
|---|---|---|---|---|---|---|---|
| NGC 45 | SA(s)dm | 00:14:04 | :10:52 | 11.32 | -17.13 | DK154 | |
| NGC 247 | SAB(s)d | 00:47:08 | :45:38 | 9.67 | -17.40 | DK154 | |
| NGC 300 | SA(s)d | 00:54:53 | :41:00 | 8.72 | -18.05 | DK154 | |
| NGC 628 | SA(s)c | 01:36:42 | +15:46:59 | 9.95 | -19.77 | NOT | |
| NGC 1156 | IB(s)m | 02:59:43 | +25:14:15 | 12.32 | -17.84 | NOT | |
| NGC 1313 | SB(s)d | 03:18:15 | :29:51 | 9.2 | -19.03 | DK154 | |
| NGC 1493 | SB(rs)cd | 03:57:28 | :12:38 | 11.78 | -18.62 | DK154 | |
| NGC 2403 | SAB(s)cd | 07:36:54 | +65:35:58 | 8.93 | -18.73 | NOT | |
| NGC 2835 | SAB(rs)c | 09:17:53 | :21:20 | 11.01 | -18.30 | DK154 | |
| NGC 2997 | SA(s)c | 09:45:39 | :11:25 | 10.06 | -20.35 | DK154 | |
| NGC 3184 | SAB(rs)cd | 10:18:17 | +41:25:27 | 10.36 | -19.14 | NOT | |
| NGC 3621 | SA(s)d | 11:18:16 | :48:42 | 10.28 | -19.21 | DK154 | |
| NGC 4395 | SA(s)m | 12:25:49 | +33:32:48 | 10.64 | -17.47 | NOT | |
| NGC 5204 | SA(s)m | 13:29:36 | +58:25:04 | 11.73 | -16.68 | NOT | |
| NGC 5236 | SAB(s)c | 13:37:00 | :51:58 | 8.20 | -19.78 | DK154 | |
| NGC 5585 | SAB(s)d | 14:19:48 | +56:43:44 | 11.20 | -18.00 | NOT | |
| NGC 6744 | SAB(r)bc | 19:09:45 | :51:22 | 9.14 | -19.50 | DK154 | |
| NGC 6946 | SAB(rs)cd | 20:34:52 | +60:09:14 | 9.61 | -20.70 | NOT | |
| NGC 7424 | SAB(rs)cd | 22:57:18 | :04:14 | 10.96 | -19.54 | DK154 | |
| NGC 7741 | SB(s)cd | 23:43:53 | +26:04:35 | 11.84 | -19.10 | NOT | |
| NGC 7793 | SA(s)d | 23:57:50 | :35:21 | 9.63 | -18.04 | DK154 |
We therefore decided to observe a number of nearby galaxies and look for populations of YMC’s. The galaxies were mainly selected from the Carnegie Atlas (Sandage & Bedke 1994), and in order to minimise the problems that could arise from extinction internally in the galaxies we selected galaxies that were more or less face-on. We tried to cover as wide a range in morphological properties as possible, although the requirement that the galaxies had to be nearby (because we would rely on ground-based observations) restricted the available selection substantially. The final sample consists of 21 galaxies out to a distance modulus of , for which basic data can be seen in Table 1.
In this paper we give an overview of our observations, and we discuss the main properties of the populations of YMCs in the galaxies in Table 1. In a subsequent paper (Larsen et. al. 1999) we will discuss the correlations between the number of YMCs in a galaxy and various properties of the host galaxies in more detail, and compare our data with data for starburst galaxies and mergers published in the literature.
2 Observations and reductions
The observations were carried out partly with the Danish 1.54 m. telescope and DFOSC (Danish Faint Object Spectrograph and Camera) at the European Southern Observatory (ESO) at La Silla, Chile, and partly with the 2.56 m. Nordic Optical Telescope (NOT) and ALFOSC (a DFOSC twin instrument), situated at La Palma, Canary Islands. The data consists of CCD images in the filters U,B,V,R,I and H. In the filters BVRI and H we typically made 3 exposures of 5 minutes each, and 3 exposures of 20 minutes each in the U band. Both the ALFOSC and DFOSC were equipped with thinned, backside-illuminated 2 K2 Loral-Lesser CCDs. The pixel scale in the ALFOSC is 0.189″/pixel and the scale in the DFOSC is 0.40″/pixel, and the fields covered by these two instruments are and , respectively. All observations used in this paper were conducted under photometric conditions, with typical seeing values (measured on the CCD images) being 1.5″ and 0.8″ for the La Silla and La Palma data, respectively.
During each observing run, photometric standard stars in the Landolt (1992) fields were observed for calibration of the photometry. Some of the Landolt fields were observed several times during the night at different airmass in order to measure the atmospheric extinction coefficients. For the flatfielding we used skyflats exposed to about half the dynamic range of the CCD, and in general each flatfield used in the reductions was constructed as an average of about 5 individual integrations.
After bias subtraction and flatfielding, the three exposures in each filter were combined to a single image, and star clusters were identified using the daofind task in DAOPHOT (Stetson 1987) on a background-subtracted -band frame. Aperture photometry was then carried out with the DAOPHOT phot task, using a small aperture radius (4 pixels for colours and 8 pixels for the -band magnitudes) in order to minimise errors arising from the greatly varying background. Aperture corrections from the standard star photometry (aperture radius = 20 pixels) to the science data were derived from a few isolated, bright stars in each frame. Because the star clusters are not true point sources, no PSF photometry was attempted. A more detailed description of the data reduction procedure will be given in Larsen (1999).
The photometry was corrected for Galactic foreground extinction using the values given in the Third Reference Catalogue of Bright Galaxies (de Vaucouleurs et. al. (1991), hereafter RC3).
2.1 Photometric errors
The largest formal photometric errors as estimated by phot are those in the band, amounting to around 0.05 mag. for the faintest clusters. However, these error estimates are based on pure photon statistics and are not very realistic in a case like ours. Other contributions to the errors come from the standard transformation procedure, from a varying background, and from the fact that the clusters are not perfect point sources so that the aperture corrections become uncertain.


The r.m.s. residuals of the standard transformations were between 0.01 - 0.03 mags. in V, B-V and V-I, and between 0.04 and 0.06 mags. in U-B.
The errors in aperture corrections arising from the finite cluster sizes were estimated by carrying out photometry on artificially generated clusters with effective radii in the range pixels (0″ - 1.6″ on the DFOSC frames). 1″ corresponds to a linear distance of about 20 pc at the distance of typical galaxies in our sample, such as NGC 1313 and NGC 5236. The artificial clusters were modeled by convolving the point-spread function (PSF) with MOFFAT15 profiles.
The upper panel in Fig. 1 shows the errors in the aperture corrections for -band photometry through aperture radii pixels and pixels as a function of , while the lower panel shows the errors in the colour indices for pixels. At , the error in -band magnitudes using pixels amounts to about 0.15 magnitudes. For a given , the errors in the colours are much smaller than the errors in the individual bandpasses, so that accurate colours can be derived through the small pixels aperture without problems. This convenient fact has also been demonstrated by e.g. Holtzman et. al. (1996).

The random errors, primarily arising due to background fluctuations, should in principle be evaluated individually for each cluster, since they depend on the local environment of the cluster. Fig. 2 shows the random errors for clusters in NGC 5236, estimated by adding artificial objects of similar brightness and colour near each cluster and remeasuring them using the same photometric procedure as for the cluster photometry. Again it is found that the errors in two different filters tend to cancel out when colour indices are formed. The -band errors are quite substantial, but we have chosen to accept the large random errors associated with the use of an pixels aperture in order to keep the effect of systematic errors at a low level.
3 Identification of star clusters
After the photometry had been obtained, the first step in the analysis was to identify star cluster candidates, and to make sure that they were really star clusters and not some other type of objects. Possible sources of confusion could be compact HII regions, foreground stars, and individual luminous stars in the observed galaxies. However, each of these objects can be eliminated by applying the following selection criteriae:
-
•
HII regions: These can be easily identified due to their emission.
-
•
Foreground stars: Because our galaxies are located at rather high galactic latitudes, practically all foreground stars are redder than , whereas young massive star clusters will be bluer than this limit. Hence, by applying a limit of 0.45 we sort away the foreground stars while retaining the young massive cluster candidates. Remaining foreground stars could in many cases be distinguished by their position in two-colour diagrams, by their lack of angular extent, and by being positioned outside the galaxies.
-
•
Individual luminous stars in the galaxies: We apply a brightness limit of for cluster candidates with and for candidates with . The bluer objects are often found inside or near star forming regions, but the magnitude limit of should prevent confusion with even very massive stars.
In addition to these selection criteriae it was found very useful to generate colour-composite images using the I, U and H exposures and identify all the cluster candidates visually on these images. For the “red” channel we used the H exposures, for the “green” channel we used the I-band frames, and for the “blue” channel the U-band frames. In images constructed like this, YMCs stand out very clearly as compact blue objects, in contrast to HII regions which are distinctly red, and foreground stars and background galaxies which appear green.
Following the procedure outlined above, we ended up with a list of star cluster candidates in each galaxy. The cluster nature of the detected objects was further verified by examining their positions in two-colour diagrams (U-B,B-V and U-V,V-I), and compare with model predictions for the colours of star clusters and individual stars. In addition, we have been able to obtain spectra of a few of the brightest star cluster candidates. These will be discussed in a subsequent paper.
The cluster samples may suffer from incompleteness effects. In particular, we have deliberately excluded the youngest clusters which are still embedded in giant HII regions (corresponding to an age of less than about years). Clusters which have intrinsic will also slip out of the sample if their actual observed index is larger than 0.45 due to reddening internally in the host galaxy.
3.1 Counting clusters
The specific frequency for old globular cluster systems has traditionally been defined as (Harris & van den Bergh 1981):
| (1) |
where is the total number of globular clusters belonging to a galaxy of absolute visual magnitude . Such a definition is a reasonable way to characterise old globular cluster systems because is a well-defined quantity, which can be estimated with good accuracy due to the gaussian-like luminosity function (LF) even if the faintest clusters are not directly observable. In the case of young clusters it is more complicated to define a useful measure of the richness of the cluster systems, because the LF is no longer gaussian and the number of young clusters that one finds in a galaxy depends critically on the magnitude limit applied in the survey. Nevertheless, we have defined a quantity equivalent to for the young cluster systems:
| (2) |
is the number of clusters satisfying the criteriae described in Sec. 3. We have chosen to normalise to the -band luminosity of the host galaxy because it can be looked up directly in the RC3 catalogue.
4 Results
4.1 Specific frequencies
| Name | |||||
|---|---|---|---|---|---|
| NGC 45 | 1 | 2 | 3 | - | |
| NGC 247 | 1 | 2 | 3 | - | |
| NGC 300 | 11 | 21 | 31 | 0.18 | - |
| NGC 628 | 27 | 12 | 39 | ||
| NGC 1156 | 13 | 9 | 22 | ||
| NGC 1313 | 17 | 29 | 46 | ||
| NGC 1493 | 0 | 0 | 0 | 0 | - |
| NGC 2403 | 41 | 101 | 141 | ||
| NGC 2835 | 7 | 2 | 9 | - | |
| NGC 2997 | 20 | 14 | 34 | ||
| NGC 3184 | 3 | 10 | 13 | - | |
| NGC 3621 | 22 | 23 | 45 | ||
| NGC 4395 | 0 | 2 | 2 | - | |
| NGC 5204 | 0 | 7 | 7 | - | |
| NGC 5236 | 55 | 96 | 151 | ||
| NGC 5585 | 1 | 8 | 9 | - | |
| NGC 6744 | 12 | 6 | 18 | ||
| NGC 6946 | 76 | 31 | 107 | ||
| NGC 7424 | 7 | 3 | 10 | - | |
| NGC 7741 | 0 | 0 | 0 | 0 | - |
| NGC 7793 | 12 | 8 | 20 | ||
| (LMC) | 1 | 7 | 8 | - | |
| (M33) | 0 | 1 | 1 | - |


In Table 2 we give the number of clusters identified in each of the observed galaxies. The columns labeled and refer to the number of “blue” and “red” clusters respectively, according to the definition that “blue” clusters are clusters with (and hence ) whereas the “red” clusters have (and ). See also Sect. 3. The data for the LMC are from Bica et. al. (1996) and those for M33 are from Christian & Schommer (1988).
The “specific frequencies” for the galaxies in our sample are given in the fourth column of Table 2. The number used to derive is the total number of clusters, “red” and “blue”, detected in each galaxy.
The errors on were estimated taking into consideration only the uncertainties of the absolute magnitudes of the host galaxies resulting from the distance errors as given in Table 1 and poisson statistics of the cluster counts. However, it is clear that this is not a realistic estimate of the total uncertainties of the values. Another source of uncertainty arises from incompleteness effects, particularly for the more distant galaxies. For all galaxies with more than 20 clusters we estimated the incompleteness by adding artificial clusters with magnitudes of 18.0, 18.5 21.0, and testing how many of the artificially added clusters were detected by DAOFIND in all of the filters , and . Because the completeness depends critically on the size of the objects, we carried out completeness tests for artificial clusters with pc and pc in each galaxy. The numbers of clusters actually detected in each of the magnitude bins [18.25 - 18.75], [18.75 - 19.25] [20.75 - 21.25] were then corrected by the fraction of artificial clusters recovered in the corresponding bin, and finally the “corrected” values were derived. These are given in the last column of Table 2, labeled , for point sources (first line) and objects with pc (second line). See Larsen (1999) for more details on the completeness corrections.
One additional source of errors affecting which remains uncorrected, is the fact that an uncertainty in the distance also affects the magnitude limit for detection of star clusters . If a galaxy is more distant (or nearby) than the value we have adopted, our limit corresponds to a “too bright” (too faint) absolute magnitude, and we have underestimated (overestimated) the number of clusters. Hence, the true errors are somewhat larger than those given in Table 2, but they depend on the cluster luminosity function. If the clusters follow a luminosity function of the form (Whitmore & Schweizer 1995) then a difference in the magnitude limit of would lead to a difference in the cluster counts of about 7%.
A histogram of the uncorrected values (Fig. 3) shows that a wide range of values are present within our sample. Many of the galaxies in the lowest bins contain only a few massive clusters or none at all, but a few galaxies have much higher values than the average. The most extreme values are found in NGC 1156, NGC 1313, NGC 3621, NGC 5204 and NGC 5236. The galaxy NGC 2997 also hosts a very rich cluster system, but the value is probably severely underestimated because of the large distance of NGC 2997 which introduces significant incompleteness problems. A similar remark applies to two other distant galaxies observed at the Danish 1.54 m. telescope, NGC 1493 and NGC 7424, while all the remaining galaxies in Table 1 are either more nearby, or have been observed at the NOT in better seeing conditions, and hence their values are believed to be more realistic.
4.2 Two-colour diagrams
In Fig. 4 we show the diagrams for six cluster-rich galaxies. These plots also include the so-called “S” sequence defined by Girardi et. al. (1995, see also Elson & Fall (1985)), represented as a dashed line. The “S” sequence is essentially an age sequence, derived as a fit to the average colours of bright LMC clusters in the diagram. The age increases as one moves along the S-sequence from blue to red colours. The colours of our cluster candidates are very much compatible with those of the S-sequence, especially if one considers that there is a considerable scatter around the S-sequence also for Magellanic Cloud clusters (Girardi et. al. 1995). Also included in the diagrams are stellar models by Bertelli et. al. (1994) (dots), in order to demonstrate that the position of clusters within such a diagram is distinctly different from that of single stars. Already from Fig. 4 one can see that there is a considerable age spread among the clusters in each galaxy, with the red cut-off being due to our selection criteriae. The reddening vector corresponding to a reddening of is shown in each plot as an arrow, and it is quite clear that the spread along the S-sequence cannot be entirely due to reddening effects.
Bresolin et. al. (1996) used HST data to carry out photometry for star clusters in the giant Sc-type spiral M101. A comparison between their data and photometry for clusters in one of our galaxies (NGC 1313) is shown in Fig. 5. It is evident that the colours of clusters in the two galaxies are very similar. NGC 1313 was chosen as an illustrative example because it contains a relatively rich cluster system, although not so rich that the diagram becomes too crowded.
In Fig. 5 we have also included a curve showing the colours of star clusters according to the population synthesis models of Bruzual & Charlot (1993, hereafter BC93). The agreement between the synthetic and observed colours is very good for U-B , but for U-B the B-V colours of the BC93 models are systematically too blue compared to our data and the S sequence. The “red loop” that extends out to B-V0.3 and U-B-0.5 is due to the appearance of red supergiants at an age of about years (Girardi & Bica 1993) and is strongly metallicity dependent. Girardi et. al. (1995) constructed population synthesis models based on a set of isochrones by Bertelli et. al. (1994) and found very good agreement between the S-sequence and their synthetic colours. The models (solar metallicity) are included in Fig. 5 as a solid line. In these models the “red loop” is not as pronounced as in the BC93 models, and the youngest models are in general not as blue as those of BC93, resulting in a much better fit to the observed cluster colours.
4.3 Ages and masses


A direct determination of the mass of an unresolved star cluster requires a knowledge of the M/L ratio, which in turn depends on many other quantities, in particular the age and the IMF of the cluster. However, if one assumes that the IMF does not vary too much from one star cluster to another, then the luminosities alone should facilitate a comparison of star clusters with similar ages.
Applying the S-sequence age calibration to the clusters in our sample, the luminosities of each cluster can then be directly compared to Milky Way clusters of similar age, as shown in Fig. 6. Ages and absolute visual magnitudes for Milky Way open clusters are from the Lyngå (1982) catalogue, and are represented in each plot as small crosses. In the diagrams in Fig. 6 we have also indicated the effect of a reddening of E(B-V) = 0.30. In these plots the “reddening vector” depends in principle on the original position of the cluster within the (U-B,B-V) diagram from which the age was derived, but we have included two typical reddening vectors, corresponding to two different ages.
In all of the galaxies in Fig. 6 but NGC 2403, the absolute visual magnitudes of the brightest clusters are 2 - 3 magnitudes brighter than the upper limit of Milky Way open clusters of similar ages. Accordingly they should be nearly 10 times more massive. In the case of NGC 2403, the most massive clusters are not significantly more massive than open clusters found in the Milky Way. Fig. 6 also confirms the suspicion that the cluster data in NGC 2997 are incomplete, particularly for .
We have included population synthesis models for the luminosity evolution of single-burst stellar populations of solar metallicity by BC93 in Fig. 6, scaled to a total mass of . Models for three different IMFs are plotted: Salpeter (1955), Miller-Scalo (1979) and Scalo (1986), all covering a mass range from 0.1 - 65 . The different assumptions about the shape of the IMF obviously affect the evolution of the magnitude per unit mass quite strongly, and unfortunately the effect is most severe just in the age interval we are interested in. The difference between the Miller-Scalo and the Scalo IMF amounts to almost 2 magnitudes, but in any case the most massive clusters appear to have masses around .
In Fig. 6 we have also indicated the location of a “typical” old globular cluster system with an error bar centered on the coordinates 15 Gyr, and with mags. Although the comparison of masses at high and low age based on population synthesis models is extremely sensitive to the exact shape of the IMF, it seems that the masses of the young massive star clusters are at least within the range of “true” globular clusters.
Reddening effects alone are unlikely to affect the derived ages to a high degree, as a scatter along the “reddening vectors” in Fig. 6 would then be expected. Basically this would mean that one would expect a much steeper rate of decrease in vs. the derived age, while the observed relation between age and the upper luminosity limit is in fact remarkably compatible with that predicted by the models. The comparison with model calculations implies that the upper mass limit for clusters must have remained relatively unchanged over the entire period during which clusters have been formed in each galaxy.
5 Notes on individual galaxies
5.1 NGC 1156
This is a Magellanic-type irregular galaxy, currently undergoing an episode of intense star formation. Ho et. al. 1995 noted that the spectrum of NGC 1156 resembles that of the “W-R galaxy” NGC 4214. NGC 1156 is a completely isolated galaxy, so the starburst could not have been triggered by interaction with other galaxies. We have found a number of massive star clusters in NGC 1156.
5.2 NGC 1313
This is an SB(s)d galaxy of absolute magnitude . de Vaucouleurs 1963 found a distance modulus of , which we adopt. The morphology of NGC 1313 is peculiar in the sense that many detached sections of star formation are found, particularly in the south-western part of the galaxy. There is also a “loop” extending about 1.5 Kpc (projected) to the east of the bar with a number of HII regions and massive star clusters. Another interesting feature is that one can see an extended, elongated diffuse envelope of optical light, with the major axis rotated relative to the central bar of NGC 1313, embedding the whole galaxy. It has been suggested by Ryder et. al. (1995) that the diffuse envelope surrounding NGC 1313 is associated with galactic cirrus known to exist in this part of the sky (Wang & Yu 1995), but this explanation does not seem likely since it would require a very perfect alignment of the centre of NGC 1313 with the diffuse light. Also, the outer boundary of the active star-forming parts of galaxy coincide quite well with the borders of the more luminous parts of the envelope. In our opinion the most likely explanation is that the diffuse envelope is indeed physically associated with NGC 1313 itself.
Walsh & Roy (1997) determined O/H abundances for 33 HII regions in NGC 1313, and found no radial gradient. This makes NGC 1313 the most massive known barred spiral without any radial abundance gradient.
NGC 1313 hosts a rich population of massive star clusters. When looking at the plot in Fig. 6 it seems that there is a concentration of clusters at log(Age) 8.3 or roughly 200 Myr. We emphasize that this should be confirmed by a more thorough study of the cluster population in this galaxy, and in particular it would be very useful to be able to detect fainter clusters in order to improve the statistics. If this is real it could imply that some kind of event stimulated the formation of massive star clusters in NGC 1313 a few hundred Myr ago, perhaps the accretion of a companion galaxy. A second “burst” of cluster formation seems to have been taking place very recently, and is maybe going on even today.
5.3 NGC 2403
NGC 2403 is a nearby spiral, morphologically very similar to M33 apart from the fact that NGC 2403 lacks a distinct nucleus. It is a textbook example of an Sc-type spiral, and it is very well resolved on our NOT images. A photographic survey of star clusters in NGC 2403 was already carried out by Battistini et. al. 1984, who succeeded in finding a few YMC candidates. NGC 2403 spans more than 20 20 arcminutes in the sky, so we have been able to cover only the central parts using the ALFOSC. Within the central (about 66 Kpc) we have located 14 clusters altogether, but the real number of clusters in NGC 2403 should be significantly higher, taking into account the large fraction of the galaxy that we haven’t covered, and considering the fact that in the other galaxies we have studied, many clusters are located at considerable distances from the centre.
5.4 NGC 2997
NGC 2997 is an example of a “hot spot” galaxy (Meaburn et. al. 1982) with a number of UV luminous knots near the centre. Walsh et. al. (1986) studied the knots and concluded that they are in fact very massive star clusters, and Maoz et. al. (1996) further investigated the central region of NGC 2997 using the HST. On an image taken with the repaired HST through the F606W filter they identified 155 compact sources, all with diameters of a few pc. Of 24 clusters detected in the F606W filter as well as in an earlier F220W image, all have colours implying ages less than 100 Myr and masses . Maoz et. al. (1996) conclude that the clusters in the centre of NGC 2997 will eventually evolve into objects resembling globular clusters as we know them in the Milky Way today.
In our study we have found a number of massive star clusters also outside the centre of NGC 2997. Taking the numbers at face value, the cluster system does not appear to be as rich as that of NGC 5236, but with better and more complete data we would expect to see a number of YMCs in NGC 2997 that could rival that in NGC 5236.
5.5 NGC 3621
This galaxy is at first sight a quite ordinary late-type spiral, and has not received much attention. It was observed with the HST by Rawson et. al. (1997) as part of the Extragalactic Distance Scale Key Project, and cepheids were discovered and used to derive a distance modulus of 29.1.
Our data show that NGC 3621 contains a surprisingly high number of massive star clusters. The galaxy is rather inclined (, Rawson et. al. 1997), and nearly all the clusters are seen projected on the near side of the galaxy, so a number of clusters on the far side may be hidden from our view. Ryder & Dopita (1993) noted a lack of HII regions on the far side of the galaxy, and pointed out that there is also a quite prominent spiral arm on the near side that doesn’t appear to have a counterpart on the far side. So it remains possible that the excess of young clusters and HII regions on the near side is real.
5.6 NGC 5204
NGC 5204 is a companion to the giant Sc spiral M101. The structure of the HI in this galaxy is that of a strongly warped disk (Sicotte & Carignan 1997), and one could speculate that this is related to tidal interaction effects with M101. Sicotte & Carignan (1997) also find that the dark matter halo of NGC 5204 contributes significantly to the mass even in the inner parts.
The high value of this galaxy is a consequence of its very low rather than a high absolute number of clusters - we found only 7 clusters in this galaxy. Curiously, all of the 7 clusters belong to the “red” class, suggesting that no new clusters are being formed in NGC 5204 at the moment.
5.7 NGC 5236
NGC 5236 (M83) is a grand-design barred spiral of type SBc, striking by its regularity and its very high surface brightness - the highest among the galaxies in our sample. The absolute visual magnitude is (de Vaucouleurs et. al. 1983). NGC 5236 is currently undergoing a burst of star formation in the nucleus as well as in the spiral arms.
A study in the rocket UV (Bohlin et. al. 1990) has already revealed the presence of a number of very young massive star clusters inside the HII regions of NGC 5236, and HST observations of the nucleus (Heap et. al. 1993) showed an arc of numerous OB clusters near the centre of the galaxy. These clusters were found to have absolute visual magnitudes in the range from to . and typical radii of the order of 4 pc. Masses were estimated to be between and .
Our investigation adds a large number of massive star clusters in NGC 5236 also outside the centre and the HII regions. In terms of absolute numbers the cluster system of NGC 5236 is by far the richest in our sample, and in particular there is a large number of clusters in the “red” group. This may be partly due to reddening effects although Fig. 6 shows that there is in fact a large intrinsic age spread among the clusters in NGC 5236.
5.8 NGC 6946
The study of NGC 6946 is complicated by the fact that it is located at low galactic latitude (), and there is an interstellar absorption of magnitudes and a large number of field stars towards this galaxy. NGC 6946 is nevertheless a well-studied galaxy, and we also chose to include it in our sample, reasoning that star clusters should be recognizable as extended objects on the NOT data.
The chemical abundances of HII regions in NGC 6946 were studied by Ferguson et. al. (1998), who concluded that their data were consistent with a single log-linear dependence on the radius. At 1.5-2 optical radii (defined by the B-band 25th magnitude isophote) they measured abundances of O/H of about 10%-15% of the solar value, and N/O of about 20% - 25% of the solar value.
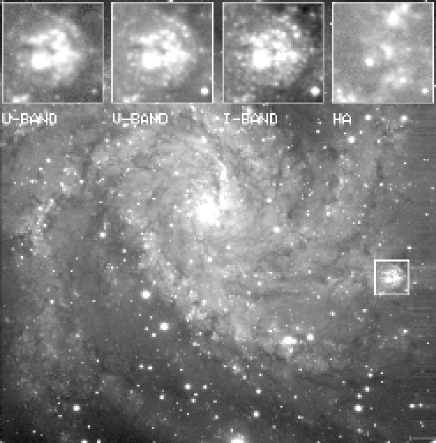
Among the approximately 100 clusters we have identified in NGC 6946, one stands out as particularly striking (Fig. 7). This cluster is apparently a very young object, located in one of the spiral arms at a distance of 4.4 Kpc from the centre, and with an impressive visual luminosity of . Using a deconvolution-like algorithm (Larsen 1999), the effective radius was estimated to be about 15 pc. The cluster is located within a bubble-like structure with a diameter of about 550 pc, containing numerous bright stars and perhaps some less massive clusters. On optical images this structure is very conspicuous, but it is not visible on the mid-IR ISOCAM maps by Malhotra et. al. (1996). There are no traces of emission either, except for a small patch at the very centre of the structure.
5.9 LMC and M33
For these galaxies, we have adopted data from the literature.
As mentioned in the introduction, both the LMC and M33 contain young star clusters that are more massive than the open clusters seen in the Milky Way. However, as is evident from Table 2, only one cluster in M33 is a YMC according to our criteriae. The LMC, on the other hand, contains a relatively rich cluster population, with 7 clusters in the “red” group and 1 cluster in the “blue” group. The cluster R136 in the 30 Doradus nebula of the LMC has not been included in the data for Table 2 because of its location within a giant HII region. Compared to the other galaxies in our sample, the LMC ranks among the relatively cluster-rich ones, but it is also clear that a cluster population like the one of the LMC is by no means unusual.
Because the LMC is so nearby, the limiting magnitude for detection of clusters is obviously much fainter than in the other galaxies in our sample, and the Bica et. al. (1996) catalogue should certainly be complete down to our limit of , corresponding to (taking into account an absorption of about 0.25 mags. towards the LMC). If the LMC was located at the distance of most of the galaxies in our sample we would probably not have detected 8 clusters, but a somewhat smaller number, and the value would have been correspondingly lower. This should be kept in mind when comparing the data for the LMC with data for the rest of the galaxies in the sample.
6 Radial density profiles of cluster systems


As an attempt to investigate how cluster formation correlates with the general characteristics of galaxies, we have compared the surface densities of YMCs (number of clusters per unit area) as a function of galactocentric radius with the surface brigthness in , , and . Obviously, such a comparison only makes sense for relatively rich cluster systems, and is shown in Fig. 8 for four of the most cluster-rich galaxies in our sample. We did not include data for the apparently quite cluster-rich galaxy NGC 6946 in Fig. 8 because of the numerous Galactic foreground stars in the field of this galaxy which make the cluster identifications less certain.
The surface brightnesses were measured directly on our CCD images using the phot task in DAOPHOT. In the case of we used continuum-subtracted images, obtained by scaling an R-band frame so that the flux for stellar sources was the same in the R-band and images, and subtracting the scaled R-band image from the image. The flux was measured through a number of apertures with radii of 50, 100, 150 pixels, centered on the galaxies, and the background was measured in an annulus with an inner radius of 850 pixels and a width of 100 pixels. The flux through the i’th annular ring was then calculated as the flux through the i’th aperture minus the flux through the (i-1)’th aperture, and the surface brightness was finally derived by dividing with the area of the i’th annular ring. No attempt was made to standard calibrate the surface brightnesses, so the -axis units in Fig. 8 are arbitrary. The cluster “surface densities” were obtained by normalising the number of clusters within each annular ring to the area of the respective rings. Finally, all profiles were normalised to the V-band surface brightness profile.
For all the galaxies in Fig. 8 the similarity between the surface brightness profiles and the cluster surface densities is quite striking. In the cases of NGC 2997 and NGC 5236, where the profiles are markedly different from the broad-band profiles, the cluster surface densities seem to follow the profiles rather than the broad-band profiles. Accordingly the presence of massive clusters must be closely linked with the process of star formation in general in those galaxies where YMCs are present. In order to get a complete picture one should include the clusters in the central starbursts of NGC 2997 and NGC 5236, but this would, in any case, affect the conclusions only for the innermost bin.
7 Discussion

Perhaps the most striking fact about the cluster-rich galaxies in our sample is that they do not appear to have a lot of other properties in common. Fig. 9 shows the specific frequency as a function of the “T”-type (Table 1), and does not support the suggestion by Kennicutt & Chu (1988) that the presence of YMCs in galaxies increases along the Hubble sequence. Instead, at wide range of values is seen independently of Hubble type, so even if YMCs might be absent in galaxies of even earlier types than we have studied here the phenomenon cannot be entirely related to morphology.
However, what characterises all these cluster systems is that they do not seem to have been formed during one intense burst of star formation. Instead, their age distributions as inferred from the “S” sequence are quite smooth (possibly with the exception of NGC 1313), so in contrast to starburst galaxies like the Antennae or M82, the rather “normal” galaxies in our sample have been able to maintain a “production” of clusters over a longer timescale, at least several hundred Myr, in a more quiescent mode than that of the starburst galaxies. The most luminous clusters we have found have absolute visual magnitudes of about , about three magnitudes brighter than the brightest open clusters in the Milky Way, but still somewhat fainter than the to clusters in the Antennae and certain starburst galaxies.
One notable exception is NGC 6946 which is forming such a “super star cluster” just before our eyes. That cluster is located far away from the centre of the galaxy, something which is not unusual at all. Also in NGC 1313 the most massive cluster is located far from the centre of the host galaxy, at a projected galactocentric distance of about 3.7 kpc, and in the Milky Way a number of high-mass (old) open clusters are found in the anticentre direction, e.g. M67. It can of course not be excluded that a massive cluster like the one in NGC 6946 could be located in a region of the Galactic disk hidden from our view, but in any case the Milky Way does not seem to contain any large number of young massive clusters as seen e.g. in NGC 5236 or NGC 1313.
In general we find, however, that the distribution of YMCs follows the H surface brightness profile, at least for those galaxies where the statistics allow such a comparison. Taking H as an indicator of star formation, it then appears that in certain galaxies the formation of YMCs occurs whenever stars are formed. This raises the question whether the presence of massive cluster formation is correlated with global star formation indicators, such as luminosity or other parameters. These questions will be addressed in more detail in a subsequent paper (Larsen et. al. 1999).
Two of the galaxies in our sample, NGC 5236 and NGC 2997, have a lot of properties in common. Both galaxies are grand-design, high surface-brightness spirals although NGC 2997 lacks the impressive bar of NGC 5236, and both were known to contain massive star clusters near their centres also before this study. We have identified rich cluster system throughout the disks of these two galaxies.
In our opinion it is becoming clearer and clearer that a whole continuum of cluster properties (age, mass, size) must exist, one just has to look in the right places. For some reason the Milky Way and many other galaxies were only able to form very massive, compact star clusters during the early phases of their evolution, these clusters are today seen as globular clusters in the halos of these galaxies. Other galaxies such as the Magellanic Clouds, M33 and NGC 2403 are able to form substantially larger number of massive clusters than the Milky Way even today, and in our sample of galaxies we have at least 5 galaxies that are able to form clusters whose masses reach well into the interval defined by the globular clusters of the Milky Way. Still more massive clusters are being formed today in genuine starburst and merger galaxies such as the Antennae, NGC 7252, M82 and others, and it seems that the masses of these clusters can easily compete with those of “high-end” globular clusters in the Milky Way. Whether YMCs will survive long enough to one day be regarded as “true” globular clusters is still a somewhat controversial question, whose definitive answer requires a detailed knowledge of the internal structure of the individual clusters and a better theoretical understanding of the dynamical evolution of star clusters in general.
One could also ask if the LF of star clusters really has an upper cut-off that varies from galaxy to galaxy, or if the presence of massive clusters is merely a statistical effect that follows from a generally rich cluster system. In order to investigate this question it is necessary to obtain data with a sufficiently high resolution that the search for star clusters can be extended to much fainter magnitudes than we have been able to do in our study.
8 Conclusions
The data presented in this paper demonstrate that massive star clusters are formed not only in starburst galaxies, but also in rather normal galaxies. None of the galaxies in our sample show obvious signs of having been involved in interaction processes, yet we find that there is a large variation in the specific frequency of massive clusters from one galaxy to another. Some of the galaxies in our sample (notably NGC 1313 and NGC 5236) have considerably higher than the LMC, while other galaxies which at first glance could seem in many ways morphologically similar to the LMC (e.g. NGC 300 and NGC 4395) turn out to contain no rich cluster systems. In general there is no correlation between the morphological type of the galaxies in our sample and their values. Whether a galaxy contains massive star clusters or not is therefore not only a question of its morphology (as suggested by Kennicutt & Chu 1988), so one has to search for correlations between other parameters and the values. Within each of the galaxies that contain populations of YMCs, the number of clusters as a function of radius follows the H surface brightness more closely than the broad-band surface brightness, which implies that the formation of massive clusters in a given galaxy is closely linked to star formation in general.
Acknowledgements.
This research was supported by the Danish Natural Science Research Council through its Centre for Ground-Based Observational Astronomy. This research has made use of the NASA/IPAC Extragalactic Database (NED) which is operated by the Jet Propulsion Laboratory, California Institute of Technology, under contract with the National Aeronautics and Space Administration. We are grateful to J.V. Clausen for having read several versions of this manuscript, and the DFG Graduierten Kolleg “Das Magellansche System und andere Zwerggalaxien” is thanked for covering travel costs to S.S. Larsen.References
- (1) Ashman K.M., Zepf S.E. 1998, ”Globular Cluster Systems” Cambridge University Press
- (2) Barth A.J., Ho L.C., Filippenko A.V., Sargent W.L.W. 1995, AJ 110, 1009
- (3) Battistini P., Bònoli F., Federici L., Fusi Pecci F., Kron R.G. 1984, A&A, 130, 162
- (4) Bertelli G. et. al., 1994, A&AS 106, 275
- (5) Bica E., Clariá J.J., Dottori H., Santos J.F.C. Jr., Piatti A.E. 1996, ApJS 102, 57
- (6) Bohlin R.C. et. al. 1990, ApJ 363, 154
- (7) Bottinelli L., Gouguenheim L., Paturel G., de Vaucouleurs G., 1985, ApJS 59, 293
- (8) Brandl B. et. al. 1996, ApJ 466, 254
- (9) Bresolin F., Kennicutt R.C., Stetson P.B., 1996, AJ 112, 1009
- (10) Bruzual G.A., Charlot S. 1993, ApJ 405, 538
- (11) Carignan C. 1985, ApJS 58, 107
- (12) Christian C.A. & Schommer R.A. 1988, AJ 95, 704
- (13) Elmegreen B.G., Efremov Y.N. 1997, ApJ 480, 235
- (14) Elson R.A.W., Fall S.M. 1985, ApJ 299, 211
- (15) Ferguson A.M.N., Gallagher J.S., Wyse R.F.G. 1998, AJ 116, 673
- (16) Filippenko A.V., Sargent W.L.W. 1989, ApJ 342, L11
- (17) Fischer P., Welch D.L., Cote P., Mateo M., Madore B.F. 1992, AJ 103, 857
- (18) Freedman W.L., Madore B.F. 1988, ApJ 332, L63
- (19) Freedman K.C. et. al. 1992, ApJ 396, 80
- (20) Fritze-v. Alvensleben U. 1998, A&A 336, 83, astro-ph/9803139
- (21) Girardi L., Bica F. 1993, A&A 274, 279
- (22) Girardi L., Chiosi C., Bertelli G., Bressan A. 1995, A&A 298, 87
- (23) Gnedin O.Y., Ostriker J.P. 1997, ApJ 474, 223
- (24) Harris W.E., van den Bergh S. 1981, AJ 86, 1627
- (25) Heap S.R., Holbrook J., Malumuth E., Shore S., Waller W. 1993, BAAS 182
- (26) Ho L.C., Filippenko A.V., Sargent W.L.W. 1995, ApJS 98, 477
- (27) Holtzman J.A. et. al. 1992, AJ 103, 691
- (28) Holtzman J.A. et. al. 1996, AJ 112, 416
- (29) Karachentsev I.D., Drozdovsky I.O. 1998, A&AS 131, 1
- (30) Karachentsev I., Musella I., Grimaldi A. 1996, A&A 310, 722
- (31) Kennicutt R.C., Chu Y-H. 1988, AJ 95, 720
- (32) Landolt A.U. 1992, AJ 104, 340
- (33) Larsen S.S. et. al. 1999, A&A, in preparation
- (34) Larsen S.S. 1999, A&A, in preparation
- (35) Lyngå G. 1982, A&A 109, 213
- (36) Malhotra S. et. al., 1996, A&A 315, L161
- (37) Maoz D. et. al. 1996, AJ 111, 2248
- (38) Meaburn J., Terrett D.L. 1982, MNRAS 200, 1
- (39) Miller G.E. & Scalo J.M. 1979, PASP 90, 506
- (40) O’Connell R.W., Gallagher III J.S., Hunter D.A. 1994, AJ 433, 65
- (41) O’Connell R.W., Gallagher III J.S., Hunter D.A., Colley W.N. 1995: ApJ 446, L1
- (42) Rawson D.M. et. al. 1997, ApJ 490, 517
- (43) Richtler T. 1993, “The Globular Cluster-Galaxy Connection” eds. G.H. Smith & J.P. Brodie, ASP p. 375
- (44) Ryder S.D. & Dopita M.A. 1993, ApJS 88, 415
- (45) Ryder S.D., Staveley-Smith L., Malin D., Walsh W. 1995, AJ 109, 1592
- (46) Salpeter E.E. 1955, ApJ 121, 161
- (47) Sandage A. & Bedke J. 1994, “The Carnegie Atlas of Galaxies” Carnegie Institution of Washington
- (48) Scalo J.M. 1986, Fundamentals of cosmic physics 11, 1
- (49) Schweizer F., Miller B.W., Whitmore B.C., Fall M.S. 1996, AJ 112, 1839
- (50) Shanks T. 1997, MNRAS 290, L77
- (51) Sicotte V., Carignan C. 1997, AJ 113, 609
- (52) van den Bergh S. 1991, ApJ 369, 1
- (53) van den Bergh S. 1995, ApJ 450, 27
- (54) de Vaucouleurs G., 1963, ApJ 137, 720
- (55) de Vaucouleurs G., 1979a, AJ 84, 1270
- (56) de Vaucouleurs G., 1979b, ApJ 227, 729
- (57) de Vaucouleurs G., Pence W.D., da Voust E. 1983, ApJS 53, 17
- (58) de Vaucouleurs G., de Vaucouleurs A., Corwin H.G., Buta R.J., Paturel G., Fouqué P. 1991, “Third Reference Catalogue of Bright Galaxies”, Springer-Verlag New York
- (59) Walsh J.R., Nandy K., Thompson G.I., Meaburn J., 1986, MNRAS 220, 453
- (60) Walsh J.R., Roy J.-R. 1997, MNRAS 288, 726
- (61) Wang O.D., Yu K.C. 1995, AJ 109, 698
- (62) Watson et. al. 1996, AJ 112, 534
- (63) Whitmore B.C., Schweizer F., Leitherer C., Borne K., Robert C., 1993, AJ 106, 1354
- (64) Whitmore B.C., Schweizer F., 1995, AJ 109, 960
- (65) Worthey G. 1994, ApJS 95, 107
- (66) Östlin G., Bergvall N., Rönnback J. 1998, A&A 335, 85, astro-ph/9804072