Correlated variability of Mkn 421 at X-ray and TeV wavelengths on timescales of hours.
Abstract
Mkn 421 was observed for about two days with BeppoSAX, prior to and partly overlapping the start of a 1 week continuous exposure with ASCA in April 1998, as part of a world-wide multiwavelength campaign. A pronounced, well defined, flare observed in X-rays was also observed simultaneously at TeV energies by the Whipple Observatory’s 10 m gamma-ray telescope. These data provide the first evidence that the X-ray and TeV intensities are well correlated on time-scales of hours.
keywords:
BL Lacertae objects; X-rays and gamma-rays: spectra1 Introduction
It is now widely recognized that the strong and variable non- thermal emission observed in BL Lac objects is due to a relativistic jet oriented at a small angle to the line of sight. The origin of such jets is not understood at present and observations of the broad band continuum offer a means to pin down radiation processes and derive the physical parameters of the jet including the bulk Lorentz factor of the flow.
Mkn 421 is the brightest BL Lac object at X-ray and UV wavelengths and the first extragalactic source discovered at TeV energies (Buckley, this workshop). The emission up to X-rays is thought to be due to synchrotron radiation from high energy electrons in the jet, while it is likely that gamma-rays from GeV to TeV energies derive from the same electrons via inverse Compton scattering of soft photons ( e.g., Ulrich, Maraschi and Urry 1997, and refs therein).
If the above model is correct, a change in the density and/or spectrum of the high energy electrons is expected to produce simultaneous variations at the frequencies emitted by the same electrons through the two processes. In particular, the two peaks present in the broad band spectral energy distribution (SED) should ”correspond” to electrons of the same energy. Hence, a correlation between X-ray and TeV emission is expected.
Simultaneous observations in the above two bands indeed provided significant evidence of correlation on relatively long timescales but due to insufficient sampling did not probe short timescales (Catanese et al. 1997, Buckley et al. 1996). A new campaign was organized in 1998 to obtain continuous coverage in X-rays for at least one week with ASCA complemented by other space and ground based telescopes. Preliminary results are reported at this conference by Takahashi and Urry. Here we discuss observations obtained between April 21 – 24 with the BeppoSAX satellite and the Whipple Cherenkov telescope, preceding the start of the ASCA observations. ˚
2 Observations
2.1 BeppoSAX observations
The scientific payload carried by BeppoSAX is fully described in Boella et al. (1997a). The data of interest here derive from three coaligned instruments, the Low Energy Concentrator Spectrometer (LECS, 0.1-10 keV, Parmar et al. 1997), the Medium Energy Concentrator Spectrometer (MECS, 2-10 keV, Boella et al. 1997b) and the Phoswich Detector System (PDS, 12-300 keV, Frontera et al. 1997).
Observations with BeppoSAX were scheduled prior to but partially overlapping with the ASCA ones in order to extend the interval of time covered and to allow intercalibration. The data reduction for the PDS was done using the XAS software (Chiappetti and Dal Fiume 1997), while for the LECS and MECS linearized cleaned event files generated at the BeppoSAX Science Data Centre (SDC) were used. No appreciable difference was found extracting the MECS data with the XAS software. Light curves were accumulated from each instrument with the usual choices for extraction radius and background subtraction as described in Chiappetti et al. 1998. ˚
2.2 Whipple observations
The observations of gamma-rays in the TeV energy bands were made with the Whipple Collaboration’s 10m Atmospheric Cherenkov Telescope (Cawley et al., 1990; see also Buckley this Volume).
The Whipple camera utilizes fast circular-face photomultiplier tubes arranged in a hexagonal pattern, with intertube spacing of 0.25 deg. In 1997 the camera was upgraded to have 331 pixels giving a total field of view of 4.8 deg. The trigger condition for this camera was that any two of the 331 phototubes register a signal 40 photoelectrons within the coincidence overlap time of 8 nsec. Light-cones, which minimize the dead-space between the phototubes and reduce the albedo effect, are normally used with this camera but were not in place for the observations reported here. The absence of the light-cones as well as the reduced reflectivity of the mirrors (due to exposure to the elements) resulted in a somewhat higher energy threshold than usual for these observations.
Observations were taken on the nights of April 21, 22, 23 and 24, 1998, prior to the major observing campaign with ASCA which is reported elsewhere (Takahashi this Volume). After the detection of a strong flux on April 21 during an initial ON/OFF run ( the source is tracked continuously for 28 minutes and then an equivalent amount of time is spent observing a region offset by 30 minutes in Right Ascension over the same range of elevations and azimuth angles) the subsequent observations were mostly taken in the TRACKING mode to maximize coverage. In the latter mode the source is tracked continuously and the background is estimated from the off-axis events.
To cover an observation period of 4 hours, observations were made over a large range of zenith angles. Because the collection area and energy threshold increase with zenith angle the observed gamma-ray rates are convoluted with a changing collection area and energy threshold. In addition the gamma-ray selection is a function of zenith angle. Hence, the rate variations are not linearly related to the observed flux variations of the source. Thus it was necessary to determine the collection areas so that a light-curve with integral fluxes above a single energy could be derived. Unfortunately, contemporaneous observations of the Crab Nebula were not available with sufficient statistics over all the zenith angles so that this analysis relies entirely on Monte Carlo shower simulations.
The Monte Carlo code (ISU simulation package) was used to generate gamma-ray induced showers at zenith angles of 20 deg. (45000 events), 45 deg. (25000 events) and at 55 deg. (25000 events) zenith angles. The common energy range of all three collection areas covers the range from 2 TeV up to tens of TeV. For comparing rate measurements at the three different zenith angle regimes, it is necessary to set a common energy threshold and to calculate the different collection areas. This is done here by normalizing the rate measurements at 45 and 55 deg. to the collection area at z = 20 deg. and by setting a threshold of 2 TeV, where the telescope has a good sensitivity at all three zenith angle ranges. The results reported here are based on limited statistics and are therefore preliminary. The aim of this analysis is to derive a normalized flux as a function of time rather than absolute fluxes and energy spectra.
3 Results
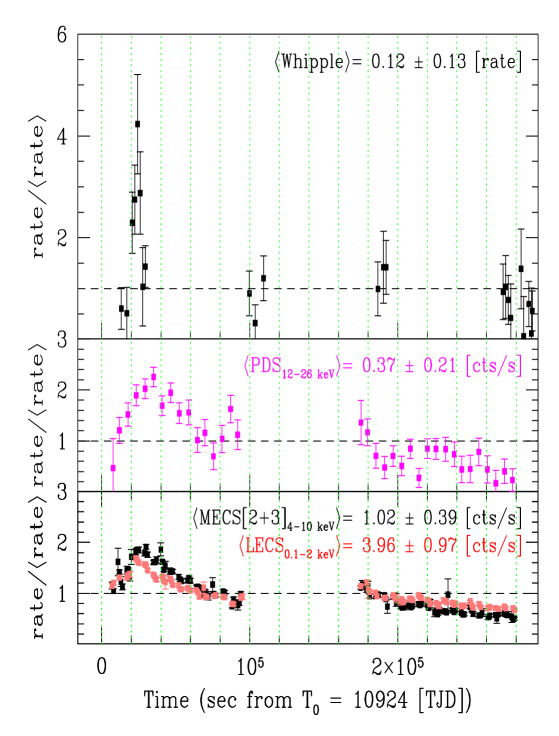
A pronounced, well-defined, flare event is seen during the first day of observation with BeppoSAX. The light curves in 3 energy bands (0.1-2 keV; 4-10 keV; 12-26 keV normalized to their respective means) are plotted in Fig. 1. The selected intervals were chosen so as to represent well- separated ”effective” energies with reasonable statistics. Given the source average spectrum and the instrumental response we can estimate them as keV for the LECS light curve in the 0.1 to 2 keV range, keV for the MECS light curve in the 4-10 keV band and 15 keV for the PDS light curve (15-26 keV). Although the amplitude of the X-ray light curves increases with energy the peak to average intensity ratio is close to 2 in all X-ray bands (see Fig. 1). Further analysis is in progress with a view to quantifying possible systematic differences in the shape of the light curves at different energies.
The normalized event rates per 28 min interval from the Whipple Cherenkov Telescope above the 2 TeV threshold for the four nights are also shown in Fig 1, normalized to the average over the four nights. A clear peak is present with amplitude of a factor 4 and a halving time of about 1 hour. As discussed above the results are preliminary due to the use of Monte Carlo simulations to estimate the telescope collecting area at different zenith angles.
The 0.1-2 keV, 4-10 keV and the 2 TeV peaks are simultaneous with each other within one hour but the halving time of the TeV light curve seems definitely shorter than that of the LECS and MECS light curves. The 12-26 keV light curve seems to peak later but this is uncertain due to the limited statistics. The significance of possible leads/lags needs further study.
4 Discussion and Conclusions
The strong correlation between the TeV and X-ray flares on short time-scales, demonstrated by these data for the first time, supports models in which the high energy radiation arises from the same population of high energy electrons that produce the X-ray flare via synchrotron radiation and in particular from the same spatial region. The most likely mechanism for the production of the TeV photons is inverse Compton scattering of soft photons. In particular, on the basis of the simultaneity of the peaks, those electrons producing the 4-10 keV light curve seem to be the best candidates for producing also the TeV flare.
The fact that the decay of the TeV flux is faster than that of the keV flux could imply that not only the high energy electron spectrum but also the energy density of the target photons varies during the flare, which could happen either in the synchrotron self-Compton or in the mirror scenario (Ghisellini & Maraschi 1996, Dermer, Sturner & Schlickeiser 1997, Ghisellini & Madau 1996). Alternatively, electrons radiating at even higher synchrotron frequencies, whose light curve could not be measured with the present instrumentation, could have faster decay timescales and be responsible for the TeV emission.
Although quantitative models are needed in order to verify whether any of the above scenarios can actually reproduce the observed intensities and timescales in the X-ray and TeV range, we anticipate that these data will represent a very effective probe of the physical conditions in the most active region of the Mrk 421 jet.
References
- [1] Boella, G., et al. 1997a, A&AS, 122, 299
- [2] Boella, G., et al., 1997b, A&AS, 122, 327
- [3] Buckley, J.H., et al. 1996, ApJ, 472, L9
- [4] Catanese, M., et al. 1997, ApJ, 487, L143
- [5] Cawley, M.F. et al, 1990, Exp. Astron., 1, 173
- [6] Chiappetti, L., & Dal Fiume, D., Proc. of the 5th Workshop ”Data Analysis in Astronomy” Erice 27 Oct - 3 Nov 1996, Ed.V.Di Gesú et al., pag. 101.
- [7] Chiappetti, L., et al. 1998, submitted to ApJ
- [8] Dermer, C. D., Sturner, S. J., & Schlickeiser, R. 1997, ApJS, 109, 103
- [9] Frontera, F., et al. 1997, A&AS, 122, 357
- [10] Ghisellini, G. & Maraschi, L., 1996, ASP Conf. Ser., 110, 436
- [11] Ghisellini, G. & Madau, P. 1996, MNRAS, 280, 67
- [12] Parmar, A.N., et al. 1997, A&AS, 122, 309
- [13] Ulrich, M.H., Maraschi, L., Urry, C.M., 1997, Ann. Rev. Astron. and Astroph., 35, 445