Age and Dust Degeneracy for Starburst Galaxies Solved?
Abstract
A spectral evolution model of galaxies that includes both stellar and dust effects is newly built. xApplying the model to 22 nearby starburst galaxies, we have shown that far infrared luminosity of galaxies helps to break the age-dustiness degeneracy. We have derived a unique solution of age and the dustiness for each starburst galaxy. The resulting starburst ages and optical depths are in the range and , respectively. The result is robust and is almost independent of model assumptions such as dust distributions, extinction curves, and burst strengths. With the rapidly growing sensitivity of submillimeter detectors, it should become possible in the near future to determine the age and of star-forming galaxies at redshifts and beyond. Accurate estimates of for Lyman-break galaxies and high-z galaxies might require a substantial revision of the previously claimed picture of star formation history over the Hubble time.
keywords:
dust, extinction — galaxies: ISM — galaxies: starburst — galaxies: stellar content – radiative transferTAKAGI, ARIMOTO & VANSEVIČIUS \rightheadDust in Starburst Galaxies
1 INTRODUCTION
Starburst (SB) galaxies in the nearby Universe are the best sites to study dust. Star formation in the SB galaxies should occur in localized regions, where massive OB stars are deeply embedded in gas clouds that contain significant amounts of dust on average. The bulk of the photons emitted from burst populations are absorbed and partly scattered by dust, and are re-radiated in at far infrared (FIR) wavelengths. The intrinsic spectral energy distribution (SED) of the SB population is thus considerably modified in the UV. This applies not only to the nearby SB galaxies, but also to star-forming galaxies at high redshifts, since a timescale of heavy element synthesis in massive galaxies at an initial burst of star formation should be as short as yr (e.g., Arimoto & Yoshii 1987), and thus galaxies at high redshifts should contain as much dust as the nearby galaxies do. In recent years, there have been many attempts to derive the history of the star formation rate (SFR) in the Universe, e.g., by converting the UV light densities to the SFRs of the CFRS (Canada France Redshift Survey) galaxies at (Lilly et al. 1996) and the HDF (Hubble Deep Field) galaxies at (Madau et al. 1996; Connolly et al. 1997). However, without precise estimates of the dust extinction and stellar age, it could be misleading to use the observed UV flux density as an indicator of the SFR, because the UV light is most sensitive to dust obscuration (Meurer et al. 1997; Rowan-Robinson et al. 1997; Calzetti 1998). Unfortunately, the UV-near infrared (NIR) SEDs are degenerate in stellar age and dust attenuation (Gordon, Calzetti, & Witt 1997). Complicated analyses of the SEDs are required to solve this degeneracy by incorporating the dust effects into a model of galaxy spectral evolution. The nearby SB galaxies are most suitable to calibrate the dust effects in actively star forming environments. Once the degeneracy is solved, an attempt can be made immediately to determine the ages of Lyman-break galaxies (Steidel et al. 1996) at high redshifts which are obviously too red to be dust-free star-forming galaxies (Meurer et al. 1997). It would also be possible to derive the age of primeval galaxy candidates in which the bulk of stars of present-day ellipticals formed in a relatively shortlived starburst for the first time (Hughes, Dunlop, & Rawlings 1997).
Gordon et al. (1997) studied the UV-NIR SEDs of 30 SB galaxies which manifest star-forming activity by the strong UV SEDs and intense line emissions. These are irregular and spiral galaxies with disturbed morphologies locating at a median distance 60 Mpc (hereafter H0=50 km s-1 Mpc-1). Gordon et al. (1997) found that these galaxies show little evidence for a bump at , suggesting that the extinction curve similar to that of the Small Magellanic Cloud (SMC) is more suitable than that found for the Milky Way (MW). The best geometry that describes the SB region was found to have the inner dust-free cavity having star clusters surrounded by the dust shell with local clumpy dust condensations. Gordon et al. (1997) tried to get the ages for two SBs by using the UV-NIR colors, but failed to determine them uniquely. This suggests that the SB ages cannot be determined from the UV-NIR SEDs alone.
The aim of this work is to investigate the SB galaxies studied by Gordon et al. (1997) with additional IRAS data and to derive the accurate age and the dust attenuation of the SB population. In §2, we briefly describe our model, in §3 we describe our data sample, and in §4 we demonstrate that we are successful in disentangling the burst age and the dust attenuation in the UV-FIR SEDs, and derive the burst parameters for 22 individual SB galaxies. In §5, we discuss cosmological implications of our results and conclude this article in §6.
2 Model of starburst galaxy
Even in the SB galaxies, the burst population does not always dominate the galaxy’s light, to which the underlying population contributes significantly, and sometimes exceeds the burst light if the SB is already aged. We, therefore, adopt a realistic model of star-forming spirals by superposing the burst population on the underlying galaxy. To model the SEDs of SB galaxies, both a stellar evolutionary synthesis model and a dust radiative transfer (RT) model are needed. We use the stellar evolutionary synthesis model of Kodama & Arimoto (1997), the latest version of Arimoto & Yoshii (1986; 1987). We calculate accurately the radiative transfer of the stellar photons through the dust by solving the transfer equations (Takagi, Vansevičius, & Arimoto 1998). Main ideas concerning the structure of SB galaxies are borrowed from Witt, Thronson & Capuano (1992) and Gordon et al. (1997).
2.1 Structure of the starburst galaxy
We have adopted a two-component model for the SB galaxy: the galaxy consists of the SB region and the underlying population and is characterized with a free parameter , a mass ratio of the SB to the total galaxy. The radiative transfer and the evolutionary models are calculated for both components independently. We assume that the densities of star and dust in the underlying population follow the modified King’s distribution:
| (1) |
where means a core radius of the galaxy. The distribution of stars in the SB region is modeled by a similar but steeper function:
| (2) |
where means the core radius of the SB region. For the underlying and SB regions, the ratio of the total radius, , to core radius, , is fixed to be . The distribution of dust in the SB is assumed to be homogenous for the entire region. Both stellar and dust distributions are integrated up to the same limiting radius.
As a test of validity of the geometry of our models, we have calculated a few models following the suggestion by Gordon et al. (1997). They assumed the SB model as the dusty sphere with the inner dust-free cavity where the stellar population is residing. No significant differences are found for relatively small optical depths , where is integrated from the center to .
The model calculations are carried out for In this paper, the main attention is drawn to the two cases and , which means and of galaxy mass are involved in the starburst. The cases with fail to cover the entire region of the observed colors of the sampled galaxies in terms of age and . For the underlying, we adopt typical parameters for an Sc galaxy, i.e., a mass of , and a radius of kpc. If we assume 30% SB mass to the underlying galaxy, it gives , the SB radius kpc, and the mass , respectively, if the the same average density is adopted in the SB region as in the underlying galaxy. The total mass of the galaxy is then . Such a size of the SB region is in agreement with the area covered by the diaphragm for the observations presented in Gordon et al. (1997).
The numerous tests with different geometrical parameters reveal only small differences in the modeling results. However, in cases with , the precise simultaneous determination of the age and dustiness of SB is model dependent, and have to be carefully calibrated.
2.2 Radiative transfer in dusty galaxy
The radiative transfer in the galaxy and SB is calculated using the RT code developed by Takagi et al. (1998). The code is based on an assumption of spherical symmetry with arbitrary radial distributions of stars and dust. Direct integration along the rays is adopted. The steps of the mesh ( shells) are determined automatically, depending on the stellar and dust distributions, to fulfill the energy conservation. The ray tracing is done in the way suggested by Band & Grindlay (1985). The thermal emission from dust is calculated by assuming an equilibrium of dust particles in the radiation field and by taking into account self-absorption. Up to six isotropic scattering terms are calculated, and losses of energy due to the scattering do not exceed . The total energy losses in the present models are less than . The isotropic scattering is assumed for simplicity without introducing significant errors, since we analyze optically thick cases. We should note that the thermal emission, which is crucial for the present study, is independent of the adopted phase function.
The results were tested by comparing with those obtained by Witt, Thronson, & Capuano (1992) and the output of RT benchmark by Ivezić et al. (1997), and were found to be consistent. Also no significant discrepancies are found between our results and those obtained by DUSTY (Ivezić, Nenkova & Elitzur 1997) for the model of a star enshrouded in a dusty envelope with a central dust-free cavity.
For the present investigation, is adopted as a free parameter, i.e., we mimic the amount of dust by changing the optical depth of our models. That means the mass of dust depends on the details of model parameters. This is why we do not derive directly the mass of dust but refer only . Any extinction law can be applied in the code, but for the present investigation we limit ourselves with the MW and SMC extinction curves (Pei 1992). The albedo is taken from Pei (1992) for both of the extinction curves. We truncate the albedo curve for , without introducing any significant error, in the calculation of the scattered light.
2.3 Stellar evolutionary synthesis
The evolutionary synthesis code developed by Kodama & Arimoto (1997) is used for the modeling of the luminosity and chemical evolution of the galaxy and SB. The code is based on the up to date ingredients, such as stellar isochrones, spectral libraries, and chemical yields of various elements, and has been successfully used in a numerous publications (e.g., Kodama et al. 1998; Kodama & Arimoto 1998). The code gives the evolution of synthesized spectra of galaxies (the wavelength range ) in a consistent manner with the galaxy chemical evolution, i.e., the effects of stellar metallicity are explicitly considered (Arimoto & Yoshii 1986).
The underlying population of an Sc galaxy is modeled by following the prescription given by Arimoto, Yoshii & Takahara (1992), i.e., taking the values of all free parameters for an infall model; a SFR Gyr-1, an infall rate Gyr-1, Salpeter initial mass function (IMF) with a slope , and lower and upper stellar masses, and , respectively. We adopt Gyr as the age of galaxy because the observed sample consists of nearby galaxies.
The SB population is modeled by assuming a closed box model with the SFR of Gyr-1. The SFR adopted is equivalent to that of a giant elliptical galaxy (Arimoto & Yoshii 1987). The nebular continuum is neglected in the present models since we limit ourselves to ages Myr when the amount of ionizing photons is negligible except for the very beginning of the bursts at Myr (Leitherer & Heckman 1995; Fioc & Rocca-Volmerange 1997). The IMF for the SB is assumed to be Salpeter-like with , and and , respectively. Such a flat IMF has been suggested for spheroidal galaxies (e.g., Arimoto & Yoshii 1987; Kodama & Arimoto 1997) and for the OB associations in the Milky Way (Massey, Johnson, & DeGioia-Eastwood 1995).
The metallicities given by Calzetti, Kinney, & Storchi-Bergmann (1994) for the SB galaxies are attributed to the ionized gas, and the averaged value for the sampled galaxies () is very close to solar. Nevertheless, we calculate our models with the initial metallicity, and , there is no significant differences. Therefore, the initial metallicity of the SB region is adopted to be solar.
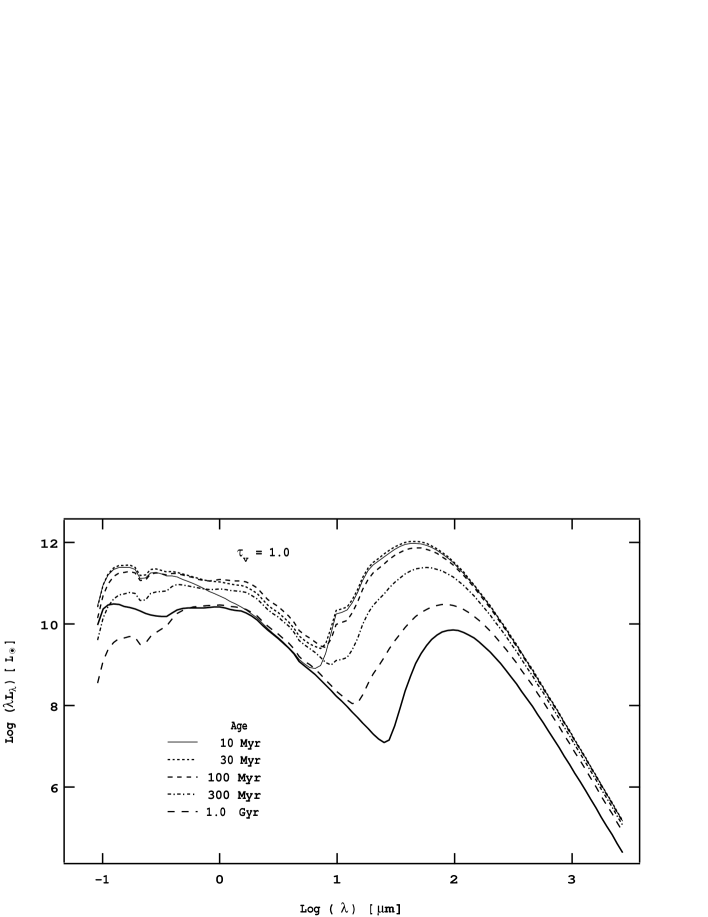
The SEDs of the underlying galaxy and the SB region at different ages are shown in Fig.1. The thick solid line represents the underlying at Gyr. For the SBs, all SEDs are plotted for . The optical depth for the underlying galaxy is fixed at throughout the paper.
3 Observational data
The observational data of SB galaxies are taken from Gordon et al. (1997). They presented the homogeneous sample of aperture-matched observations of SB galaxies from the far-UV to NIR. The size of the diaphragm of the observations is arcsec, which is equal to kpc at their sample’s median distance of Mpc.
We have supplemented the NIR colors for galaxies (NGC1510, NGC5236, NGC5253 and NGC7552) by taking data from available multiaperture photometry (de Vaucouleurs & Longo 1988), which allows us to reduce the observed magnitudes to the effective aperture used by Gordon et al.(1997).
The IRAS flux densities are taken from NED (NASA/IPAC Extragalactic Database) and have been color corrected. Two galaxies (Mrk 309 and Mrk 542) in the sample have only upper limits for the flux density. It is important to note that the IRAS colors are derived for the total galaxy while our sample (UV-NIR) is aperture limited. Nevertheless, taking into account the conclusion drawn by Calzetti et al.(1995) concerning the strong central concentration of FIR in the galaxies of the present sample, we believe that the necessary aperture correction does not change significantly our main conclusions.
Finally we end up with a sample complete in B, H, and IRAS and fluxes for galaxies. The choice of present colors B, H, and FIR is done after an analysis of all the observational data given by Gordon et al.(1997). Only in the case of B-H and , the disentangling of the age and dustiness is successful. is the FIR luminosity derived from and fluxes (Londsdale et al. 1985). Table 1 gives the observations and derived parameters of the SB galaxies: column (1) gives the name of galaxy, columns (2) and (3) indicate B-H and , respectively, and columns (4)-(11) give the derived age in Myr and the optical depth (see §4) for both the MW and SMC extinction curves.
4 Results
The comparison of model results with the observed properties of SB galaxies is divided into two steps: a determination of the age and dustiness of SB galaxies, and a comparison of the observed SEDs with model predictions for the age and the opacity sequences.
4.1 Simultaneous determination of the starburst age and dustiness
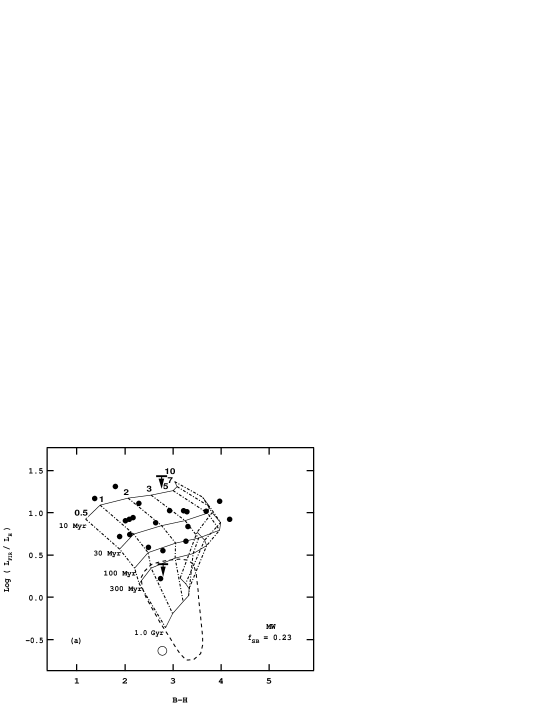
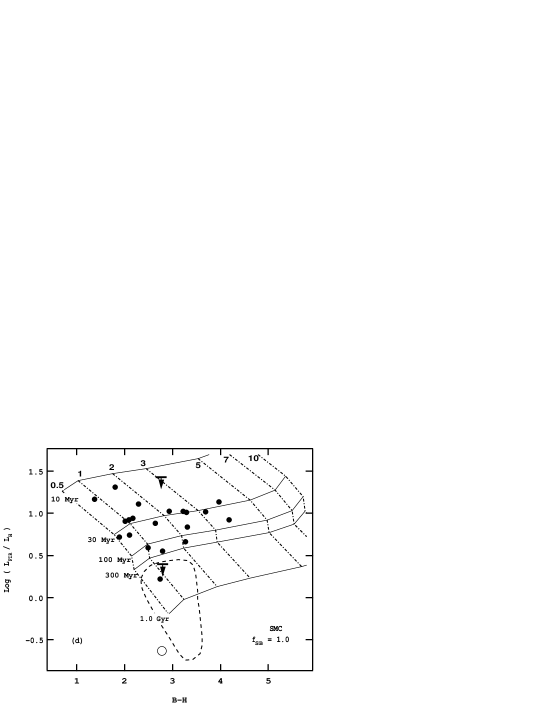
The calibration of SB galaxies with by the age and dustiness for the MW extinction curve is shown in Fig.2a. The data points are taken from Table 1. The large circle indicates the underlying galaxy. An area indicated by a dashed curve represents the region occupied by Coma spirals (Gavazzi, Randone & Branchini 1995). The solid lines show the isochrones with increasing from the left () to the right (). The dot-dashed lines show the isoopaques with increasing age of the SB from the top ( Myr) to the bottom ( Gyr).
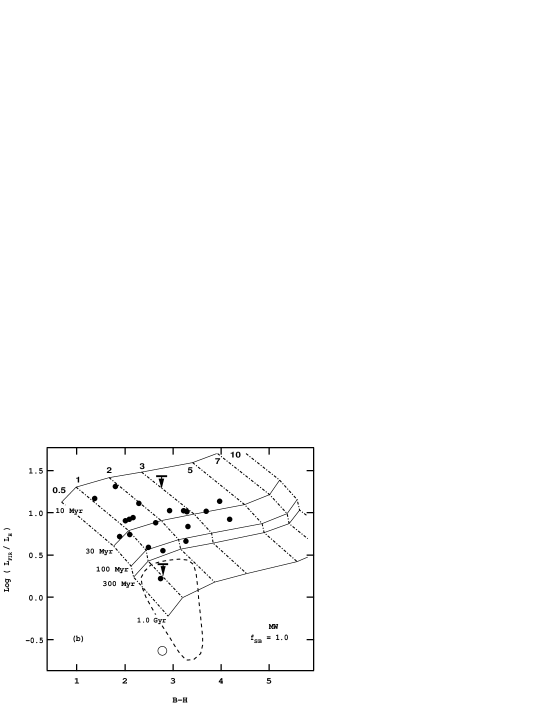
It is obvious that FIR luminosity of galaxies helps to break the age-dustiness degeneracy, and we have the unique solution for the SBs with . The range of validity depends on assumed. Fig.2b shows the same diagram as Fig.2a but for , i.e., the galaxy has 100% SB population. As we can see in Fig.2b, the applicable range of is significantly larger, but the shape of the grid remains very similar to the case shown in Fig.2a. Therefore, we expect that the assumed value of the free parameter does not influence our conclusions significantly. The derived ages and optical depths for individual SB galaxies are given in Table 1 for and . We note that the burst age and the opacity are nearly the same for different values of . The resulting age ranges from Myr to Myr, which agrees well with Gordon et al.’s (1997) estimate for the present sample of SBs.
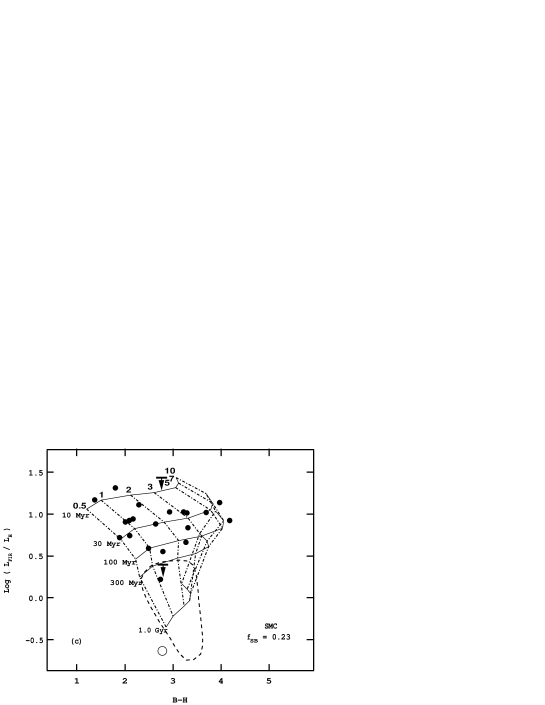
Figs.2c, d are the same as Figs.2a, b, respectively, but for the SMC extinction curve. We note that the burst age and the opacity are nearly the same for different extinction laws. We therefore can conclude that the present method is robust and does not depend on the details of extinction curve and the burst strength.
4.2 SEDs of dusty starburst galaxies
The parameters given in Table 1 are used for grouping of the SB galaxies by the age and the opacity. Two groups of galaxies are defined: (a) those with approximately the same ages ( Myr) but different optical depths (), and (b) those with similar optical depths () but different ages ( Myr). The SEDs inside these groups are averaged and plotted in Figs.3a-h. The model SEDs are superposed on the observational data without any fitting, but both are normalized at the H band to .
Figs.3a-d and Figs.3e-h represent the two different extinction curves (MW and SMC, respectively). The SEDs in Figs.3a,b,e,f represent sequences and in Figs.3c,d,g,h age sequences. The influence of the extinction law is significant in both the UV and FIR spectral regions. The behavior of the SED in UV can be predicted from the shape of the extinction curve only in the case of . A strong nonlinearity is observed for in case of , where the stronger influence of than of the extinction law on the UV part of SED is observed, since the significant obscuration in the UV hides SB population and the underlying galaxy, which is characterized by a MW extinction curve, becomes dominant. FIR emission is affected more regularly by the extinction curve and the burst strength, i.e., the FIR part of SED becomes cooler for the SMC extinction law and brighter for . As we can judge from the far-UV end of the SEDs, the extinction law is steeper than MW but flatter than SMC. Therefore, Calzetti et al. (1994) and Gordon et al. (1997) conclusions concerning the far-UV shape of the extinction curve in SB galaxies are confirmed.
It is important to note that the observed difference in the UV part of SED is much smaller for the age sequence than for the sequence, but the trend is opposite in the FIR region. Along the sequence, the UV-NIR part of SED becomes fainter, while the FIR part becomes more luminous. On the other hand, both the UV-NIR and FIR parts of SED becomes fainter along the age sequence as the stellar population gets older.
Figs.3a-h show that B,H and FIR colors in general give a reasonable estimation for the SEDs of SB galaxies from the UV to FIR. Nevertheless, we have to stress that Figs.3a-h are given without any fitting of the parameters, i.e., they represent a general behavior of our models used to determine the age and . Moreover, the observational data are averaged for different age and dustiness groups. The fine tuning of model parameters for each particular galaxy is a subject for a forthcoming paper.
5 Discussion
Gordon et al. (1997) suggested that the dust distribution in SB is best described by a clumpy media, which is not adopted in our modeling. However, we should note that our Figs.2a-d would not change even if we take into account clumpy media, because they can be scaled in B-H and independently of the dust attenuation; thus our arguments are safe so far as we do not discuss the mass of dust which is model dependent. Moreover, Witt & Gordon (1996) suggested that the high conversion efficiency of UV/optical radiation into far-IR thermal dust emission observed in SB galaxies and mergers is due in large part to a change in the structure of the interstellar medium in such systems toward a more homogeneous widely extended distribution. Taking into account this suggestion and the curves corresponding to homogeneously extended distribution in their Fig.19 (the density ratio of interclump-to-clump media, ) , we can expect that our definition of for homogeneous distribution of dust is linearly related with their calculated for the clumpy media.
Figs.3a-h clearly reveal two problems: a discrepancy of the model SEDs and the observed ones in UV region, and a difference of the predicted and observed fluxes in mid-infrared region (MIR).
The first point was discussed extensively by Gordon et al. (1997). We have confirmed their conclusion that the extinction curve in the SB galaxies is steeper than in MW. Therefore, from the comparison of the ages and ’s in Table 1, we conclude that the uncertainty of the extinction curve in the UV is not serious for the present study. However, the deviation of the MW and SMC extinction curves adopted by us from the real one cannot significantly change our results, because the main diagrams (Figs.2a-d) are based on the bluest band B which is not influenced yet by the UV steepening of the extinction curve, and because the supplementary amount of the energy absorbed in far-UV does not increase significantly the FIR flux (Trewhella, Davies & Disney 1997).
The second point, probably, can be explained by the shortcomings of our RT model, because the circumstellar dust and emission from very small grains are not included yet. The circumstellar dust mainly influences flux and is dependent on the number of stars with dusty shells in galaxy. The influence of small grains on the IRAS colors was discussed by Boulanger et al. (1988). They concluded that IRAS and colors depend on the non-equilibrium emission from small grains while and colors depend on the equilibrium emission from large grains. Extensive discussion on the applicability of so called ”classical” grain model to fit the MIR () fluxes from the interstellar medium was given by Helou, Ryter & Soifer (1991). Therefore, our model represents correctly the FIR emission ( and ) from the grains in thermal equilibrium, which is calculated explicitly by our RT code. Moreover, we are using only the FIR colors for age-dustiness determination, and can neglect the discrepancies between the predicted SEDs and the observed colors in the MIR region.
Figs.3a-h indicate that the observed FIR flux ratios (dust temperature indicator) are smaller than the model predictions. This ratio depends on the dust temperature and on the emissivity law of dust grains. The dust temperature depends on the distribution of stellar density, which is rather approximate in our model, a flatter one would result in the cooler dust temperature. We assume the emissivity with the power (, Rowan- Robinson, 1992) If is taken, the discrepancy of the flux ratio would reduce (Hughes et al. 1997). However, such a fine tuning of the model is beyond a scope of this article, since both effects would not change significantly the total FIR flux used for breaking the age-dustiness degeneracy.
We have demonstrated that the use of SEDs from far-UV to FIR is quite effective in disentangling the age and opacity of the SB galaxies. For deriving the opacity, Calzetti, Kinney, & Storchi-Bergmann (1996) and Calzetti (1997) assumed that the intrinsic line ratios are given by a simple model with the optically thick limit, the so-called Case B of Osterbrock (1989), and estimated the opacity from the ratios of attenuated hydrogen emission lines. Although the opacities derived by two methods are correlated, the opacity given by the line method is smaller than the FIR method. This in turn should give systematically older ages for the line method.
One should keep in mind that some of the SB galaxies assigned for ages younger than 20 Myr could well be much younger if their colors are significantly reddened by possible nebular continuum (Fioc & Rocca-Volmerange 1997). However, even if this is the case, the probability for galaxies younger than 10 Myr to reside in this region should be very small, because of short timescale for that stage. Additionally, if galaxies are UV-selected as in Gordon et al. (1997), it would be almost impossible to find such very young SB galaxies due to strong dust obscuration.
Before we conclude this article, we briefly discuss two cosmological implications of the present results. First, if we define the primeval galaxies as massive galaxies at the onset of the first episode of major star formation, presumably progenitors of the present-day ellipticals at high redshifts, these galaxies should look like the SB galaxies in which burst population dominates the galactic light. Thus, it should be possible to determine the age and optical depth of the primeval galaxy candidates with a help of the rest-frame B-H vs. diagram. These galaxies should be spectacular in the rest-frame FIR regime. At the highest redshifts, the FIR and fluxes conveniently fall on into the region of submillimeter atmospheric windows at , , and . Therefore, a search for the primeval galaxies with infrared satellites and submillimeter telescopes, such as IRIS (Infrared Imaging Surveyor; Murakami et al. 1998) and LMSA (Large Millimeter Submillimeter Array; Ishiguro et al. 1994), would be promising. Indeed, the sensitivity of submillimeter arrays is expected to achieve the greatest advances in the immediate future (Hughes et al. 1997).
Second, once the rest-frame B-H and are observed for high redshift galaxies including the Lyman-break galaxies (Steidel et al. 1996), radio galaxies (Dunlop et al. 1996), and QSO host galaxies, the ages and optical depths of these galaxies can be determined uniquely. Then, the resulting age should play the role of a cosmological clock that gives the age-redshift relation of galaxies at high redshifts and will constrain the cosmological picture of the Universe. The resulting should in turn give a correction factor for the UV light, which will make it possible to derive the correct SFR at high redshifts. In other words, it could be misleading to derive the SFR for high redshift galaxies from the UV light alone.
6 Conclusions
In an attempt to break the age-dustiness degeneracy of the SEDs of starburst galaxies, we have built a new spectral evolution model of galaxy that included both stellar and dust effects. The evolutionary code of Kodama & Arimoto (1997) is used to model the spectral and chemical evolution of galaxies, and the radiative transfer is calculated using the RT code developed by Takagi et al. (1998). Applying the model to 22 nearby SB galaxies sampled by Gordon et al. (1997), we have shown that the unique solution can be sought if the FIR luminosity is used for the starbursts with . Except for two opaque galaxies with , the resulting SB ages and opacities are in the range and , when the burst mass fraction is assumed. The result is robust and almost independent of the details of the dust distribution, the extinction curve, and the burst strength. Even in a case of the SB dominant galaxies, the age and are uniquely assigned on the rest-frame B-H vs. diagram. For high redshift galaxies, these wavelength regions conveniently fall on into the NIR, MIR, and submillimeter regions. With the rapidly growing sensitivity of the submillimeter detectors, it should soon become possible to determine the age and of star-forming galaxies at redshifts and beyond. Accurate estimates of for the high redshift galaxies might require a substantial revision of the broad picture of star formation history over the Hubble time proposed by Madau et al. (1996).
Acknowledgements.
We are very grateful to the referee, K.D.Gordon, for helping us to improve the paper significantly. T.T. wish to thank to T.Shibazaki and R.Hoshi for their continuous support and fruitful discussions. This research has made use of the NASA/IPAC Extragalactic Database (NED) which is operated by the Jet Propulsion Laboratory, California Institute of Technology, under contract with the National Aeronautics and Space Administration. This work was financially supported in part by a Grant-in-Aid for the Scientific Research (No.0940311) by the Japanese Ministry of Education, Culture, Sports and Science.References
- [] Arimoto, N., & Yoshii, Y. 1986, A&A, 164, 260
- [] Arimoto, N., & Yoshii, Y. 1987, A&A, 173, 23
- [] Arimoto, N., Yoshii, Y., & Takahara, F. 1992, A&A, 253, 21
- [] Band, D.L., & Grindlay, J.E. 1985, ApJ, 298, 128
- [] Boulanger, F., Beichman, C., Desert, F.X., Helou, G., Perault, M., & Ryter, C. 1988, ApJ, 332, 328
- [] Calzetti, D. 1998, astro-ph/9806083
- [] Calzetti, D. 1997, AJ, 113, 162
- [] Calzetti,D., Bohlin, R.C., Kinney, A.L., Storchi-Bergmann, T., & Heckman, T.M. 1995,ApJ, 443, 136
- [] Calzetti,D., Kinney, A.L., Storchi-Bergmann, T. 1994, ApJ, 429, 582
- [] Calzetti,D., Kinney, A.L., Storchi-Bergmann, T. 1996, ApJ, 458, 132
- [] Connolly, A.J., Szalay, A.S., Dickinson, M., Subbarao, M.U., & Brunner, R.J. 1997, ApJL, 486, L11
- [] de Vaucouleurs, A., & Longo, G. 1988, Catalogue of visual and infrared photometry of galaxies from 0.5 micrometer to 10 micrometer (1961-1985), University of Texas Monographs in Astronomy, Austin: University of Texas
- [] Dunlop, J.S., Peacock, J., Spinrad, H., Dey, A., Jimenez, R., Stern, D., & Windhorst, R. 1996, Nature, 381, 581
- [] Fioc, M., & Rocca-Volmerange, B. 1997, A&A, 326, 950
- [] Gavazzi, G., Randone, I., & Branchini, E. 1995, ApJ, 438, 590
- [] Gordon, K.D., Witt, A.N., Carruthers, G.R., Christensen, S.A., & Dohne, B.C. 1994, ApJ, 432, 641
- [] Gordon, K.D., Calzetti, D., Witt, A.N. 1997, ApJ, 487, 625
- [] Helou, G., Ryter, C., & Soifer, B.T. 1991, ApJ, 376, 505
- [] Hughes, D.H., Dunlop, J.S., & Rawlings, S. 1997, MNRAS, 289, 766
- [] Ishiguro, M., Kawabe, R., Nakai, N., Morita, K.-I., Okumura, S.K., & Ohashi, N. 1994, in Astronomy with Millimeter and Submillimeter Wave Interferometry, IAU Cool. 140, ASP Conf. Ser., 59, 405
- [] Ivezić, Ž., Groenewegen, M.A.T., Men’shchikov, A., & Szczerba, R. 1997, MNRAS, 291, 121
- [] Ivezić, Ž., Nenkova, M., & Elitzur, M. 1997, User Manual for DUSTY, University of Kentucky
- [] Kodama, T., & Arimoto, N. 1997, A&A, 320, 41
- [] Kodama, T., & Arimoto, N. 1998, MNRAS, in press, astro-ph/9806029
- [] Kodama, T., Arimoto, N., Barger, A.J., & Aragón-Salamanca, A. 1998, A&A, 334, 99
- [] Leitherer, C., & Heckman, T.M. 1995, ApJS, 96, 9
- [] Londsdale, C.J., Helou, G., Good, J.C., Rice, W. 1985, Cataloged Galaxies and Quasars Observed in the IRAS Survey, Jet Propuls. Lab., Pasadena, California
- [] Lilly, S.J., Le Févre, O., Hammer, F., & Crampton, D. 1996, ApJ, 460, L1
- [] Madau, P., Ferguson, H.C., Dickinson, M.E., Giavalisco, M., Steidel, C.C., & Fruchter, A. 1996, MNRAS, 283, 1388
- [] Massey, P., Johnson, K.E., & DeGioia-Eastwood, K. 1995, ApJ, 454, 151
- [] Meurer, G.R., Heckman, T.M., Lehnert, M.D., Leitherer, C., & Lowenthal, J. 1997, AJ, 114, 54
- [] Murakami, H., et al. 1998, ISAS Research Note No.651
- [] Osterbrock, D.E. 1989, Astrophysics of Gaseous Nebulae and Active Galactic Nuclei, University Science Books, New York
- [] Rowan-Robinson, M. 1992, MNRAS, 258, 787
- [] Rowan-Robinson, M., et al. 1997, MNRAS, 289, 490
- [] Pei, Y.C. 1992, ApJ, 395, 130
- [] Steidel, C.C., Giavalisco, M., Pettini, M., Dickinson, M., & Adelberger, K.L. 1996, ApJL, 462, L17
- [] Takagi, T., Vansevičius, V., Arimoto, N. 1998, to be submitted to PASJ.
- [] Trewhella, M., Davies, J.I., & Disney, M.J. 1997, Proc. Cold Dust Morphology, Conf. at WITS University in Johannesburg, South Africa, 22-26th January 1996
- [] Witt, A.N., Thronson, H.A., & Capuano, J.M. 1992, ApJ, 393, 611
- [] Witt, A.N., & Gordon, K.D. 1996, ApJ, 463, 681
| MW | SMC | ||||||||||
|---|---|---|---|---|---|---|---|---|---|---|---|
| Galaxy | B-H | Age | Age | ||||||||
| NGC 1140 | 1.89 | 0.72 | 25 | 30 | 0.7 | 0.8 | 30 | 40 | 0.5 | 0.6 | |
| NGC 1510 | 2.74 | 0.22 | 400 | 500 | 1.1 | 0.9 | 400 | 500 | 1.1 | 0.8 | |
| NGC 1569 | 1.37 | 1.17 | 10 | 15 | 1.0 | 1.1 | 10 | 15 | 0.8 | 0.9 | |
| NGC 1614 | 3.97 | 1.14 | 30 | 25 | 4.3 | 30 | 30 | 5.0 | 4.0 | ||
| NGC 4194 | 3.29 | 1.01 | 25 | 30 | 3.6 | 2.9 | 30 | 30 | 3.3 | 2.6 | |
| NGC 4385 | 3.27 | 0.66 | 100 | 130 | 2.4 | 2.2 | 100 | 200 | 2.2 | 2.1 | |
| NGC 5236 | 2.93 | 1.03 | 20 | 25 | 2.9 | 2.5 | 25 | 30 | 2.6 | 2.2 | |
| NGC 5253 | 1.80 | 1.31 | 10 | 15 | 2.0 | 1.9 | 10 | 15 | 1.8 | 1.6 | |
| NGC 5860 | 2.79 | 0.55 | 130 | 200 | 1.5 | 1.5 | 200 | 300 | 1.4 | 1.4 | |
| NGC 6052 | 2.29 | 1.11 | 15 | 20 | 2.1 | 1.9 | 20 | 25 | 1.9 | 1.7 | |
| NGC 6090 | 3.22 | 1.02 | 25 | 30 | 3.6 | 2.9 | 25 | 30 | 3.3 | 2.6 | |
| NGC 6217 | 3.31 | 0.84 | 50 | 60 | 2.8 | 2.5 | 50 | 80 | 2.6 | 2.4 | |
| NGC 7250 | 2.09 | 0.92 | 20 | 25 | 1.3 | 1.3 | 25 | 30 | 1.1 | 1.1 | |
| NGC 7552 | 3.69 | 1.02 | 30 | 30 | 5.0 | 3.5 | 30 | 30 | 4.5 | 3.1 | |
| NGC 7673 | 2.17 | 0.94 | 20 | 25 | 1.4 | 1.4 | 25 | 30 | 1.2 | 1.2 | |
| NGC 7714 | 2.64 | 0.88 | 30 | 30 | 1.9 | 1.8 | 30 | 40 | 1.7 | 1.6 | |
| Mrk 309 | 2.76 | 1.43 | 10: | 15: | 5.0: | 3.5: | 10: | 15: | 5.0: | 3.1: | |
| Mrk 357 | 2.01 | 0.91 | 20 | 25 | 1.2 | 1.2 | 25 | 30 | 1.0 | 1.0 | |
| Mrk 542 | 2.79 | 0.40 | 400: | 400: | 1.5: | 1.3: | 300: | 400: | 1.3: | 1.2: | |
| IC 214 | 4.18 | 0.92 | 100 | 50 | 4.0 | 100 | 80 | 5.0 | 3.6 | ||
| IC 1586 | 2.49 | 0.59 | 80 | 100 | 1.1 | 1.2 | 100 | 100 | 1.0 | 1.0 | |
| Haro 15 | 2.10 | 0.74 | 30 | 30 | 0.9 | 1.0 | 30 | 40 | 0.7 | 0.8 | |
![[Uncaptioned image]](/html/astro-ph/9902219/assets/x6.png)