Constraining Dark Halo Potentials with Tidal Tails
Abstract
We present an extensive parameter survey to study the influence of halo mass profiles on the development of tidal tails in interacting disk galaxies. We model the galaxies using a fixed exponential disk with a central bulge and vary the halo potential over a range of parameters using both the Hernquist and NFW mass distributions, probing the effect of the halo mass, extent and concentration. We examine the consistency of the results against both observational and theoretical constraints on halo profiles and comment on the failures and weaknesses of different models. Galaxies with rising or flat rotation curves dominated by the halo are inhibited from forming tidal tails unless the halo is abruptly cut off just beyond the disk edge. Conversely, models with declining rotation curves – resulting either from compact, low mass halos, or from massive disk components in low concentration dark halos – produce tidal tails very similar to those observed in well-studied interacting systems. As argued by Springel & White (1998), a unifying, quantitative relation for all cases is that the ratio of the escape velocity to the circular velocity at around the solar radius must be for tidal tails to be produced. The galaxy models which appear to fit most of the observational constraints are those which have disk-dominated rotation curves and low concentration halos. We discuss our results in a cosmological context using recent studies which link halo properties to cosmological models.
1 Introduction
Nearly 30 years have passed since the first observations of the rotation curves of spiral galaxies revealed significant departures from Keplerian form at large distances (e.g., Rubin & Ford 1970; Rogstad & Shostak 1972). Subsequent work has verified this behavior in large samples of spiral galaxies (e.g., Rubin et al. 1980, 1982, 1985; Kent 1987). Unless Newtonian gravity fails on large scales or for small accelerations, these results imply that spiral galaxies possess massive dark halos of unseen matter (Freeman 1970). This interpretation is supported by estimates of the mass content of groups and clusters of galaxies. Furthermore, currently viable cosmological theories invoke the existence of considerable quantities of “dark matter” to account for observed properties of large scale structure. Indeed, a mass-to-light ratio is required for a critical Universe with , far greater than those for normal stellar populations. (For reviews, see e.g., Padmanabhan 1993; Peebles 1993.)
While the existence of dark matter is now generally accepted, its nature and amount remain mysterious. For individual galaxies, these uncertainties translate into an ignorance of the total masses and sizes of galaxies. In principle, these attributes could be inferred precisely for spiral galaxies from sufficiently extended rotation curves, but in no case has the data established Keplerian behavior asymptotically, from which the total mass would follow. Efforts to measure galaxy masses using other tracers of the potential have produced some encouraging results, most notably those based on kinematics of satellites of the Milky Way (e.g., the recent studies of Zaritsky et al. 1989; Kochanek 1996), streams of gas and stars in the Galactic halo (see, e.g., Lin, Jones & Klemola 1995; Johnston et al. 1998), the “timing argument” applied to the Local Group (e.g., Kahn & Woltjer 1959; Peebles et al. 1989; Raychaudury & Lynden-Bell 1989), x-ray coronae of hot gas around ellipticals (see, e.g., Forman, Jones & Tucker 1985), kinematics of satellites of external galaxies (Zaritsky et al. 1993, 1997ab; Zaritsky & White 1994), and weak gravitational lensing of distant galaxies by closer ones (Brainerd, Blandford & Smail 1996). (For reviews, see e.g., Binney & Tremaine 1987; Fich & Tremaine 1991.) These various methods imply that galaxies like the Milky Way are surrounded by massive halos, but in all cases the estimates of halo masses are uncertain to factors .
Previously, it has been suggested that the tidal features associated with interacting galaxies can be used to probe the mass distributions in these objects. In particular, the tidal tails seen in a number of well-studied merging galaxies (e.g., Arp 1966; Arp & Madore 1987) offer several advantages as tracers of the potential. Most important, the tails in systems such as NGC 4038/39 (“The Antennae”), NGC 7252, Arp 193, and Arp 243, to name a few, are bright and lengthy, and hence sample the potential over a wide range in spatial scale. In some cases, the tails span scale lengths of the progenitor disks in projection, likely corresponding to scale lengths in three dimensions (e.g., Schweizer 1982; Schombert, Wallin & Struck-Marcell 1990; Hibbard 1995). The “Superantennae” is the most extreme example known, with tails that extend kpc from tip to tip (Mirabel, Lutz & Maza 1991; Colina, Lipari & Maccheto 1991).
The physics underlying the formation of tidal tails is now well-understood, simplifying their use as a mass probe. That gravitational forces alone could yield such narrow structures was illustrated by Pfleiderer & Seidentopf (1961), Pfleiderer (1963), Yabushita (1971), Clutton-Brock (1972ab), Toomre & Toomre (1972), Wright (1972), and Eneev et al. (1973). But, it was mainly the work of Toomre & Toomre (1972) that emphasized the interpretation of tidal tails as a resonant phenomenon, arising from a match between the orbital angular frequency of the interacting galaxies and the internal angular frequency of the disk stars.
The use of tidal features to map the potentials of interacting galaxies was anticipated already by Faber & Gallagher (1979), who argued that “Massive envelopes [halos] may well have a significant effect on the shapes and velocities of bridges and tails created in tidal encounters.” Soon thereafter, White (1982) offered the prescient remark that “…the relative velocities of the two galaxies at pericenter will be increased and in addition the tails will need to climb out of a deeper potential well… Both these effects make it more difficult to model the long tails in some observed systems.” Indeed, as we discuss below, White’s reasoning is correct, with the shape of the halo potential being the more significant effect. Unfortunately, the first self-consistent studies of galaxy mergers employed a restricted set of halo parameters and were limited to relatively low values of halo to luminous mass. Consequently, these models were relatively insensitive to the effects noted by White (e.g., Barnes 1988, 1992; Hernquist 1992, 1993), prompting Barnes & Hernquist (1992) to (incorrectly) assert, “Since the energy required to climb out [of potential wells] is provided by falling in, mere length [of tails] is probably not an effective constraint on halo masses.”
The possibility of employing tidal material to constrain properties of dark halos was reopened by Dubinski, Mihos & Hernquist (1996; hereafter DMH), who performed N-body simulations of galaxy mergers using more general galaxy models than the previous studies. This enabled DMH to consider a wide range of halo properties and, in particular, to examine the influence of very massive halos on the development of tidal tails. These calculations demonstrated that for the class of galaxy models adopted by DMH, the mechanisms suggested by White (1982) do operate, and that it is indeed difficult for lengthy, massive tails to form in galaxy collisions in which the progenitors are surrounded by very large halos. On this basis, DMH argued that well-known merger candidates such as the Antennae (NGC 4038/39) probably originated through encounters in which the progenitor galaxies had halo to disk plus bulge mass ratios . This finding was supported by the subsequent work of Mihos, Dubinski & Hernquist (1998; hereafter MDH) who applied similar modeling to photometric and kinematic data of the merger remnant NGC 7252.
At face value, these findings are at odds with expectations for the structure of halos in cosmological models with critical mass density (e.g., CDM), , which predict that halos at the current epoch should be significantly more massive and extended than those favored by the simulations of DMH (see, e.g., Zurek et al. 1988; Navarro, Frenk & White 1996). One interpretation of the DMH results is that their modeling argues for a universe in which and in which halos are expected to be less massive and less extended than their counterparts in a universe with critical mass density. Springel & White (1998) have presented contradictory results from simulations using dark halos motivated by CDM and present a possible loophole in which more extended disks can eject long tails in massive halos. Clearly, our understanding of tail formation under different conditions must be improved if we wish to use a relatively simple argument based on the appearances of observed tidal features to constrain , and it is important to consider the loopholes not satisfactorily addressed by the DMH calculations.
One limitation of the DMH work was their use of a restricted set of galaxy models for the progenitors. Their galaxies were constructed to provide good fits to the rotation curves of galaxies like the Milky Way, with increasingly more mass added to the halos at large distances to yield a sequence of models with larger ratios of halo mass to bulge plus disk mass. The halo profiles in these calculations were chosen to correspond to lowered Evans models. While a convenient choice, such mass distributions for the halo are not motivated by cosmological considerations. As we demonstrate below in §3.1, it is the shape of the halo potential which is mainly responsible for controlling the lengths and masses of tails produced in mergers of disk galaxies. Accordingly, it is desirable to consider galaxy encounters with a wider set of halo forms than examined by DMH, to see if large halo masses can still be accommodated by the observed properties of tidal tails for plausible halo mass distributions.
In the modeling described here, we examine this issue by performing a systematic survey of galaxy encounters in which we employ halos that are motivated by cosmological simulations. We consider two choices: the mass distribution suggested for spherical galaxies by Hernquist (1990), which provides a good description of halo structure when late infall is neglected (Dubinski & Carlberg 1991), and the NFW profile (Navarro, Frenk & White 1996) which has been shown to fit halos in cosmological simulations under a wide range of circumstances. The two mass models differ only in the limit , where the NFW profile converges more slowly than that of Hernquist (1990). We find that tail formation is insensitive to this difference and that our conclusions apply to either of these two halo profiles.
As concluded previously by DMH, we again find that when we consider galaxies designed to have flat rotation curves at small distances, tail formation is inhibited for massive halos whose properties are consistent with those seen in cosmological simulations of universes. In such cases, the material expelled from the disks to populate the tails falls back quickly into the merger remnant and such models seem incapable of accounting for the tidal features seen in, e.g., the Antennae, NGC 7252, and objects with more extreme tail attributes such as the Superantennae (Mirabel, Lutz & Maza 1991). Thus, the conflict noted by DMH between observed tidal tails and the predictions of halo formation in cosmologies apparently cannot be resolved by appealing to halo profiles more general than those considered by DMH, but which are still plausible on the basis of cosmological simulations.
In §2, we describe the methods employed in the simulations described here and the galaxy models used in this study. The outcomes of mergers between disk galaxies with varying halo structure are described in §3. There, we demonstrate that the properties of the tails produced in the collisions are mainly sensitive to the shape of the halo potential, rather than differences in encounter velocity. Observational and theoretical implications of our findings are discussed in §4, and we provide conclusions in §5.
2 Methods
2.1 A Restricted 3-body Method
The first studies of galaxy interactions some 30 years ago used the restricted 3-body method to examine this problem. Test particles (“stars”) were placed on circular orbits about two massive particles (representing each galaxy) moving on a Keplerian orbit. This method is simple and computationally inexpensive yet reproduces tidal tails and bridges similar to those seen in much more expensive self-consistent N-body simulations (e.g. Barnes 1988). The restricted method works so well because the formation of tidal tails is essentially a kinematic effect – stars become unbound from the disk during the interaction and move as free test-particles in the combined potential of the interacting galaxies. The restricted method is ideal for extensive parameter surveys since it is many orders of magnitude more computationally efficient than are self-consistent N-body simulations. However, if we wish to use the method to examine more realistic models with varying halo potentials, dynamical friction, and exponential disks of stars, it is necessary to generalize the method.
In this section, we describe a generalized, restricted 3-body method for following the development of tidal tails during galaxy collisions. We retain the scheme of two moving fixed potentials but use more realistic galaxy mass models rather than point masses. We also move these galaxy potentials on a trajectory consistent with their mass distribution and include the loss of orbital energy through dynamical friction. Finally, the phase space distribution of test-particles in the disks is sampled from the distribution function of an exponential disk embedded within the galaxy potentials. The test particle disks will therefore respond to the tidal perturbations in a similar way to real galactic disks.
Our generalized, restricted 3-body method works as follows:
-
1.
We assume that the galaxy potentials are rigid throughout an interaction and merger. While this is not perfectly valid, we find it is adequate for examining kinematic development of tidal tails.
-
2.
We calculate the potential wells of the galaxies using the method of Kuijken and Dubinski (1995), incorporating an exponential disk, a spherical bulge and a spherical dark halo. These models are described by a 3 component distribution function and the potential is calculated as the sum of a low order spherical harmonic expansion and some special functions.
-
3.
We then calculate the expected trajectory either using a previous lower-resolution simulation or an effective interaction potential with a dynamical friction term discussed below.
-
4.
We set up a distribution of disk test-particles consistent with the galaxy potential using the method of Kuijken and Dubinski (1995).
-
5.
We then integrate the motion of the test particles in the net time-dependent potential of the two rigid galaxy potentials moving along the pre-calculated trajectories described above.
This method treats the strength and duration of the tidal field during a collision more accurately than the point mass method and also represents the gradient of the outer potential realistically. We see below that this generalized restricted method produces tidal tails with the same kinematic development as those in self-consistent N-body simulations using the same initial conditions.
2.2 Galaxy Models
We generate all galaxy models in our study using the method described in Kuijken & Dubinski (1995). First, we use the same four “Milky Way” analogs (A, B, C, D) as we did in our previous studies (DMH and MDH). These models have flat rotation curves within 5 exponential scale lengths and are approximately flat to greater distances. We parameterized the halo in these 4 models in terms of a mass, , where , the circular velocity, is approximately constant out to a cutoff radius, . Beyond this radius, the density drops off rapidly and there is very little extra halo mass. Table 1 presents the halo:disk+bulge mass ratio along with the ratio of escape velocity to circular velocity at the following Springel & White (1998). In retrospect, our choice of mass or halo:disk+bulge mass ratio as a model parameter is ambiguous since the formation of tidal tails really depends on the shape of the potential rather than the total halo mass which can be the same for a variety of potentials. We see below that the parameter is a better parameter for describing the shape of the potential. Our implicit assumption, however, is that all of these potentials have same shape at least out to with . While declining rotation curves may be favored on theoretical grounds, it is important to note that for galaxies in which the dark matter distribution can be probed directly – LSB disk galaxies – no such decline is observed out to distances greater than 50 kpc (McGaugh & de Blok 1998). As such, asymptotically flat rotation curves remain the most observationally well-motivated choice for detailed modeling.
Our original survey of four galaxy models in DMH, with the addition of a fifth in MDH, covers the behavior of tidal tail formation in only a limited manner. Other galaxy halo models which have declining rotation curves are certainly possible. While such rotation curve shapes are rarely observed in nature – and are typically associated with the disk-halo transition in the mass distribution rather than with the dark halo alone (e.g., Casertano & van Gorkom 1991) – they are predicted by theoretical modeling of galaxy formation. Dubinski & Carlberg (1991) found in some cosmological simulations of galactic halo formation in the cold dark matter model (CDM) that the Hernquist (H) potential (1990) was a good fit to the halo mass distribution. More recently, Navarro, Frenk & White (1996) have found that another similar profile seems to fit halos from many different cosmological models when late infall is included. The H halo model is described by the potential-density pair,
| (1) |
and,
| (2) |
where is the total mass of the model and is a scale radius. The circular velocity curve peaks at the maximum value,
| (3) |
The NFW halo model is described by the potential-density pair,
| (4) |
and,
| (5) |
where is a reference mass and is a scale radius. The total mass formally diverges while is the mass within 5.3 . The circular velocity peaks at the maximum value,
| (6) |
If we set and then the velocity maxima of the H and NFW models coincide while the NFW rotation curve drops off less steeply than the H rotation curve.
2.3 Galaxy Model Parameters
In this survey, we examine a broader range of galaxy models than in our previous studies, with dark halos described by both the H model and the NFW profile. For these models, we fix the disk and bulge parameters to resemble an Sa galaxy similar to Kuijken and Gilmore’s (1989) mass model of the Milky Way. The disk has an exponential surface density and an approximate vertical profile. We use dimensionless units with the gravitational constant , disk mass, , scale length, and vertical scale height, . The bulge is a truncated King model with mass, and half mass radius, with a density profile. The peak circular velocity, , varies according to the halo mass but for most of the models. For comparison to galaxies like the Milky Way a suitable choice of units is: kpc, km/s which leads to , , and a time unit of Myr.
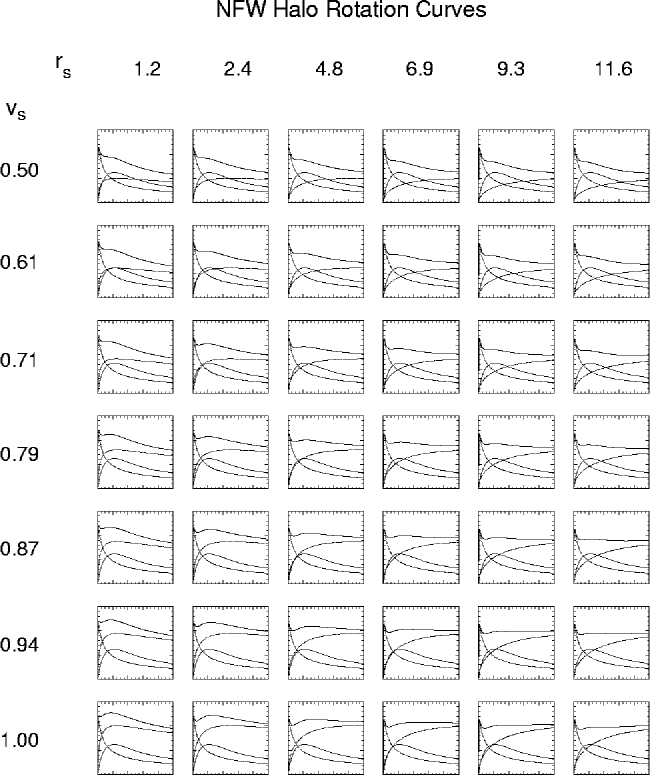
With the disk and bulge parameters fixed, we set up a two parameter family of halos for both the H and NFW potentials. We vary the scale radius ( or ) and the peak circular velocity of the halos ( or ) defined above. The range of halo scale radii is and 25 for the H potential and a similar range of six values with for the NFW potential chosen so the velocity peaks coincide. We also vary the halo masses and so that the velocity peaks cover the range and 1.0. Since the mass of NFW halos is formally infinite it is necessary to truncate the halos at some large radius. The cut-off is at the radius containing a mean over-density, , or the “virial” radius, . In cosmological simulations, , as defined in NFW is approximately 15 times the scale radius for CDM-like halos so we set the truncation radius at 15 . When the models are scaled to the Milky Way, the concentration parameter, , formally varies for the all the models despite the fixed truncation radius (Table 2). However, we find that the physics of tail formation depends only on the behavior within 20 scale lengths, well within the truncation radius of the halos. In total there are 42 galaxy models for each of the H and NFW halo potentials.
The range of halo parameters is chosen to examine different aspects of tail making. The range of scale radii controls the halo concentration and central density. Halos with small scale radii have a higher central density and therefore these galaxies will merge more rapidly than less concentrated ones after they collide because of stronger dynamical friction. Halos with large scale radii have lower central density and impart less friction leading to longer merging times and wider passages after the first interaction. The range of peak circular velocities probes the effect of the shape of the halo potential. Smaller peak velocities correspond to shallower potential gradients and lower escape velocities making it easier for long tidal tails to develop. Figure 1 show the rotation curve decompositions for the 42 NFW models. The rotation curves include rising, falling and nearly flat profiles covering most of the observed range of properties and, as we will see below, many different characteristics of halos from various cosmological models as well. Table 2 presents the formal halo concentration parameters for models scaled to the Milky Way along with the ratio of escape velocity to circular velocity at following Springel & White (1998). The models with low escape velocities are most likely to produce interacting pairs with long tidal tails.
2.4 Interaction Potential
With the galaxy models defined, we need to place them on orbital trajectories consistent with their potentials. Since the mass distribution is extended, the resulting trajectories are significantly different from Keplerian orbits. After experimenting with different interaction potentials, we found that the weighted average of the two galaxy potentials, and , accurately reproduces the galaxy orbits up until the initial collision. This potential is given by:
| (7) |
where is the separation of the two galaxy centers and and are the total masses of the two galaxies. The orbits from are equivalent to a point mass and rigid potential in orbit about their center of mass. Because the galaxies are centrally concentrated, this is a reasonable approximation and the orbits very closely follow those in self-consistent, N-body simulations until perigalacticon.
2.5 Dynamical Friction
During the encounter, orbital energy is lost through dynamical friction. We estimate this loss of energy (again heuristically) using the dynamical friction formula for a satellite sinking in an isothermal density distribution (Binney & Tremaine 1987). In the strong non-linear regime of the encounter of two equal mass galaxies, the Coulomb logarithm, , is not well-defined so we choose a value of to fit the decay of the orbit seen in self-consistent merger simulations. A good compromise value which is a reasonable fit for galaxies with high and low mass halos is .
2.6 Comparison to Self-consistent Interactions
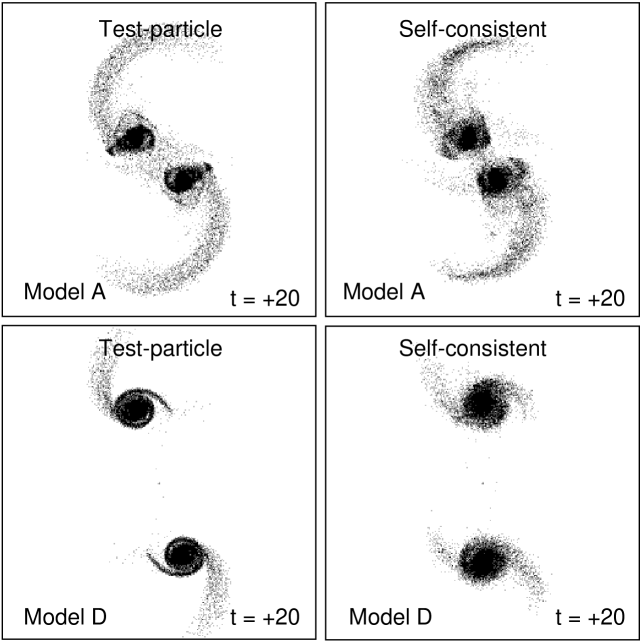
Before applying the restricted 3-body method for our collision survey it is useful to compare its results to those of self-consistent calculations. We consider two direct, co-planar equal mass galaxy collisions using Models A and D, a low and high mass extreme of the dark halos. Figure 2 shows the orbits calculated using the interaction potential with a dynamical friction term compared to the measured trajectory of the galaxy bulges in N-body simulations of the collision. The orbits are almost identical until perigalacticon after which they are still relatively close but are not in exact agreement. Since the tidal tails form after the first encounter, this treatment of the relative separation and speed at encounter should be very close to the self-consistent case. Figure 3 compares the appearance of the galaxies shortly after the interaction at the same time for both models. The results are very similar, showing tidal tails with almost identical mass, shape, length and kinematics. This good agreement emphasizes the point that tidal tails are a kinematic phenomenon and that the distortion of the halo potential at the center does not seem to have much of an effect on the development of the tidal tails after the interaction.
3 Results
3.1 Physics of tail making
Previous work has shown that the lengths and kinematics of tidal tails depend strongly on the potential of the galactic dark halo. Colliding galaxies with low mass and shallow potentials yield long, massive tidal tails moving outwards while the high mass, steep potential counterparts either create short, infalling low-mass tails or inhibit tail formation completely. First, the deeper potentials lead to larger relative encounter velocities which are more impulsive and less resonant and therefore less effective at giving disk stars the velocity perturbation they need to be ejected into tails. Second, the deeper and steeper potential wells of more massive halos trap tail stars by shortening their turn-around radius after ejection. Both effects combine to make the maximum length of tidal tails smaller in the presence of a more massive dark halo. The observed maximum length of tails is therefore telling us something about the mass profile of the dark potential.
Two competing physical effects related to the shape of the potential influence the formation of tidal tails. Both effects are related to the escape velocity of the galaxy potential at the radius near the edge of the disk, where disk stars are stripped off. First, the shape of the potential affects the speed of the galaxies at the time of collision. For zero energy orbits, the relative speed is about . High velocity encounters are expected in models with a larger halo mass and circular velocity, implying a shorter duration encounter and weaker tidal perturbation, resulting in shorter tidal tails. Second, the gradient of the potential at the time of encounter limits the length of tidal tails since steeper potentials are more effective at holding on to their stars. This is a purely energetic effect since disk stars acquiring an energy and in a potential with gradient, will have length, . In practice, the final length and shape of the tails depends on the orbital and disk angular momentum along with the exact shape of the potential since the potential gradient itself is also declining with radius. These are the two main effects governing tail formation but it is difficult to determine which one is the most important by examining the results of self-consistent simulations.
How can we disentangle these two competing effects? One approach is to artificially decouple the orbital dynamics of the interacting galaxies from the internal dynamics of the disk stars. In this method, galaxies are moved on predetermined trajectories which are not necessarily consistent with their mutual interaction potential. The trajectories are calculated first by using self-consistent simulations and saving the positions of the center of mass of the bulge. We then move a rigid potential with its own set of test particles along this trajectory. In this way, we are decoupling the effect of the duration of the tidal impulse from that of the shape of the halo potential.
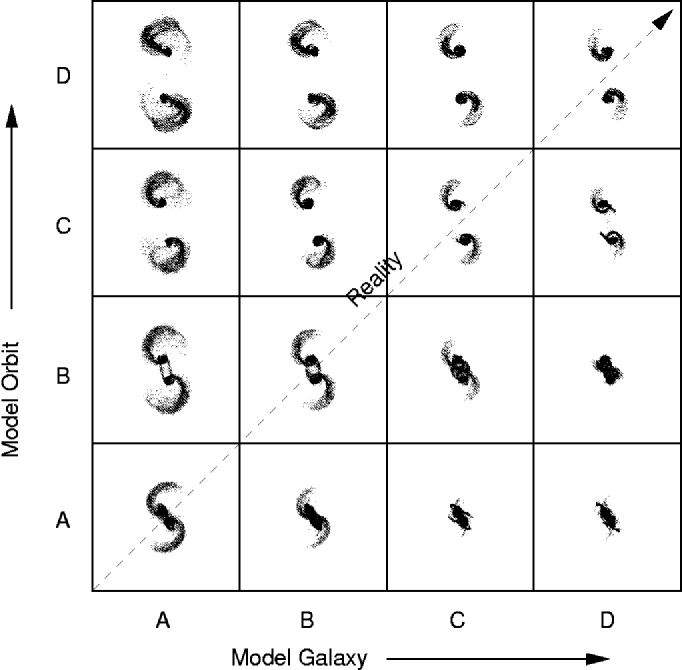
We use the restricted test-particle method described above to simulate the formation of the tails with the following modification. We place galaxies chosen from the four mass models A, B, C, and D along trajectories derived from the self-consistent simulations of these models (the interaction potential gives similar results but we use real trajectories to be more exact). For example, we move model A galaxies along the higher speed trajectories of model B, C, and D galaxies, and do similar experiments for all 16 possible permutations of halo potential and orbit.
Figure 4 shows the result of this exercise. Two equal mass, co-planar galaxies are placed on a direct encounter with a pericentric distance of . In the figure, galaxy models are varied in the horizontal direction, and orbits are varied along the vertical. The diagonal of this diagram corresponds to the real behavior of interacting pairs of galaxies from the 4 models and reveals the original effect of diminishing tail length and mass with halo model as discussed in DMH. The off-diagonal images are artificial but reveal immediately that the dominant effect leading to long tidal tails is the shape of the potential rather than the duration of the tidal perturbation. In the upper left, low mass galaxies move along the fast trajectories of high mass galaxies, but despite the higher speed of the encounter long tails of comparable length are still ejected (although on more curved trajectories). In contrast, the lower right of the diagram shows high mass galaxies moving along the low speed, rapidly merging trajectories of the lower mass galaxies. Despite the stronger tidal perturbation of the slow interaction, the steep potentials of the higher mass models still inhibit the formation of tidal tails.
From this experiment, we conclude that the dominant effect in determining the length and kinematics of tidal tails is simply the shape of the potential. The duration of the encounter does not seem to make much difference, since the strength of the perturbation does not vary significantly with the encounter speed. This simplifies the interpretation of observed interacting galaxies since the length of tidal tails mainly reflects the shape of the potential, assuming that the encounters were originally within a few scale-lengths so that the tidal perturbations were of comparable strength.
3.2 Varying the Halo Potentials
With the realization that the main effect in tail formation is simply the shape of the potential, we carry out an extensive survey of the influence of different halo potentials on tail making using the restricted method described above. We are motivated both by observational constraints on the properties of dark halos derived from HI and optical rotation curves and cosmological predictions of the dark halo mass distribution. For cosmological models, we examine halos with both the Hernquist and NFW forms as discussed in §2.2. We find that both of these models give essentially the same results when scaled so that their velocity maxima coincide. For brevity, we focus our discussion here on the results obtained using the NFW profile.
3.2.1 Direct, Co-planar Encounters
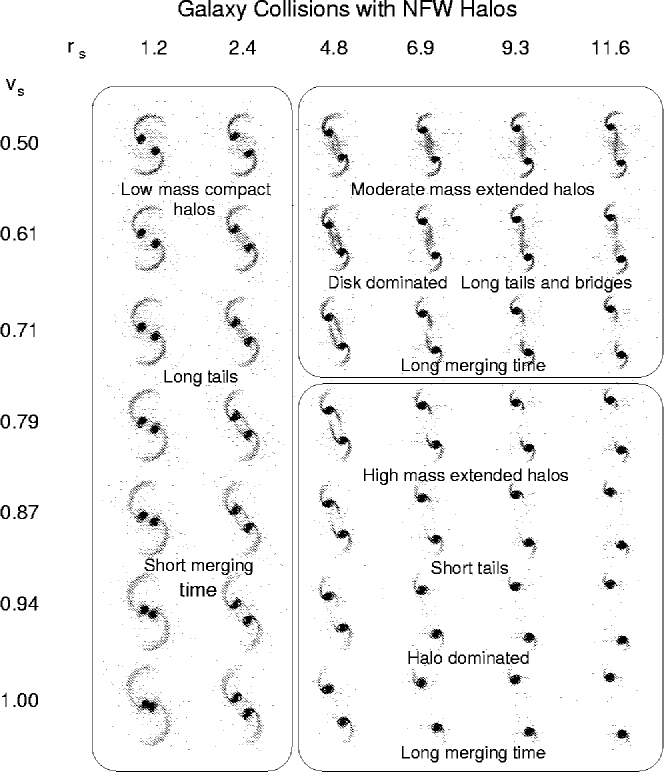
We construct the 42 galaxy models with NFW halos described in §2.2 and simulate direct encounters between coplanar disks on zero energy orbits using the restricted method. The pericentric separation of the galaxies for all trajectories is disk scale lengths (16 kpc). Figure 5 presents the results from the survey grid shown at units (+540 Myr) after pericenter and the width of each frame is 100 units (400 kpc). (Animations of the simulations are available at http://www.cita.utoronto.ca/dubinski/tails3.) The grid can be divided roughly into 3 regions which distinguish the behavior of the kinematic development of the tidal tails and merging times, although there is a continuous transition between the boundaries. We refer to these three regions as I, II and III and discuss their peculiar features.
The first two columns of the simulation grid define Region I. Here, galaxies develop long tidal tails ( kpc in length), in many ways similar to the classic examples of interacting pairs of galaxies discussed in TT, such as NGC 4038/9 (the Antennae) and NGC 4676 (the Mice). A significant amount of mass is also stripped from the galaxies with % of the original disk mass being ejected into tails. These models have no trouble producing long, massive tidal tails because the halos have low mass and are compact, resulting in a shallow potential near the disk edge. The halo mass ranges from only 2 to 13 times the stellar mass and the escape velocity within the disk is only about twice the local circular velocity. The halos at the bottom of this region have a higher central density and so dynamical friction is stronger leading to shorter merging times. The galaxies in the lower left corner are already merging by . The behavior in this region is similar to the Model A and B galaxies of DMH and, in fact, to most previous models of interacting galaxies.
The upper right corner of the simulation grid defines Region II. Here, galaxies also develop long tidal tails with the added bonus of a long connecting bridge. The interacting pair Arp 295 with its two widely separated disks and bridge looks more like these models than those in Region I. As in Region I, the escape velocity is again roughly twice the value of the circular velocity despite the higher halo mass. The circular speed is dropping off more rapidly at the disk edge as well allowing the formation of long tails and bridges. However, the potential is shallower than in Region I and the central halo density is much smaller and so the stopping power of dynamical friction is limited. The two galaxies therefore fly by each other to distances greater than 50 scale lengths (200 kpc) before falling back together, allowing the development of a long connecting bridge. The behavior is similar to the Model E galaxies discussed in MDH. For scale lengths, the galaxies take several hundred time units to merge ( Gyr) because of the smaller amount of dynamical friction during the first encounter, compared with merging times of Gyr for galaxies in Region I.
The lower right corner of the simulation grid defines the final Region III. Here, the formation of tidal tails is strongly suppressed, becoming more so as the halo mass and extent increases towards the lower right corner. The escape velocity is larger here than in Regions I and II with values ranging from 2.5 to 3 times the circular velocity. The potential is therefore steeper and more effective at holding onto ejected material after the strong perturbation felt during the encounter. The relative speed of the two galaxies during their encounter is 1.5 to 2 times larger than in Regions I and II and so the galaxies do not slow down appreciably after their encounter even with the heightened dynamical friction due to the higher halo densities. The behavior seen here is similar to the Model C and D galaxies discussed in DMH and is primarily a result of the steep potential at the disk edge for these high mass halos.
In summary, the galaxies in Regions I and II produce galaxies with long tidal tails during their first encounters with many similarities to observed interacting pairs. The distribution of halo mass is markedly different in these regions. Models in Region I have relatively low mass, compact halos with declining rotation curves. In contrast, models in Region II have higher mass, more extended halos, but their lower halo circular velocities result in declining rotation curves due to the disk-halo transition. Despite these differences, the controlling parameter is the ratio of escape velocity to circular velocity within the disk () rather than the actual halo:disk+bulge mass ratio, as emphasized by Springel & White (1998). The appearance of the models in Region III reflects the larger amount of dark matter in the galaxies’ centers and the steep slope of their halo potential. It appears that when the escape velocity is the circular velocity (measured at ) tidal tails do not form.
4 Discussion
4.1 Consistency with Observed Rotation Curves
In contrast to our earlier studies (DMH, MDH) in which we used only a limited number of galaxy models, the expanded suite of models presented here provides a more complete map of the parameter space of rotation curves, covering the extremes of observational and theoretical interpretations of the dark halo mass distribution. Our models are best viewed as constraints on the depth and gradient of the potential well – in other words, on the shape of the galactic rotation curve. We find that models with rotation curves which are truly flat inhibit the formation of tidal tails. To create long tails, rotation curves must decline, either through a falling halo rotation curve, or a marked disk-halo transition. How then do these constraints compare to other observational constraints on the shape of spiral galaxy rotation curves?
Optical and H I studies, which at first pointed toward universally flat rotation curves to the limit of detectability (e.g., Rubin et al. 1982; Kent 1987), now reveal a variety of rotation curve shapes. Rotation curves which are truly flat and halo-dominated – such as those from isothermal halo models – are extremely difficult to reconcile with observed tidal tails unless they have a small truncation radius (i.e. just outside the edge of the optical/HI disk). Models with flat rotation curves sit in the bottom right of Region III; these models have such steep potential gradients in their outer regions that only very short and low-mass tails form. The classic merging pairs of the Toomre Sequence are inconsistent with the flat rotation curves of Region III models.
As rotation curve “libraries” (e.g., Persic & Salucci 1995; Mathewson & Ford 1996) have expanded, however, the notion of universally flat rotation curves has been superseded. Instead, galaxies appear to possess a variety of rotation curve shapes, and it has been suggested that rotation curve shape is correlated with luminosity and/or Hubble type of the galaxy (e.g., Persic, Salucci, & Stel 1996; McGaugh & de Blok 1998). Persic et al. advocate a “universal rotation curve” in which bright spirals have slightly falling rotation curves, while low luminosity disks possess rotation curves which continue to rise to the last observed data point. This classification based on luminosity runs into difficulties when low surface brightness (LSB) galaxies are considered; even luminous LSBs possess slowly rising rotation curves, suggesting that it is surface density, not luminosity, which determines rotation curve shape (McGaugh & de Blok 1998). The decline observed in some high surface brightness disk galaxies may in fact be associated with the presence of a massive disk, rather than a halo with a mass distribution declining faster than . As yet, no clear cut cases exist for declining halo rotation curves in luminous disk galaxies.
Galaxies with falling rotation curves have no problem making long tails as shown by the examples in Regions I and II of Figure 5. The bottom of Region I represents models with compact halo-dominated rotation curves that cut off at moderate radii (large and small ) while Region II represents models with disk-dominated rotation curves with less massive but more extended (small and large ) dark halos. Both maximal disk models and 60% maximal disk models such as advocated by Bottema (1997) are represented in Region II; LSB galaxies with their extremely flat rotation curves are not. Generally, the appearance of the tails in interacting systems such as the Antennae and the Mice could be attributed to galaxies with either disk-dominated or halo-dominated rotation curves. One possible exception is Arp 295 – a widely separated pair ( kpc) with long tails and a connecting bridge (Hibbard 1995). Only disk-dominated models in Region II exhibit this behavior, suggesting that the galaxies in Arp 295 have disk-dominated rotation curves — the galaxies in Region I simply merge too rapidly to allow a phase with a long connecting bridge. The structure of dark matter halos probably varies from galaxy to galaxy so mergers with long tidal tails may simply be a product of systems with different halo properties but falling rotation curves. Although galaxies with low-mass, compact halos (small and small ) represented in Region I can also make long tails they can be ruled out directly since their rotation curves simply fall too steeply.
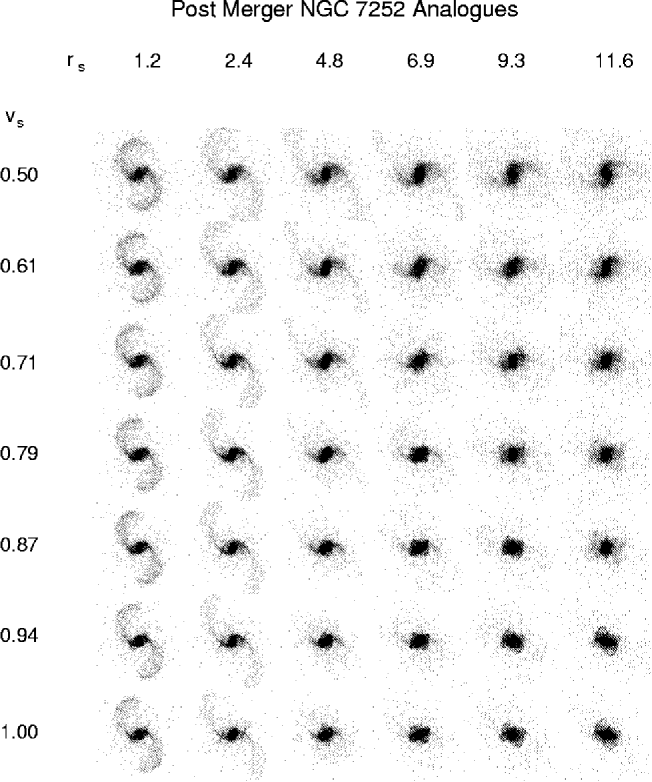
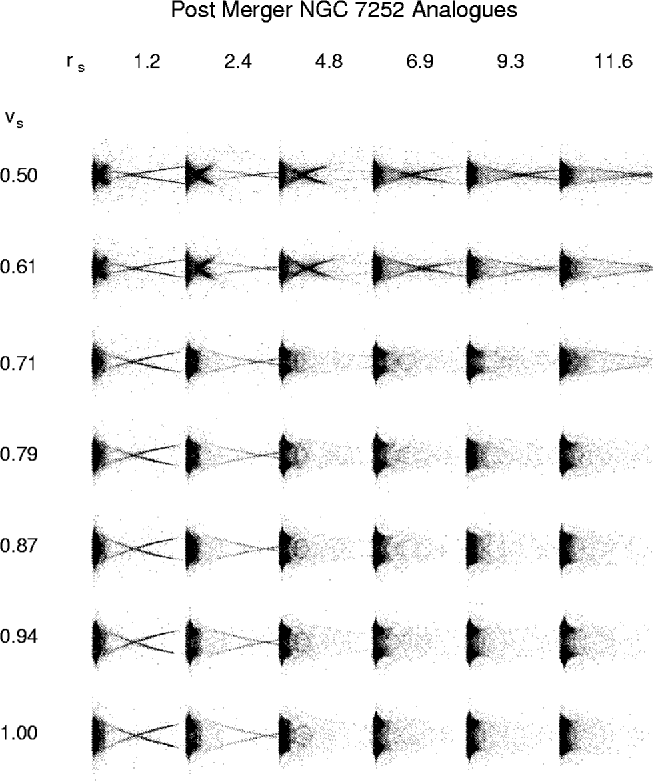
One further check for consistency is provided by examining late stages in the merging process. Figure 5 provides snapshots shortly after an interaction as seen in systems like the Antennae or the Mice. NGC 7252 provides a later view when the two galaxies have coalesced with a single, concentration of light yet memory of their interaction is still visible in protruding tails. We examined a late stage analogous to NGC 7252 by repeating the calculations using a smaller pericentric separation, , to decrease the merging time to less than 5 Gyr for all the models. NGC 7252 has been caught very close to the exact time of coalescence and so we have run all the models to a time when the galaxy centers are separated only by scale length ( kpc). The merging times range from 0.3 to 5.4 Gyr after the time of closest approach (see Table 3) reflecting the large variation in the strength of dynamical friction during the interactions. The morphology and kinematics of the remnants and any protruding tails are shown in Figures 6 and 7. The galaxies in Region I still show the tails from the primary encounter and some forming secondary tails. These tails are very long and expanding outward similar to those in NGC 7252. In Region II, the primary tails have long since escaped and the remnant is surrounded by diffuse debris originating from the tidal bridge formed between the galaxies. There are also diffuse tails formed in the second encounter which could potentially be identified with those of NGC 7252. Finally, in Region III the formation of tails in the second encounter is suppressed as strongly as in the first encounter. The tails which do form are short-lived and completely infalling when they reach their maximum extent of 10 scale-lengths, in contrast to those of NGC 7252 which are expanding outwards (Hibbard et al. 1994). At face value, the galaxies in Regions I and II could plausibly be identified with NGC 7252 at the time of merging while those in Region III are unlikely candidates. However, the merger remnants of disk-dominated models of Region II would be surrounded by an extended cloud of diffuse stellar and gaseous debris. The extended gas in NGC 7252 appears to be largely confined to the tails (Hibbard et al. 1994) so perhaps the preferred mass model is that of the compact halo models.
Other less direct observational methods exist for probing the outer rotation curves of spiral galaxies. Zaritsky et al. (1993, 1997ab) have studied the velocity dispersions of satellite galaxies around luminous spirals, and find no evidence for a drop in the velocity dispersion out to a distance of 400 kpc. If rotation curves are truly flat to such large distances (see also Barcons, Lanzetta, & Webb 1995), it is impossible to reconcile our models with observed merging galaxies. However, the data of Zaritsky et al. do permit modestly falling rotation curves, for which our models do produce passable tidal tails (e.g., the model). “Better” tails (longer, more well defined) need more rapidly declining rotation curves than the Zaritsky et al. data allow.
Leonard & Tremaine’s (1990) analysis of high velocity stars implies an escape velocity at the solar radius of 440-660 km/s or 2 to 3 , straddling the critical value, where tails are difficult to make. The lower bound is about km/s based on the fastest star in their analysis. If indeed, km/s in the solar neighborhood, the model study implies that the Milky Way will not throw off extended tidal tails in any future interaction with M31.
In summary, there are two requirements for galaxies to make realistic tidal tails in interactions. First, the ratio of escape to circular velocity at should be . Secondly, rotation curves should be falling rather than flat or rising at the disk edge. Both of these requirements can be met with disk-dominated models with large and small and a restricted set of halo-dominated models of moderate mass with small and large . Some interacting pairs appear to fit disk-dominated models better (such as Arp 295) while others prefer compact-halo-dominated models (NGC 7252).
4.2 Theoretical Constraints
The properties of dark halos in cosmological models have been studied extensively, enabling in principle a test of consistency with our tidal tail arguments. The main theoretical uncertainty is calculating how disks settle within these halos – hydrodynamic simulations are still plagued with difficulties due to incomplete treatments of star formation and feedback, while semi-analytic methods are not well-tested. The claim from DMH that the dark:luminous mass ratio of galaxies must be less than 10 was based on a restricted set of halo models; it is useful to expand and refine the arguments using the simulation survey done here in order to set better constraints.
Most recently, Navarro, Frenk, & White (1997) have analyzed halo formation in a variety of cosmological models, showing how halo properties depend on the cosmological parameters (e.g., ). Their main result is that the properties of dark halos can be quantified by a single parameter, the halo concentration, , which is the ratio of the “virial radius”, , to the scale-radius of the fitted NFW profiles. In general, the concentration various with mass scale in different cosmological models with the mean value depending on the cosmological parameters and choice of normalization of the power spectrum. In principle, the measurement of the concentration then can constrain a cosmological model as exemplified by Navarro’s (1998) attempts to estimate from rotation curves.
The structure and kinematics of tidal tails are similarly sensitive to halo concentration. We can calculate the formal concentration for our models by finding the effective assuming the galaxies are scaled to galactic dimensions. The concentration parameter is found by solving:
| (8) |
The formal values of based on a galaxy with Milky Way dimensions (length units of 4 kpc, velocity units of 220 km/s) and km/s/Mpc are given in Table 2 for comparison. (When assuming km/s/Mpc all concentrations are systematically lowered).
As a first comparison, we look at halos from standard CDM cosmology, which are predicted to have . Neglecting dissipative effects on the halo, this range of concentrations is represented in Figure 5 by the band of models with and models with and . Our original CDM-like mass models C and D lie near the bottom of the diagram where tails are hard to make, consistent with the original conclusions in DMH. We see, however, that some models with halos having CDM concentrations yet which are disk-dominated in their inner regions (Region II models) are more forgiving. The reason for this is simply that the circular velocities of the disk and halo are mismatched, so that there is a decline in the rotation curve at the disk-halo transition. To manufacture long tidal tails, in essence we must include a massive disk component to create a falling rotation curve within a CDM halo. These disk-dominated models are consistent with “maximum disk” models or even Bottema (1993, 1997) disk models, in which approximately 60% of the total rotation curve velocity is attributed to the disk component. However, such models are marginally inconsistent with the satellite data of Zaritsky et al. (1994) for Milky Way-type spirals and completely incompatible with recent rotation curve decompositions of LSB disk galaxies (e.g., de Blok & McGaugh 1996; McGaugh & de Blok 1998), which show flat rotation curves with little disk contribution.
In contrast to the predictions for standard CDM halos, the dark halos in low-density CDM models as well as flat CDM+ models are predicted to have somewhat smaller concentrations, , when normalized to COBE (Navarro 1998). Models with low concentration halos are found at the right edge of Figure 5. The only way such galaxies can produce long tidal tails is if the rotation curve falls at the disk-halo transition, such as the models in the upper right of Figure 5. Rotation curves which are solely supported by low concentration halos have potential wells too steep to eject long tidal tails. Following the trends, we expect only disk-dominated models with smaller concentrations to make good tails and perhaps this kind of model is the most consistent theoretical choice. These arguments suggest that the galaxies which gave rise to the Toomre Sequence were predominantly luminous HSB galaxies with modestly declining rotation curves due to the disk-halo transition.
We note also that when the power spectrum is normalized instead to the number density of rich clusters in the local universe the concentration has virtually no dependence on with a constant value of in all cosmological models (Navarro 1998). If this is the correct way to normalize, then tidal tails (as well as rotation curve shapes) cannot be used to constrain . However, the constant value of is at least marginally consistent with tidal tails with this normalization. Stronger constraints on cosmological models must await a more thorough understanding of the normalization of the cosmological power spectrum and how the formation of disk galaxies inside dark halos proceeds in different cosmological models.
While there is some room for consistency between our tidal tail models and the cosmological halo formation models of NFW, the problem of LSB galaxies still remains. Attempts to fit NFW models to LSB rotation curves have been made by McGaugh & de Blok (1998) and Navarro (1998); while these attempts largely failed, the “best” matches yielded concentration indices , where our models show that tidal tail formation is completely inhibited in halo-dominated models. Because LSBs probably trace the dark matter component most faithfully, these results suggest that “bare” dark matter halos with low mass disks prohibit the formation of tidal tails; it is only the inclusion of a (relatively dense) baryonic component at the center to make a falling rotation curve necessary to produce observed tidal tails. Yet it is a very fine line we walk with these arguments; any significant gradient is inconsistent with many observed rotation curves and the satellite galaxy velocity dispersion measurements of Zaritsky et al. (1994).
Recently, Springel & White (1998; hereafter SW) have also examined the consistency of long tidal tails within standard CDM halos against observations, and it is useful to compare their results and interpretations to our study. SW examined disk+CDM halo models constructed using the prescription of Mo et al. (1998). According to this approach, halos are adjusted adiabatically in a self-consistent manner to the presence of an exponential disk whose length scale is determined by the initial angular momentum. SW examined a sequence of models with the same initial halo model ( km/s) but different baryon fractions and dimensionless spin parameter, . Their survey differs from ours in that SW fixed the halo mass profile and varied the disk properties, while we have fixed the disk+bulge mass profile and varied the halo properties. It is encouraging that SW find the same range of behavior in tail making that we see in our parameter survey for models with similar mass profiles. Their models cover mass profiles in the bottom of our Region I and left-hand area of Region II. All of their models are halo-dominated with falling rotation curves beyond 5 scale lengths. Their results emphasize that there is not necessarily a one-to-one correspondence between the disk scale and the halo properties, making a range of behaviors during galaxy interaction possible (since varying results in a range of ).
The models of Springel & White span a range in disk scale-lengths between 1.5-6.9 . Those models with the smallest scale lengths of 1.5-3.3 kpc (their models A,B,D) have difficulty in making long tails because disk material is tightly bound in the inner portions of the galaxies where the model rotation curve is not yet falling. Conversely, their models with large disk scale-lengths (their models C,E,F) kpc have no difficulty making tails – these galaxies are endowed with a significant fraction of their disk material at large radii, where the rotation curve is dropping and the potential well is shallow. Based on the success of the large scale-length models, Springel & White claim that there is no inconsistency between observed galaxies and those produced in the CDM model. While this is true in principle, it is important to note that their successful models are large scale-length, high angular momentum, halo-dominated systems – the perfect description of a low surface brightness disk galaxy. However, the rotation curves of these models are declining, whereas LSB rotation curves remain flat out to very large distances ( kpc; McGaugh & de Blok 1998). While these models do produce long tidal tails, it is unclear whether or not they have any real analogues in the observed galaxy population. In addition, if only large-scale length high angular momentum systems give rise to long tidal tails, this model would predict that the Toomre Sequence arose predominantly from LSB progenitors. Whether or not this is compatible with observations of the Toomre Sequence is questionable.
5 Conclusions
We have completed a broad survey of galaxy collisions with different mass models to infer the processes that control the development of the structure and kinematics of tidal tails. The main effect that governs the lengths and kinematics of tidal tails is simply the shape of the potential well rather than strength of the perturbation during a close resonant encounter. Tidal tails therefore can trace the potential in a direct way, relatively insensitively to the details of the encounter. In agreement with Springel & White (1998), a good criterion for making tails appears to be that at for a wide range of models including those with disk-dominated and halo-dominated rotation curves.
The survey of collisions show that galaxies with rising or flat rotation curves effectively inhibit the formation of tidal tails. To produce tidal tails, galaxies must possess rotation curves which fall near the disk edge. Two types of models meet this criteria – galaxies with disk-dominated rotation curves and low concentration halos (extended, moderate-mass halos) or conversely halo-dominated rotation curves with high concentration halos (compact, low-mass halos) both create tidal tails consistent with observed interacting galaxies. The need for a declining rotation curve is marginally inconsistent with halo properties inferred from the analysis of the kinematics of satellite galaxies (Zaritsky et al. 1994) and LSB rotation curves (McGaugh & de Blok 1998). Observational consistency with rotation curve analyses and this galaxy collision study can be made if the classic tidal tail systems (e.g., NGC 4038/39, NGC 7252, the Superantennae) arise predominantly from luminous HSBs which are disk dominated in their inner regions and surrounded by low-concentration dark halos.
Galaxies embedded within standard CDM halos have high concentrations and although these can be made to make tails if the halos are low mass, such halos seem to be unlikely based on rotation curve analyses. Galaxies with massive disks embedded in low concentration halos also produce the declining rotation curves necessary to create long tidal tails. The fact that low concentration halos are predicted in cosmologies with non-zero , coupled with recent observational developments suggesting the presence of a cosmological constant, may argue that such disk-dominated, low concentration halos are the most consistent model for the progenitors of the Toomre sequence in our universe. Low surface brightness galaxies, with their extended, flat, and halo-dominated rotation curves cannot make long tidal tails due to the shapes of their potential wells. A strong caveat is that galaxy halo concentration is only weakly dependent on and when the power spectrum is normalized to the local abundance of rich clusters and so tidal tails (and galaxy rotation curves) do not necessarily provide strong cosmological constraints.
Even with this expanded set of models, unexplored effects remain. The models remain parameterized by only a few density profiles (e.g., the NFW and Hernquist profiles); whether or not either of these parameterizations is correct remains unclear. Further advances in these comparisons will require a better understanding of disk galaxy formation, as well as stronger observational constraints on the shapes of rotation curves at large radius. In addition, our models remain focused on parabolic encounters of two distinct disk galaxies. How mergers evolve in a cosmological setting, where the presence of a background potential (i.e. a cluster or common halo) may affect the dynamical evolution of the pair, is still largely undetermined. Such additional modeling would provide a useful consistency check on our results. Once these effects are sorted out, tidal tails may yet provide even stronger constraints on the shapes of the potential wells of disk galaxies.
References
- (1) Arp, H. 1966, ApJS, 14, 1 Arp, H. & Madore, B.F. 1987, A Catalogue of Southern Peculiar Galaxies and Associations (Cambridge University Press, Cambridge) Barcons, X., Lanzetta, K.M., & Webb, J.K. 1995, Nature, 376, 321 Barnes, J.E. 1988, ApJ, 331, 699 Barnes, J.E. 1992, ApJ, 393, 484 Barnes, J.E. & Hernquist, L. 1992, ARA&A, 30, 705 Binney, J. & Tremaine, S. 1987, Galactic Dynamics (Princeton University Press: Princeton) Bottema, R. 1993, A&A, 275, 16 Bottema, R. 1997, A&A, 328, 517 Brainerd, T.G., Blandford, R.D. & Smail, I. 1996, ApJ, 466, 623 Casertano, S., & van Gorkom, J.H. 1991, AJ, 101, 1231 Clutton-Brock, M. 1972a, Astrophys. Sp. Sci., 16, 101 Clutton-Brock, M. 1972b, Astrophys. Sp. Sci., 17, 292 Colina, L., Lipari S. & Maccheto, F. 1991, ApJ, 382, 63 de Blok, W.J.G., & McGaugh, S.S. 1996, ApJ, 469, L89 Dubinski, J. & Carlberg, R.G. 1991, ApJ, 378, 496 Dubinski, J., Mihos, J.C., & Hernquist, L. 1996, ApJ, 462, 576 (DMH) Eneev, T.M., Kozlov, N.N. & Sunyaev, R.A. 1973, A&A, 28, 41 Faber, S.M., & Gallagher, J.S. 1979, ARA&A, 29, 409 Fich, M. & Tremaine, S. 1991, ARA&A, 29, 409 Forman, W., Jones, C., & Tucker, W. 1985, ApJ, 293, 535 Freeman, K.C. 1970, ApJ, 160, 811 Hernquist, L. 1990, ApJ, 356, 359 Hernquist, L. 1992, ApJ, 400, 460 Hernquist, L. 1993, ApJ, 409, 548 Hibbard, J.E. 1995, Ph.D. thesis, Columbia University Hibbard, J.E., Guhathakurta, P., van Gorkom, J.H., & Schweizer, F. 1994, AJ, 107, 67 Johnston, K.V., Zhao, H.-S., Spergel, D.N. & Hernquist, L. 1998, ApJ, submitted Kahn, F.D. & Woltjer, L. 1959, ApJ, 130, 705 Kent, S.M. 1987, AJ, 83, 816 Kochanek, C. 1996, ApJ, 457, 228 Kuijken, K., & Dubinski, J. 1995, MNRAS, 277, 1341 Kuijken, K. & Gilmore, G. 1989, MNRAS, 239, 605 Leonard, P. & Tremaine, S. 1990, ApJ, 353, 486 Lin, D.N.C., Jones, B.F. & Klemola, A.R. 1995, ApJ, 439, 652 Mathewson, D.S., & Ford, V.L. 1996, ApJS, 107, 97 McGaugh, S.S., & de Blok 1998, ApJ, 499, 41 Mirabel, I.F., Lutz, D. & Maza, J. 1991, A&A, 243, 367 Mihos, J.C., Dubinski, J. & Hernquist, L. 1998, ApJ, 494, 183 (MDH) Mo, H.J., Mao, S. & White, S.D.M. 1998, MNRAS, 295, 319 Navarro, J.F., Frenk, C.S. & White, S.D.M. 1996, ApJ, 462, 563 Navarro, J.F., Frenk, C.S., & White, S.D.M. 1997, ApJ, 490, 493 Navarro, J.F. 1998, astro-ph/9807084 Padmanabhan, T. 1993, Structure Formation in the Universe (Cambridge University Press: Cambridge) Peebles, P.J.E. 1993, Principles of Physical Cosmology (Princeton University Press: Princeton) Peebles, P.J.E., Melott, A.L., Holmes, M.R. & Jiang, L.R. 1989, ApJ, 345, 108 Persic, M., & Salucci, P. 1995, ApJS, 99, 501 Persic, M., Salucci, P. & Stel, F. 1996, MNRAS, 281, 27 Pfleiderer, J. & Seidentopf, H. 1961, Z. Astrophys., 51, 201 Pfleiderer, J. 1963, Z. Astrophys., 58, 12 Raychaudury, S. & Lynden-Bell, D. 1989, MNRAS, 240, 195 Rogstad, D.H. & Shostak, G.S. 1972, ApJ, 176, 315 Rubin, V.C. & Ford, W.K. 1970, ApJ, 159, 379 Rubin, V.C., Burstein, D., Ford, W.K., & Thonnard, N. 1985, ApJ, 289, 81 Rubin, V.C., Ford, W.K., & Thonnard, N. 1980, ApJ, 238, 471 Rubin, V.C., Ford, W.K., Thonnard, N., & Burstein, D. 1982, ApJ, 261, 439 Schombert, J.M., Wallin, J.F., & Struck-Marcell, C. 1990, AJ, 99, 497 Schweizer, F. 1982, ApJ, 252, 455 Springel, V. & White, S.D.M. 1998, astro-ph/9807320 (SW) Toomre, A., & Toomre, J. 1972, ApJ, 178, 623 White, S. 1982, in The Morphology and Dynamics of Galaxies, ed. L. Martinet & M. Mayor (Sauverny: Geneva Obs.), 289 Wright, A.E. 1972, MNRAS, 157, 309 Yabushita, S. 1971, MNRAS, 153, 97 Zaritsky, D., & White, S.D.M. 1994, ApJ, 435, 599 Zaritsky, D., Olszewski, E.W., Schommer, R.A., Peterson, R.C., & Aaronson, M. 1989, ApJ, 345, 759 Zaritsky, D., Smith, R., Frenk, C. & White, S.D.M. 1993, ApJ, 405, 464 Zaritsky, D., Smith, R., Frenk, C. & White, S.D.M. 1997a, ApJ, 478, 39 Zaritsky, D., Smith, R., Frenk, C. & White, S.D.M. 1997b, ApJ, 478, L53 Zurek, W.H., Quinn, P.J. & Salmon, J.K. 1988, ApJ, 330, 519
- (2)

| Table 1 | |||||
| Original Model H:D+B Mass Ratios | |||||
| and Escape Velocities at | |||||
| A | B | C | D | E | |
| H:D+B | 4.1 2.02 | 8.2 2.35 | 15.8 2.69 | 29.6 3.06 | 18.1 2.49 |
| Table 2 | |||||||
| NFW Galaxy Model Concentrations | |||||||
| and Escape Velocities at | |||||||
| 1.2 | 2.4 | 4.8 | 6.9 | 9.3 | 11.6 | ||
| 0.50 | 29 1.80 | 17 1.93 | 10 2.10 | 7.1 2.19 | 5.5 2.24 | 4.6 2.28 | |
| 0.61 | 34 1.85 | 20 2.05 | 11 2.24 | 8.4 2.38 | 6.6 2.45 | 5.4 2.52 | |
| 0.71 | 38 1.89 | 22 2.10 | 13 2.37 | 10 2.53 | 7.5 2.65 | 6.2 2.70 | |
| 0.79 | 41 1.93 | 24 2.18 | 14 2.46 | 10 2.66 | 8.2 2.78 | 6.8 2.87 | |
| 0.87 | 44 1.95 | 26 2.23 | 15 2.54 | 11 2.77 | 8.8 2.89 | 7.4 3.01 | |
| 0.94 | 47 1.98 | 28 2.26 | 16 2.63 | 12 2.86 | 9.4 3.02 | 7.9 3.14 | |
| 1.00 | 49 1.99 | 29 2.30 | 17 2.68 | 13 2.93 | 10 3.09 | 8.3 3.22 | |
| Table 3 | |||||||
| Merging Times in Gyr for | |||||||
| 1.2 | 2.4 | 4.8 | 6.9 | 9.3 | 11.6 | ||
| 0.50 | 0.52 | 0.86 | 1.73 | 2.84 | 4.13 | 5.57 | |
| 0.61 | 0.49 | 0.85 | 1.78 | 2.91 | 4.24 | 5.71 | |
| 0.71 | 0.47 | 0.81 | 1.71 | 2.78 | 4.03 | 5.47 | |
| 0.79 | 0.44 | 0.75 | 1.63 | 2.65 | 3.83 | 5.14 | |
| 0.87 | 0.41 | 0.74 | 1.55 | 2.50 | 3.59 | 4.81 | |
| 0.94 | 0.39 | 0.69 | 1.49 | 2.37 | 3.42 | 4.39 | |
| 1.00 | 0.39 | 0.68 | 1.42 | 2.26 | 3.13 | 4.33 | |