No Increase of the Red-Giant-Branch Tip
Luminosity Toward the
Center of M31
Abstract
We present observations with the Hubble Space Telescope Wide Field Planetary Camera 2 of three fields centered on super-metal-rich globular clusters in the bulge of M31. Our color-magnitude diagrams reach as faint as 26.5 mag and clearly reveal the magnitude of the first ascent red giant branch (RGB) tip. We find that the apparent magnitude of the RGB tip does not become brighter near the center of M31 as concluded by previous investigators. Our observations and artificial star experiments presented in this study strongly support the idea that previous very bright stars were likely the result of spurious detections of blended stars due to crowding in lower resolution images. On the contrary, our observations indicate that, at a mean projected galactocentric distance of 1.1 kpc, the RGB tip is some 1.3 magnitudes fainter than it is at 7 kpc. An analysis of this difference in RGB tip magnitude suggests that the M31 bulge stellar population has a mean metallicity close to that of the Sun.
1 Introduction
For more than a decade, the nature of the stellar population towards the center of M31 has been the subject of considerable debate. In the first such studies using modern CCD detectors, Mould (1986) and Mould & Kristian (1986) observed four fields located on the South-East minor axis of M31, at 20 kpc, 12 kpc, 7 kpc, and 5 kpc from the center, respectively. Rich & Mighell (1995) subsequently reached more central regions, into the inner 500 pc of the galaxy. Summarizing their own work based on WFPC1 data along with some previous work based on ground-based data, they confirmed that the first-ascent red giant branch (hereafter referred to as RGB) tip seemed to brighten towards the center of M31. At 7 kpc, the RGB tip appears to have the same luminosity as that observed for typical Galactic globular clusters ( 20.5 mag at the distance of M31) while it becomes significantly brighter near the center of M31. Rich & Mighell (1995) mentioned the apparent contradiction between such a RGB tip luminosity brightening and its predicted theoretical dimming, due to a decrease in luminosity with increasing metallicity, as expected when going from the halo to the more metal-rich bulge stellar population. See, e.g., Bica et al. (1990) for the metal-rich nature of the M31 bulge. As also illustrated by Bica et al. (1991), higher metallicity populations normally have fainter RGBs, due to TiO blanketing in the -band. In order to account for their observations, Rich & Mighell (1995) proposed that the M31 bulge is younger than the Galactic halo by 5 to 7 Gyr and/or the presence of a rare stellar evolutionary phase.
Renzini (1993, 1998) discussed in detail the simpler possibility that the apparent brightest RGB stars in the bulge of M31 were merely the result of image crowding, and concluded that this was indeed likely. Further support for this conclusion came from the work of Depoy et al. (1993) who obtained ground-based -band, m photometry of a 604 arcmin2 field in Baade’s Window and carried out careful artificial star experiments. They simulated the appearance of Baade’s Window at the distance of M31 and obtained an artificial brightening, due to crowding, of more than 1 mag, reproducing the most luminous stars found by Rich & Mould (1991) and Davies et al. (1991).
This letter presents the analysis of our HST WFPC2 observations. These high-resolution images in the central part of the bulge of M31 provide us with an ideal means by which to construct deep color-magnitude diagrams (CMDs) of the stellar populations near the center of this galaxy. In addition, they allow us to quantitatively assess and take into account the degree of crowding.
2 Observations and Data Reduction
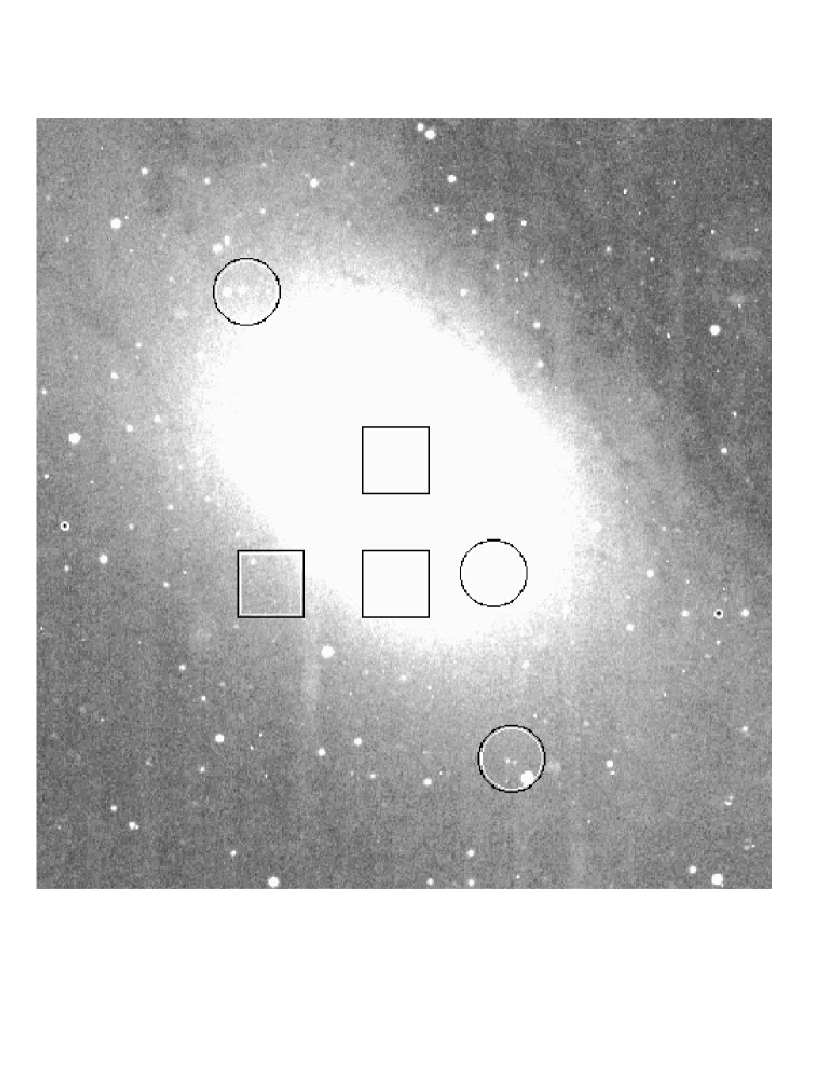
We obtained Hubble Space Telescope WFPC2 images during Cycles 5 and 6 with the F555W () and F814W () filters; our targets were three fields centered on super-metal-rich star clusters in the bulge of M31 (Jablonka et al. 1992). Two fields, around the star clusters G170 and G177, are located SW along the major axis of M31, respectively at 6.1 and 3.2 arcmin from the galaxy nucleus; the third field, around the cluster G198, is located NE along the major axis at 3.7 arcmin (Huchra et al. 1991). Adopting 1 arcmin = 250 pc, as Rich & Mighell (1995), these angular separations correspond to projected distances of about 1.55, 0.80, and 0.92 kpc, respectively. In Figure 1, we show the location of the Rich & Mighell (1995) fields (squares) and our fields (circles). The region shown is a 13.5 13.5 arcmin box centered on the M31 nucleus, and the squares/circles are 80 arcsec in size/diameter.
Each cluster was centered on the PC chip and exposed for 4800 seconds in and 5200 seconds in , in a series of 1100- and 1300-second subexposures.
After standard recalibration of our data, we used the DAOPHOT/ALLSTAR/ALLFRAME software package for crowded-field photometry (Stetson 1994), along with the PSFs kindly provided to us by the Cepheid-Distance-Scale HST key project. The F555W and F814W instrumental magnitudes were in fine converted to Johnson and Cousins magnitudes, using the zero points and color terms given by Hughes et al. (1998). See Jablonka et al. (1999) for further details of our observations and data reduction.
We have not applied any aperture corrections to our photometry. There are simply no sufficiently bright, isolated stars in our very crowded frames to allow us to obtain our own aperture corrections. It is not possible to use aperture corrections from other WFPC2 data, because there are variations of the aperture corrections with time (HST breathing, etc; see Suchkov & Casertano 1997). However, previously published studies based on the same PSFs as those used herein (e.g. Holland et al. 1996; Holland et al. 1997; Hill et al. 1998; Hughes et al. 1998) find that the aperture corrections are rarely larger than 0.05 mag. In addition, our own photometric study of the M31 globular cluster G1 (Jablonka et al. 1999; Meylan et al. 1999) confirms this fact. As a result, we estimate that our assumption of zero aperture correction introduces an uncertainty of 0.05 mag into our photometry.
3 Results and Discussion
We constructed a (,) CMD for each of our three fields. Between 35,000 and 55,000 stars were detected in the Planetary Camera, depending on the field. The high density of stars superposed upon the bright, unresolved bulge background in these fields prevents the detection of faint stars. This induces incompleteness due to a rather bright detection limit.
Figure 2 shows the CMD of the field around the cluster G170 in the PC chip. The mean photometric errors, representing the frame-to-frame dispersion in the measured magnitudes, are indicated; these correspond to 0.3 mag at mag, 0.08 mag at mag and 0.05 mag at mag. A total of 53,036 stars are detected in this field. A red clump at = 24.5–25.0 mag can be seen in Figure 2, although rather hidden by the high density of points; it is more clearly visible in the luminosity function. Similar red clumps, at the same mag, are observed in the M31 globular cluster G1 (Rich et al. 1996; Jablonka et al. 1999). The CMDs of our other two fields are similar to the one presented in Figure 2: all have well defined red giant branches.
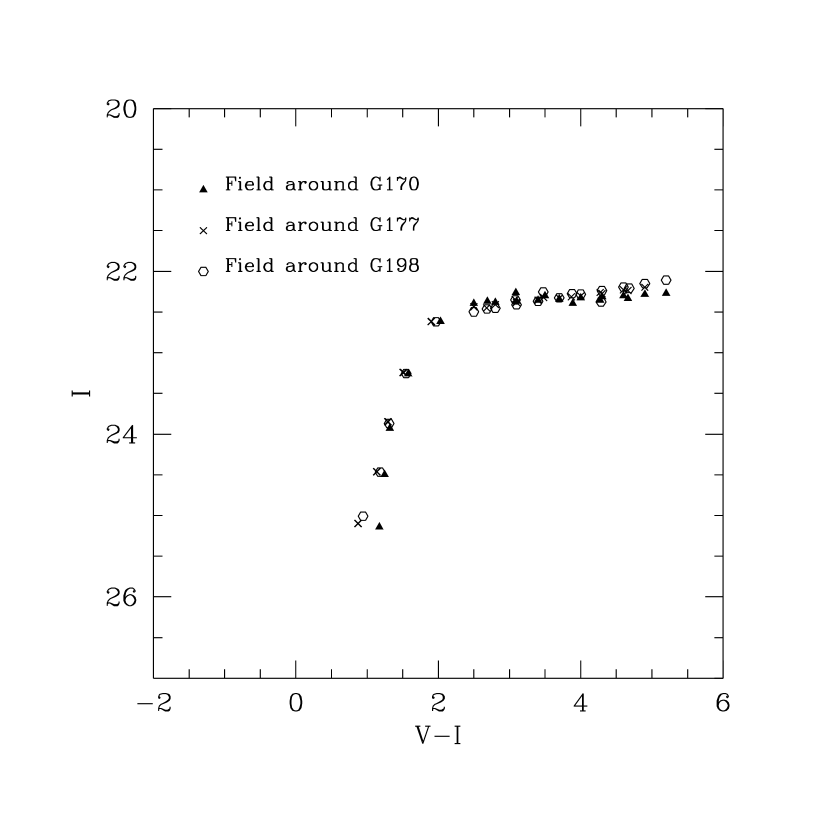
Figure 3 displays the mean locii of the CMDs for our three bulge fields (PC frames). The points were obtained by splitting the data in intervals of 0.65 mag in and 0.4 mag in . In each interval, the mean value was calculated using the Numerical Recipes function moment which gives a proper measure of the absolute deviation of a distribution. The resulting mean locii are clearly the signature of very metal-rich stellar populations (cf. Fig. 1 of Bica et al. 1991), as is the red clump seen in Figure 2. Within the errors, the three fields exhibit the same mean stellar population. No gradient of the stellar population is expected, given our photometric precision.
We estimate, from Figure 3, the apparent band magnitude of the RGB tip of the mean stellar population. This yields mag for the G170 field, mag for the G177 field, and mag for the G198 field. The uncertainties in these quantities are the results of combining, in quadrature, the error in the measurement of this quantity along with an estimated error of mag in the aperture corrections and mag in the Holtzman et al. (1995) photometric transformations. Schlegel et al. (1998) find an average reddening of E() = 0.062 towards M31. Applying E() = 1.3 E() and AI = 1.46 E(), and adopting the Cepheid distance modulus of 24.43 mag (Freedman & Madore 1990), we obtain a mean location for the RGB tips in our three fields of MI mag; this places the mean metallicity of these fields between those of the Galactic bulge globular clusters NGC 6553/NGC 6528 and Terzan 1, if we follow the ranking of Bica et al. (1991). Interpreted within the context of the abundances published by Barbuy et al. (1998), this suggests that the mean M31 bulge metal abundance in these fields is approximately solar.
In order to allow for the comparison of our results with the previous work summarized by Rich & Mighell (1995), we have determined the magnitude of the upper envelopes of the RGBs in our color-magnitude diagrams.*** According to an anonymous referee, the quantity measured by Rich & Mighell is more closely akin to the upper envelope of the RGB rather than the RGB tip. We find mag for the G170 field, mag for the G177 field, and mag for the G198 field. Although these values seem to indicate a slight brightening towards the galaxy center, we do not consider this significant, as (i) the values are the same within the error bars, and (ii) crowding becomes severe with decreasing radius and induces an artificial brightening as will be described below.
In Figure 4, the crosses indicate the previous determinations of the apparent RGB upper envelope as a function of the projected distance (in kpc) from the nucleus of M31. All of these values come from ground-based and pre-refurbishment HST WFPC1 data. Note that the point at 7 kpc is taken from the work of Mould & Kristian (1986). The three filled hexagons, presented with their error bars, are our new results. We see that our PC values are 1.5 mag fainter than WFPC1 and ground-based measurements at similar radii. We interpret this difference as due to severe crowding problems in all previous data at these radii. A similar conclusion was reached by Grillmair et al. (1996) in their WFPC2 study of the M32 bulge population. They did not find the very luminous AGB stars present in previous ground-based studies, and experiments with their WFPC2 frames degraded to ground-based spatial resolution showed that many of these ‘stars’ are in fact the result of image blends due to crowding. We are confident that the point at 7 kpc has not been significantly affected by crowding as we note that Mould & Kristian (1986) performed their stellar photometry using two techniques - aperture photometry and PSF fitting. They point out that their results were not significantly affected by the choice of reduction method. We take this as suggestive evidence indicating that crowding was not a problem.
We ran numerous artificial star experiments in order to check the validity of our photometry in all of our fields. We limit this description to the tests performed on the PC and the WF2 frames of the globular cluster G170. The WF2 frame is selected among the three WF frames, since, because of its orientation, the mean surface brightness in this frame is closest to that observed in the PC frame; WF2 thus provides a good location to isolate and analyse the effect of a change in spatial resolution (pixel size). We added 210 stars to the PC and 419 stars to the WF2 frames, all of them distributed along the fiducial RGB as shown in Panel (a) of Figure 5. From those stars, 193 (91%) are recovered in the PC frame and 310 (73%) in the WF2 frame. Panels (c) and (d) of Figure 5 display the resulting photometry. In the PC frame, the input sequence is very well recovered, even though a small (constant) error shallows it a bit. However, this is not the case for the WF2 frame, where a clear spurious increase in luminosity is detected, an effect which is larger for fainter magnitudes as can be seen in panel (b) of Figure 5. This induces, along the y-axis, a shrinking of the color-magnitude diagram with a general shift towards brighter magnitudes. In a forthcoming paper, we will discuss at length the fact that this crowding effect in the WF2 frame, due to a degraded spatial resolution when going from the PC frame to the WF2 frame, is similar to keeping the PC resolution but observing increased stellar density. In their artificial star experiments, Rich & Mighell (1995) take as input a narrow stellar luminosity distribution, centered on an already rather bright magnitude. Thus, as the genuine bright stars are hardly affected by the crowding, they indeed recover their stars. However, their experiments do not test the hypothesis that fainter stars (not existing in their sample) would create some bright agglomerates in their frames. From our own experiments, it becomes clear that only the PC frames can be reliably used for the study of stellar populations in the M31 bulge.
As described above, the RGB tip becomes fainter as one approaches the nucleus of M31, from a value of I20.5–21 mag at a radius of 7 kpc to I22.3 mag inside of 2 kpc. The work of Da Costa & Armandroff (1990) showed that the first ascent RGB tip of a typical Galactic globular with has mag. For an age larger than about 8 Gyr and abundances in the range , the isochrones of Bertelli et al. (1994) corroborate the assertion of Da Costa & Armandroff (1990) regarding the constancy of the -band RGB tip luminosity at mag. Adopting the M31 distance modulus and reddening given above, this translates to I20.5 mag, which is similar to the RGB tip of M31 at 7 kpc. The simplest conclusion we can make based on this apparent consistency is that the M31 stellar population at 7 kpc from the center is similar in metallicity and age to the Galactic globulars.
Earlier, we showed that the M31 bulge at a mean distance of 1.1 kpc from that galaxy’s center has an RGB tip magnitude that is consistent with an old, approximately solar metal abundance stellar population. Thus, our results confirm the steep metallicity increase from halo to bulge stars in M31 and, given the probable uncertainty in our metallicity estimate, are in-line with the analysis of the spectral features of the M31 nucleus by Bica et al. (1990).
4 Conclusions
Since none of our observations probe the nucleus of M31, there remains the possibility that a rare stellar population could be present in the nucleus as claimed by Rich & Mighell (1995; see also Davidge et al. 1997); however, in our view, the results of our observations and analysis make this possibility unlikely.
The observations presented in this study strongly support the idea that very bright stars were likely the result of spurious detections of blended stars due to crowding in WFPC1 and ground-based images, as also suggested by Renzini (1993, 1998), Depoy et al. (1993), and Grillmair et al. (1996). Only the refurbished HST with the WFPC2 Camera can cope with projected stellar densities as high as 55,000 stars within a 36′′ 36′′ area.
In addition, based upon the absolute magnitude of the first ascent RGB tip, we conclude that the M31 bulge at 7 kpc from the center is consistent with an old intermediate-to-metal-poor (i.e. –0.7) population. This is in stark contrast with the bulge stars inside 2 kpc from the center, which are also old but have a mean metal abundance that is approximately solar.
References
- (1) Barbuy B., Bica E., Ortolani S., 1998, A&A, 333, 117
- (2) Bertelli G., Bressan A., Chiosi C., Fagotto F., Nasi, E., 1994, A&ApS, 106, 275
- (3) Bica E., Alloin D., Schmidt A., 1990, A&A, 228, 23
- (4) Bica E., Barbuy B., Ortolani S., 1991, ApJ, 382, L15
- (5) Da Costa G. S., Armandroff T. E., 1990, AJ, 100, 162
- (6) Davidge T.J., Rigaut F., Doyon R., Crampton D., 1997, AJ, 113, 2049
- (7) Davies R.L., Frogel J.A., Terndrup D.M., 1991, AJ, 102, 1729
- (8) DePoy D.L., Terndrup D.M., Frogel J.A., Atwod B., Blum R., 1993, AJ, 105, 2121
- (9) Freedman W.L., Madore B. F., 1990, ApJ, 365, 186
- (10) Grillmair C.J., et al. 1996, AJ, 112, 1975
- (11) Hill R. J. et al. 1998, ApJ, 496, 648
- (12) Holland S., Fahlman G. G., Richer H. B., 1996, AJ, 112, 1035
- (13) Holland S., Fahlman G. G., Richer H. B., 1997, AJ, 114, 1488
- (14) Huchra J., Brodie J., Kent S., 1991, 370, 495
- (15) Hughes S.M.G. et al. 1998, ApJ, 501, 32 (astro-ph/9802184)
- (16) Jablonka P., Alloin D., Bica E., 1992, A&A, 260, 97
- (17) Jablonka P. et al. 1999, in preparation
- (18) Meylan G. et al. 1999, in preparation
- (19) Mould J., 1986, in Stellar Populations, Eds. C.A. Norman, A. Renzini, M. Tosi, (CUP, Cambridge), p. 9
- (20) Mould J., Kristian J., 1986, ApJ, 305, 591
- (21) Renzini A., 1993, IAU Symp. 153, Galactic Bulges, p. 151
- (22) Renzini A., 1998, ApJ, 115, 2459
- (23) Rich R.M., Mould J., 1991, AJ, 101, 1286
- (24) Rich R.M. Mighell K.J., 1995, ApJ, 439, 145
- (25) Rich R. M., Mighell K. J., Freedman W. L., Neill J. D., 1996, AJ, 111, 768
- (26) Schlegel D.J., Finkbeiner D.P., Davis M., 1998, ApJ, 500, 525 (astro-ph/9710327)
- (27) Stetson P., 1994, PASP, 106, 250
- (28) Suchkov A., Casertano S., 1997, The 1997 HST Calibration Workshop, Eds. S. Casertano et al., (STScI, Baltimore), p. 378 (Instrument Science Report WFPC2 97-01)