Mass distribution and kinematics of the barred galaxy NGC 2336
Abstract
For the intermediate-type barred galaxy NGC 2336 stationary models are constructed which reproduce in a consistent manner the observed distribution of the luminous matter and the observed gas kinematics in those regions affected by the bar. We present 2D fits to the observed -band luminosity distribution that consist of three components: a bulge, a bar, and a disk. The brightness distribution of each component is converted into an underlying mass distribution by means of a suitable -conversion. The resulting coadded potential of NGC 2336 is implemented into a numerical code for the computation of closed orbits for gas clouds (HII-gas). Using the resulting tracks, the phase space accessible to the models is examined with regard to the main orbit families. For different orbit energies complete sets of closed orbits are computed. By projection to the reference frame of the galaxy, artificial rotation curves for every model are obtained and are compared with the observed rotation curves of the HII-gas.
In an iterative procedure, the parameters of the NGC 2336-models are optimized by computing and evaluating a large number of parameters. The result is a final model that reproduces the morphological structure of NGC 2336 as well as the observed kinematics of the HII-gas. The parameter values from the morphological decomposition and those needed to fit the HII-rotation curves best are in exellent agreement. The effects of changing single parameter values and possible error sources are discussed in detail. It turns out that the kinematics of the warm HII-gas of NGC 2336 can be explained without considering hydrodynamic effects, even in the central regions.
Key Words.:
galaxies: kinematics and dynamics – galaxies: photometry – galaxies: structure – stars: kinematics – ISM: kinematics and dynamics1 Introduction
Due to their strong non-axisymmetric potential, barred galaxies exhibit peculiar stellar and especially peculiar gas kinematics when compared to normal disk galaxies without bar. Since deconvolving their non-axisymmetric velocity field is difficult, the computation of consistent multi-component stationary models for these objects has proven to be a suitable method to gain further insight into the internal mass distribution and kinematics. This stationary modelling procedure can answer the question whether the observed kinematics of the galaxy agree with the model predictions derived from the observed distribution of luminous matter (assumed that plausible corrections for the presence of dark matter can be applied).
For the following studies the northern hemisphere object NGC 2336 was chosen. NGC 2336 is an intermediate-type spiral of Hubble-type with a prominent bar. This galaxy has not been subject to extensive morphological and kinematical studies yet. Basic parameters given by Tully (tully (1988)) are listed in Table1. NGC 2336 contains sufficient amounts of warm HII-gas for emission-line-spectroscopy. As is also required for kinematic studies and deprojection, the bar lies in a non-degenerate position with respect to line of sight, i.e. its apparent major axis does not coincide with the kinematic line of nodes (denoted hereafter). The inclination of ensures a fairly precise determination of the apparent axes ratios of disk, bulge and bar.
| [mag] | 10.65 |
|---|---|
| [arcmin] | |
| [Mpc] | 22.9 |
| [] | |
| [] | |
| 0.25 | |
| 3.7 |
Former photometric studies of NGC 2336 were mainly restricted to the HI observations of van Moorsel (moorsel (1983)). In HI, this galaxy reveals a very regular morphological structure devoid of any kind of anomalies or major asymmetries, except for the nearly complete lack of HI in the central regions. The HI distribution supports the image of a mainly undisturbed spiral structure in the outer part of the disk with numerous star forming regions. Although NGC 2336 belongs to an apparent pair of galaxies (together with IC 467) with a projected linear distance of kpc, its undisturbed disk does not exhibit any distinct sign of recent interactions. No morphological structures connecting these objects have been found. Due to the large beam size used for the HI-observations (), the inner part of the disk with the bar is not resolved. The HI disk isophotes at large radii remain undisturbed down to the detection limit. With lower threshold values of atoms/, the disk extends up to kpc () from the center. Recent studies by Martin (martin (1995)) based on POSS plates yielded the basic morphological parameters for the bar listed in Table 2.
According to the results of the HI-studies by van Moorsel (moorsel (1983)), NGC 2336 does not exhibit any kinematic peculiarities up to a distance of (kpc) from the center, i.e., the HI-velocity field is typical for a disk-dominated galaxy. A distortion of the velocity field at north to the center is caused by a sudden drop of the HI-column density and does not indicate non-circular motions in that region. The velocity field shows that the southern part of the galaxy is inclined towards us.
Because of the low resolution and the lack of HI just in the inner region, the HI velocity field is not suited to study the perturbation of the velocity field due to the bar potential. Optical spectrograms which show the kinematics of stars and (warm) gas with a much better resolution have not been available up to now.
The aim of this paper is the quantitative understanding and modelling of the bar-perturbed velocity field in NGC 2336. For that purpose we study the NIR morphology of this galaxy, representing the ditribution of the luminous matter. The total potential of disk, bar, and bulge is calculated. We consider the HII-gas to be in a stationary motion in this potential. The subsequent kinematical modelling leads to artificial rotation curves which are compared with the observed velocity field. The optimal parameters for disk, bar, and bulge, as well as the intrinsic geometry of these components, are obtained by an iterative study of many different models and their closed orbits.
The paper is divided into the following parts: Section 2 addresses the photometric observations, section 3 introduces the procedure for constructing multi-component 2D mass models and their subsequent deprojection. Section 4 presents the data reduction process and the detailed results of the spectroscopic observations of both, the gaseous and the stellar component of NGC 2336. A basic outline of the numerical representation of the potentials used for the orbit integrator (which computes closed orbits by means of a numerical FORTRAN-/C-program) is given in Section 5. Section 6 refers to the different Lindblad resonances in the NGC 2336-models, to the different orbit families and their relative contribution to the total number of orbits in a model. Model units are discussed in Section 7, while the basic instrument for phase space analysis – the Poincaré-Surfaces of Section – are introduced in Section 8 where the characteristic features of the NGC 2336-phase space are discussed. Finally, section 9 deals with the variation of independent model parameters which lead to the optimal model solution in Section 10. Results are discussed in Section 11.
2 Surface Photometry
2.1 NIR Images
To avoid wrong estimates for the relative contribution of the model components of NGC 2336 to the total luminosity, all models are based on NIR images (-band) where dust absorption is much less important than in the optical wavelength range. Additionally, galactic structures appear much more regular due to the smoother distribution of cool giant stars whose light is mainly traced in the NIR (for a review see Frogel et al. frogel (1996)).
The images used for our studies were obtained using the -camera at the MPIA -telescope at Calar Alto (Spain) during September 1995. consists of a NICMOS-chip and provides a field of view of with a resolution of /pixel when mounted at the -telescope (). Images were obtained in the - (m) and -band (m).
By repeating a routine which centers the telescope alternately on the object and neighbouring sky fields, 48 object exposures and skyflats with exposure times of sec were obtained, resulting in a total exposure time of sec. For the skyflats, the telescope was moved 25’ away from the object field in several directions. An additional telescope offset of a few pixels between the repetitions of the routine was also applied to correct for bad pixels on the detector chip. Several domeflat series were exposed to correct for illumination effects on the NICMOS array.
2.2 Data Reduction
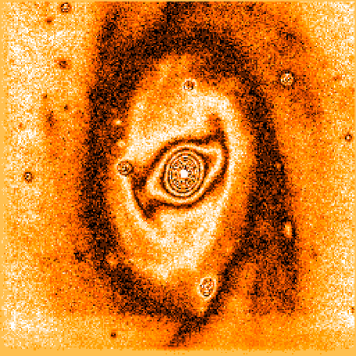
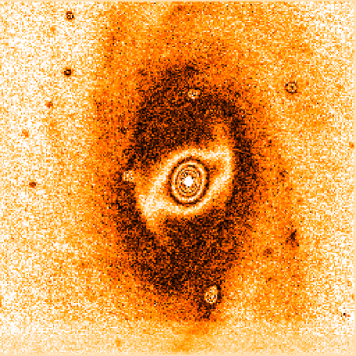
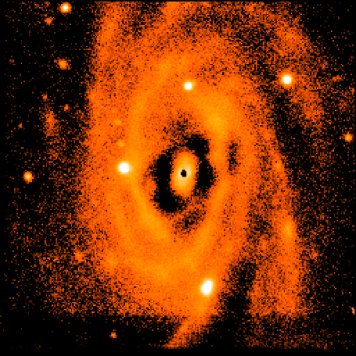
The single exposures of NGC 2336 were reduced by a standard reduction process: A 2D sky pattern is constructed by using a vertical median filter for the sky fields that were obtained in different offset directions. The resulting image is normalized to zero. The sky contribution is subtracted by linear interpolation of the sky level between the sky exposure before and after each object frame. By median-filtering the domeflat series, a master domeflat is created and normalized to one. The 2D sky pattern is subtracted from the object frame and the result is divided by the master domeflat. The pre-reduced object frames are then centered on field stars and then co-added by a --clipping algorithm to avoid the disadvantages of a simple addition (bad pixels remain) or a simple median filtering (quantitative distortion of the images, lower -ratio). The resulting images of NGC 2336 are shown in Fig. 1.
3 Modelling the Mass Distribution
The aim of the mass modelling is the determination of the underlying density distribution from the observed light profile of NGC 2336. The procedure works in several steps: First we determine the light distribution from the NIR images and decompose it into the three components disk, bar, and bulge. By iteration the optimal parameters of each component like scale lengths, central flux density etc., were determined by fitting an appropriate model. Since we used NIR images, this morphological model gives a good representation of the stellar light and also mass distribution (see Frogel et al., frogel (1996)). In order to keep the number of free parameters small we use thickness zero models for disk and bar, only the bulge model will make use of a 3D profile.
The equation for the flux model of the 3 components is
| (1) |
For the derivation the mass distribution, one has to take into account individual mass-to-light ratios for the components:
| (2) | |||||
For this step we have to consider the dark matter halo component which has an increasing dynamical influence with increasing radius. However, for spiral galaxies of medium and high luminosity the dynamical mass within the optical diameter of the galaxies is strongly dominated by the disk (e.g. Salucci et al, salucci (1991)). In the inner zone the dark matter does not play a dominant role. Since we are mainly interested in the dynamical influence of the bar, we refrain from modelling the dark matter component explicitly and include its contribution in of the disk (the bar). This means that our final () should not be directly compared with observed values for spiral disks (bars) since, besides the population effect, it contains a contribution from the dark matter halo. This procedure was chosen to include the dark matter in the corresponding potentials in a simple way, without making further assumptions about the spatial distribution of the dark matter. Therefore, we hereafter denote the mass-to-light ratios by . Equation 3 becomes
| (4) |
is nearly unaffected by dark matter contributions. Since the morphological model is based on J-band images, we set
| (5) |
In a next step we define and as relative mass-to-light ratios, compared to the bulge. We start the dynamical models with a set of start values for . These parameters will be optimized by an iterative comparison between the kinematical models and the spectroscopic observations, see section 9. The calibration of the total mass will be performed via the observed circular velocities in the outer parts of the disk, see section 10.
3.1 Profile types
The following types of luminosity profiles are used for the luminosity decomposition:
3.1.1 Disk
For the disk, an exponential profile with the surface density distribution
| (6) |
is used with as the countrate in the center and the scale length determining the slope of the luminosity profile. Due to its inclination the disk appears elliptically projected with an apparent axis ratio and a position angle of its apparent major axis. Free parameters therefore are:
-
•
the central intensity
-
•
the scale length
-
•
the apparent axis ratio
-
•
the position angle
The apparent axis ratio (i.e., the inclination ) defines – together with – the for the disk that will be used as deprojection axis for all three components.
3.1.2 Bulge
The central part of NGC 2336 is modelled by a profile of generalized Hernquist type (see Dehnen dehnen (1993)) with the density profile
| (7) |
with
| (8) |
yields the flat disk case, results in a spherical distribution.
With as a scale length and as the integrated mass, the central slopes of the densities are . This family of profiles include several special cases: The steep Jaffe (jaffe (1993)) type (), and the Hernquist (hernquist (1990)) type (). Moreover, this profile type is a good approximation for the classical de Vaucouleurs (devaucouleur (1948)) profile (). Free fit parameters are:
-
•
the scale length
-
•
the total mass
-
•
the profile parameter
-
•
the vertical flattening of the bulge
-
•
the apparent axis ratio
For the position angle of the bulge, , the same value as for the disk is used, since in disk galaxies the rotation axes of bulge and disk generally coincide. Nevertheless, and may differ due to the different thickness of the components.
The projected luminosity density of the bulge that can be observed in the sky is obtained by evaluating the integral
| (9) |
and is expressible in terms of elementary functions for integer only (see Dehnen et al. dehnen (1993) for further details).
3.1.3 Bar
A Ferrers (ferrers (1877)) bar with the surface density profile
| (10) |
with
| (11) |
is used. The total mass of the 2D bar obtained by integration is
| (12) |
(cf. Matthias matthias (1993)). Free parameters that have to be adjusted during the fitting procedure are:
-
•
the apparent bar major axis
-
•
the apparent axis ratio
-
•
the central surface density
-
•
the exponent that determines the density distribution of the bar
-
•
the position angle of the bar major axis,
In our models, all Ferrers bars will be used with for simplicity reasons.
3.2 Results
| disk | bulge | bar | |
|---|---|---|---|
| scale length [kpc] | |||
| scale length [arcsec] | 42.9 | 14.2 | 37.5 |
| apparent | 0.63 | 0.85 | |
| of major axis | |||
| relative contribution | 66.0% | 21.0% | 14.0% |
| profile parameter | 0.8 |
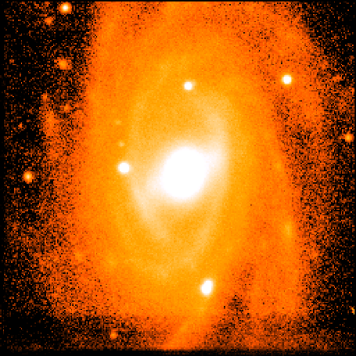
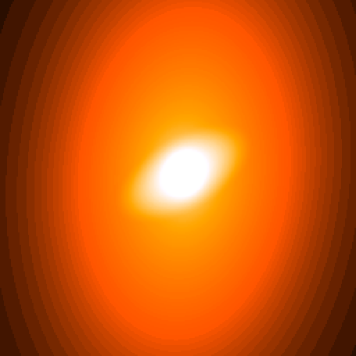
The model parameters are adjusted iteratively in order to minimize the residuals that remain after the subtraction of the model from the observed luminosity distribution. The model of NGC 2336 that fits the observed light distribution best is shown in Fig. 2, together with the remaining residuals. The parameter values obtained from the fit are given in Table 3.
As can be seen from the residuals in Fig. 2, modelling the central regions is difficult: residuals in the bulge area are still clearly visible after the subtraction of the model. This is a consquence of the fairly poor spatial sampling of the bulge area in the NIR images. In the same figure we notice that the spiral arm pattern is still present, because an average disk was subtracted generating positive residuals in the spiral arms and negative ones in the interarm regions.
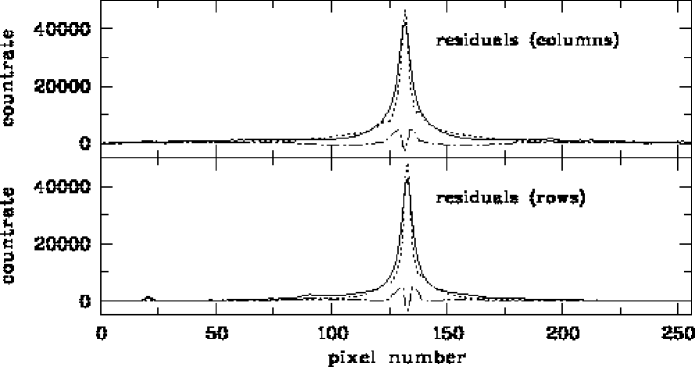
A quantitative impression of the quality of the fit is presented in Fig. 3, where the three central pixel columns and rows of every image in Fig. 2 are averaged. The overall fit to the luminosity distribution of NGC 2336, though revealing small differences between the model and the observations, is sufficiently good.
The morphological decomposition yields the result that NGC 2336 is dominated by the disk component, which contributes to the total luminosity, with the remaining light coming roughly equally from the bulge and the bar component.
3.3 Deprojection
Because of the inclined position of NGC 2336 in the sky, the 2D model of the surface brightness has to be deprojected in order to obtain the intrinsic bar axis value, . We use the deprojection angles and , according to the definition given by Goldstein(goldstein (1981)), with being equivalent to the inclination , and representing the offset between and the . is only necessary if a non-axisymmetric component (a bar) is present and is used to give the bar the desired orientation before deprojecting the disk. The results of the deprojection are shown in Table 4.
The large difference between the apparent and the intrinsic bar axis ratio in Table 4 originates from the orientation of the bar in NGC 2336 with respect to the : is nearly orthogonal to the around which the galaxy plane is rotated during the deprojection, so the minor axis of the bar remains unchanged. The enlargement of then leads to a decrease of .
Since the deprojection angles are three additional free parameters, the models will have to be tested for possible changes in the predicted kinematics that are caused by errors of , , and . The most sensitive parameter is probably : It does not only include a possible misalignment of the , but also a wrong determination of the bar offset from this line. In case of NGC 2336, the latter is important due to the orientation change of the bar isophotes towards larger radii (isophotal twist). To keep the number of free model parameters as small as possible, and will remain fixed for all models with their photometrically derived values being used. will be varied independently, the results are presented in Section 10, where the effects of parameter changes are discussed in detail.
A last correction has to be made for the projection effects of the flattened spherical bulge of NGC 2336. An infinitesimally thin disk that is viewed pole-on represents an intensity that changes to when viewed under the inclination . In contrast, a spherical bulge would look the same from every direction. It is therefore possible that a moderately flattened bulge introduces further uncertainties in the conversion factor defined in Section 3 which converts countrates into luminosities. These uncertainties would be caused by changed inclination corrections for a non-spherical bulge. It will be discussed in section 10 that the exact shape of the bulge does not affect the kinematics of the NGC 2336-models significantly, since for reasonable flattening ratios the projected mass density in the disk plane exhibits only minor changes.
4 Kinematical Observations
Spectroscopic observations were performed to determine the velocity fields of stars and gas in NGC 2336. By means of longslit spectroscopy of high spatial and moderate spectral resolution the radial velocities of stars and gas clouds were measured up to the outer regions of the disk () with high -ratios.
Emission-line kinematics:
For the kinematics of the warm HII gas component we used the light
from the - and -emission lines in the red
wavelength range. Since NGC 2336 is an intermediate-type galaxy, the
disk contains enough gas for emission-line-spectroscopy even in the
outer parts. Radial velocities were obtained by cross-correlating
single rows of the longslit spectrum with the extracted central line
from the core region of NGC 2336. The velocity dispersion of the warm
gas lies far below the instrumental resolution and was therefore not
studied.
Absorption-line kinematics:
The spatial distribution of the stellar velocities and velocity
dispersions was examined by using absorption line spectra in the green
wavelength range (Å). Using strong absorption lines like
MgI at =5167Å, 5173Å, 5184Å, CaI lines
at =5262Å, 5270Å, and several Fe lines, the
longslit spectra of NGC 2336 were cross-correlated with the spectrum
of suitable template stars (e.g. of type , , , ). The stellar velocity
dispersions are much higher than those of the warm gas, they exceed
the spectral resolution of our instrument configuration and can be
studied in greater detail, at least in the central regions.
All spectra were obtained during an observing run in March 1997 using the MPIA m-telescope at Calar Alto (Spain) with the TWIN-spectrograph. Due to a beamsplitting mirror with a crossover wavelength of Å, this device was capable of observing the blue and the red channel simultaneously. The cameras in both channels were equipped with SITE-CCDs with a pixel size of m. With a scale length of m along the slit and the correction for the ratio , we obtained a spatial resolution of /pixel. Gratings with a dispersion of Å/mm were used, the grating angles were adjusted such that the central wavelengths became Å in the blue channel and Å in the red channel.
To achieve a ratio as large as possible, the slit width was adjusted to . With our instrument setup and grating angles, the corresponding slit image was pixels in the blue channel and pixels in the red one.
NGC 2336 was observed in 4 slit positions along the major and minor axes of disk and bar (). The corresponding position angles were . Exposure times were the same for emission and absorption spectroscopy: sec in each slit position. The data reduction process for both, the emission and the absorption line spectra, used a standard pre-reduction procedure containing the subtraction of the bias, the time-dependent linear dark current, and a flatfield division. The correction for the light distribution along the slit (including vignetting effects of the camera optics) was made by means of a slit profile obtained from a series of skyflat exposures.
The subsequent main reduction process of the stellar spectra consisted of the following steps: Removal of saturated pixels (cosmics), wavelength calibration (equidistant in ) via a rebin in , sky subtraction, continuum subtraction, etc. . In a last step, these spectra were compared with correspondingly prepared spectra of the template stars. We used a hybrid method of Bender (bender (1990)) which combines cross-correlation and Fourier quotient evaluation . This method is less sensitive to template mismatching and does not necessarily assume Gaussian broadening functions. From this procedure, the stellar radial velocity curves were obtained. Velocity dispersions were computed using the broadening of the maximum of the correlation function.
The data reduction of the emission line spectra was roughly the same, except for the fact that no template star, but the central line of the galactic spectrum was used for correlation, and for the slightly different correlation program being used.
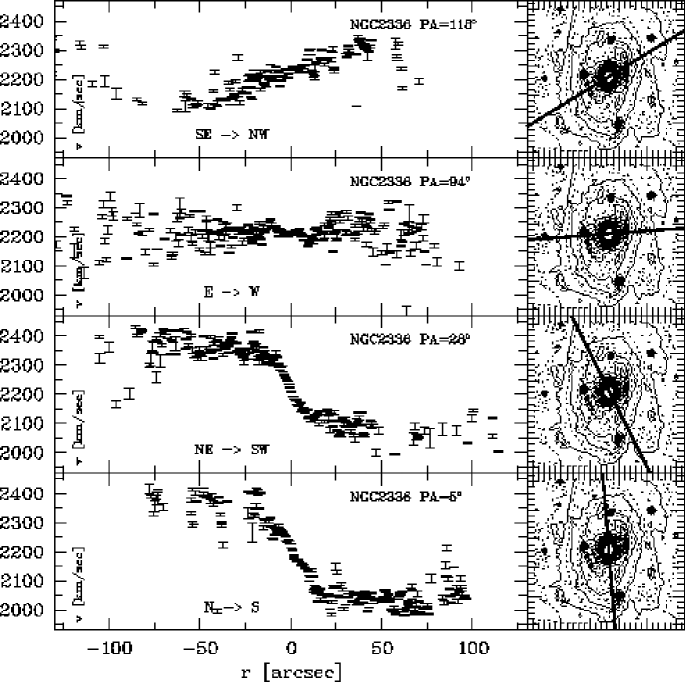
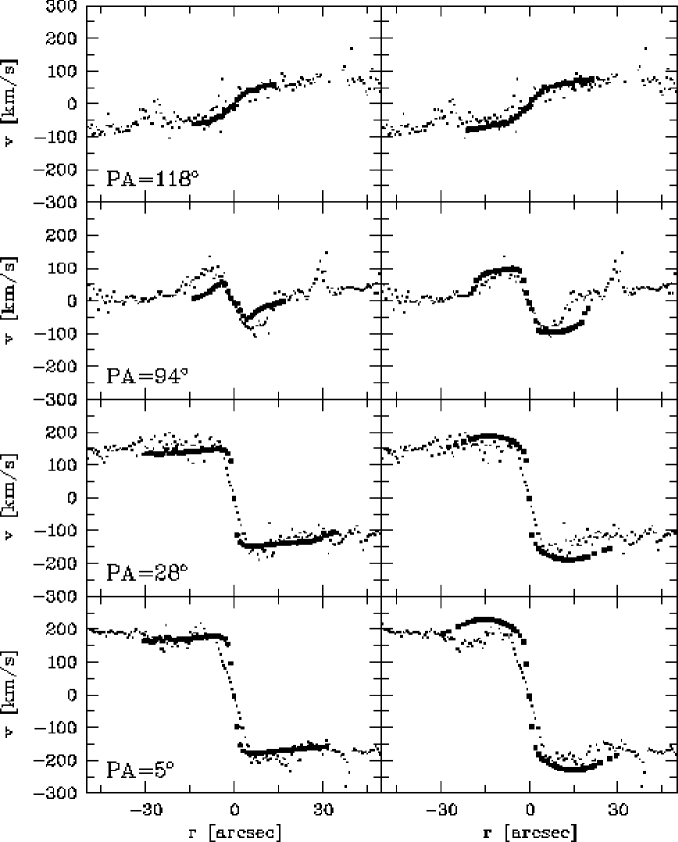
To collect as much light as possible, we chose a slit width of for all observations which of course affects the spectral resolution: With Å/pixel (blue channel), the nominal resolution for measuring velocity dispersions was km/sec/pixel. Projected onto 4.5 pixels (blue channel), the slit width became pixelkm/sec/pixel km/sec in velocity space. But since we obtained the velocity dispersions from measuring the broadening of the maximum of the correlation function only, the achievable resolutions are much better: A lower threshold of km/sec obtained for our stellar spectra is only marginally worse than the Nyquist-limited spectral resolution of slit. The resulting rotation curves of gas and stars and the stellar velocity dispersion curves are shown in Fig. 4, 5 and 6.
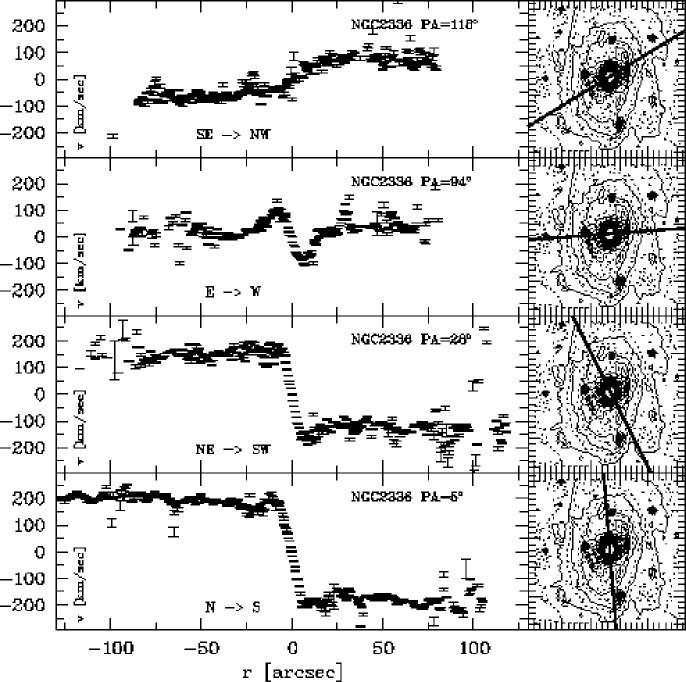
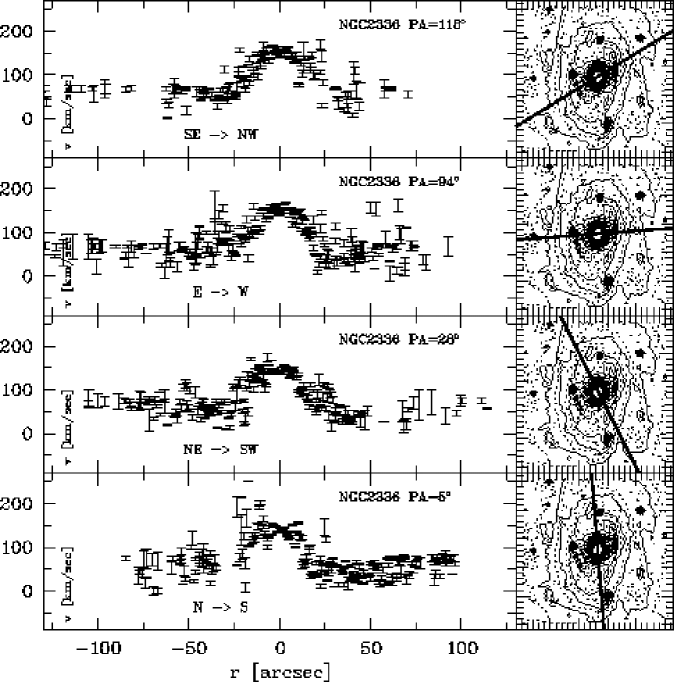
Considering the gas rotation curve for a slit orientation near the kinematical (Fig. 4, ), we notice the steep rise of the radial velocities to values of km/sec within only, corresponding to kpc. This ascent in the inner part of NGC 2336 is caused by a centrally condensed and moderately massive bulge component. The presence of the bar is revealed by small humps (overshootings) in the rotation curve at a distance of from the center, after which the velocities decline again (km/sec). At distances from the center greater than , is constant, indicating that NGC 2336 does not contain a disk component with a large scale length that would cause a considerable increase of beyond the regions dominated by the bar.
In contrast to that, the stellar rotation curves for the same slit orientation () in Fig. 5 show a different behaviour: The final values of are not reached within of (2.7kpc), although the final values of are indeed the same. Therefore the central slopes of these two gas rotation curves in the innermost regions are significantly shallower than those of the stellar rotation curves.
This behaviour originates from the qualititatively different orbits which stars and HII-clouds are moving on: Because of the non-neglectible cross-section of the spatially extended HII-regions, they accumulate preferentially on non-intersecting orbits in the disk. If HII-regions would populate self-intersecting orbits with loops, collisions would remove them from these paths after only a few rotation periods of the bar. As a result, intersecting orbits do not play any role for the kinematics of the warm gas component. In other words, the radial component of the motions of the HII-regions will be dissipated with time so that only circular or nearly circular orbits survive. This means that – viewed from the corotating reference frame of the bar – in our stationary models the HII-clouds will populate closed non-intersecting orbits of elliptical or circular shape.
In contrast to that, stars can be regarded to as point-like test particles that do not collide on timescales of . In general, stars will therefore also populate orbits with a high contribution of radial motion. This is especially true for the stellar bulge which – like an elliptical galaxy – mainly consists of disordered motion. Therefore the integration over many stellar orbits along the line of sight results in a reduced radial velocity and high velocity dispersion values in the bulge region (cf. Fig. 6). This causes the different slopes of the stellar and HII-rotation curves in the inner regions of NGC 2336 in Fig. 4 and 5.
An even larger difference between the motion of stars and gas occurs in case of a slit position along the minor axis of the disk () in Fig. 4 and 5. The humps and dips in the gas rotation curves with km/sec at a distance of (0.6kpc) from the center indicate high streaming velocities along the bar. Those humps and dips are also present in the stellar rotation curve in Fig. 5, which is a necessary condition for the existence of the bar structure, since stars constitute the bar. But as is clearly visible, those overshootings are much smaller, since the innermost regions of NGC 2336 are dominated by the highly disordered radial motions of the bulge stars which nearly cancel out during the integration along the line of sight. To summarize, HII-clouds can been regarded to as ideal test particles to trace the underlying gravitational potential of the bar. The latter is mainly generated by the stars, carrying most of of the total visible mass in normal intermediate-type disk galaxies.
The comparison between radial velocities of gas and stars for (along the major axis of the bar) in Fig. 4 and 5 yields no qualitative difference, except for the -ratio being again low for the stellar kinematics, which prevents us from comparing the outer regions with . Both curves (gas and stars) show similar solid body rotation over the whole length of the bar.
As shown in Fig. 6, NGC 2336 reaches a central velocity dispersion of km/sec. In all velocity dispersion curves the bulge extends up to radii of . This means that the apparent bulge axis ratio cannot be much smaller than 1, with as a lower boundary, taking the velocity dispersion curves at (disk major axis) and (disk minor axis) as reference. It is not possible to determine this axis ratio here more exactly, but a kinematically derived condition agrees well with the photometrically derived value of .
5 Potentials
To derive the common potential of disk, bulge, and bar, we make the following approximation: Disk and bar are collapsed to their plane of symmetry, their potential is calculated in 2D. The bulge is considered as an oblate spheroid, but the potential of this 3D mass distribution is computed only in the disk plane. The following section deals with the derivation of the 2D potentials from the morphologically derived luminosity profile and their implementation into the FORTRAN-/C-orbit integrator.
In general, potentials and density distributions are connected by Poisson’s equation . For the Ferrers bar, the exponential disk and the generalized Hernquist bulge, no analytical closed expressions for their 2D potentials are available (except for some special cases), so they have to be evaluated by means of numerical representations or expansion series.
5.1 Disk
It is not appropriate for the potential calculation to consider the disk as a collapsed 3D sphere with thickness zero, since one encounters double integrals that cannot be solved easily. As a better approach, we use Bessel functions to derive the disk potential (described by Binney and Tremaine binney (1987), originally developed by Toomre toomre (1962)). With the ansatz , the Laplace equation can be solved except for the 2D plane of the disk, where the gradient is discontinuous. Using the Gauss theorem, the mass density that generates the gradient discontinuity is found to with as cylindrical Bessel function of 0th order. With the Hankel transform defined by
| (13) |
the potential is given by
| (14) |
It can be shown that for the exponential disk with
takes the form
| (15) |
For the 2D disk () and with , this results in . and are modified Bessel functions of 1st and 2nd kind. This expression is implemented in the program used for the calculation of closed particle orbits.
5.2 Bulge
For the generalized Hernquist bulge luminosity profile, there are no closed analytic expressions for the corresponding (see Dehnen dehnen (1993)). Therefore, our orbit integrator includes FORTRAN-routines written by Walter Dehnen (Oxford) which allow a numerical treatment. The 3D bulge potential for the generalized Hernquist profile takes the form
| (16) |
with as the flattening parameter,
| (17) |
and
| (18) |
The bulge is the only component with a 3D potential implemented into the numerical orbit integrator programme (disk and bar are considered with the corresponding 2D expressions). Since the flattening parameter determines the mass density projected onto the 2D plane, will be sensitive to changes of that parameter.
5.3 Bar
To illustrate the derivation of the bar potential , we first derive a 3D expression for the potential of a general oblate spheroid and reduce that expression to the 2D case afterwards. The resulting 2D potential allows a very simple numerical treatment of the bar.
A generalized 3D-disk can be expressed by means of an expansion method described by Binney and Tremaine (binney (1987)) that uses oblate spheroidal coordinates. Those coordinates use the from cylindrical coordinates, but replace and by , and , respectively, with as a constant parameter determining the range of the coordinate system. The potential of a 3D disk outside the inner 2D area , where this coordinate system would be ambiguous (there exist two -values for each ), takes the form
| (19) |
with
| (20) |
are the Legendre polynomials of 2nd order, are the spherical harmonics. is a constant that contains
| (21) |
with
| (22) |
as the generating surface densities that account for the . and are constants. The generating 3D potentials are divergent for , but remains finite. This causes numerical problems when one wants to compute potential values at . This restriction limits the use of the expansion series approximation, because we are prevented from calculating at large radii (in the vicinity of ). Nevertheless, the method is generally useful for approximating potentials with sharp boundaries (like the Ferrers bar).
In the inner 2D disk (defined by in the spheroidal coordinate system), which is the only interesting region for calculating the potential of a 2D bar, the coordinate transformations reduce to and with . The collapsed 2D potentials are no longer -dependent:
| (23) |
This simple form is sufficient for our 2D studies and has the advantage that arbitrary bar forms (e.g. asymmetric or drop-shaped bars) can be treated.
According to the initial definition as scale parameter, defines the model unit for the radius, so is the maximum radius at which the potentials can be calculated. Scaling of the model according to different bar lengths or different radii up to which the models have to be examined is achieved by defining and as fractions of , e.g. and . Scale lengths of the bulge and the disk component are then adjusted according to the bar length. Therefore, in a model with a bar major axis , potentials can be calculated up to a distance of . For all models a bar length will be used, the scalelengths of disk and bulge are then defined according to . It turns out that, with the resulting maximum radius of bar lengths accessible by the potential expansion series, the outer Lindblad resonance lies well within the reach of most of our models. To restrict the consumption of computational time, we truncate the expansion series (equation 20) at appropriate values and that determine the angular and radial resolution. For most of the models discussed below we use and which ensure sufficiently resolved potentials.
In a final step, the total potential of the NGC 2336-models is obtained by simply coadding all contributions:
| (24) |
6 Resonances and periodic orbit families
For small deviations from axisymmetry, barred potentials can be treated by means of linear theory, in which a star radially oscillates around its guiding center with an epicyclic frequency . The guiding center moves around the center of the galaxy with the circular frequency . In this approximation, several resonances appear where particles are subject to strong interactions with the rotating bar potential: the inner Lindblad Resonance (), the Corotation (), and the outer Lindblad Resonance (hereafter , for an extended review see Sellwood and Wilkinson sellwood (1992)). However, in case of NGC 2336 this approximation is not valid due to the non-neglectible contribution of the massive bar component to the total potential. But although single particle orbits can no longer be computed analytically, the examination of the resonances is still useful when studying the kinematics. The locations of the resonances have to be determined directly from the analysis of the phase space (Combes combes (1994)).
In all NGC 2336-models, the typical , - and -families of closed, therefore periodic orbits exist between the different resonance locii. The general properties of these orbit families are the same for all NGC 2336-models and representative for a disk galaxy with a bar component contributing roughly 10% to the total potential, as given by Contopoulos (contopoulos (1980)).
The orbits of the -family are elongated along the bar major axis within , they are the main orbit family supporting the bar. They cover the range from the center up to the outer regions of NGC 2336. Outside they become rounder and change their rotation sense from prograde to retrograde, since particles on such orbits are moving slower than the bar. Epicyclic orbits with loops, belonging to higher (n:m)-resonances of the -family, will be populated by stars only and are therefore excluded from the orbit sets used for the construction of artificial rotation curves of the HII-gas. -orbits are confined to the region between the center and . The nearly circular -orbits do not support the bar. Because of their retrograde orientation they are not populated by gas clouds. They are therefore neglected for the construction of HII-rotation curves.
In the rotating reference frame of the bar, the normal energy is no longer conserved along the particle trajectories, since virtual forces appear that add a centrifugal and a Coriolis term to the equation of motion. Instead of (with denoting the velocity in an inertial coordinate system, cf. BT87), the so-called Jacobi energy is conserved:
| (25) |
will therefore be used as model parameter instead of the normal energy .
7 Model Units
7.1 Length Scale
As described in Section 5.3, model length scales are coupled to the numerical expansion radius by choosing the maximum radius the kinematics of orbits shall be computed for. It turns out that for reasonable mass distributions, is a good choice for , since the lies then well within the reach of our models. The length units are calibrated using the -images. As given in Section 3.2, the best photometric decomposition model of NGC 2336 has a minor axis length of the bar of pixels. With the scale of /pixel of the MAGIC camera, we get . With a the length of becomes
With a distance of Mpc (based on km/sec/Mpc), we get , which results in the model scale ()
| (26) |
so the photometrically derived bar of NGC 2336 has the dimensions kpc and .
7.2 Mass Scale
We calibrate the mass scale via the equation for the circular velocity
| (27) |
We use those velocity values that are found far out in the disk (kpc) to obtain
| (28) | |||||
| (29) |
Since the relative mass-to-light ratios and have to be found by optimizing the kinematical model, this is an iterative process. The kinematical effects of varying and are studied by corresponding model sequences, similar to those for the scale lengths, the pattern speed of the bar, etc. With this method, the mass unit is determined to
| (30) |
7.3 Time scale
The time scale is adjusted such that . This yields
| (31) |
8 Phase Space Analysis and the Integration of Closed Orbits
8.1 The Poincaré-Surfaces of Section
Stars and gas particles in real barred galaxies are normally not likely to strictly follow periodic orbits (so their occupation number should be low), but it can be shown that most of the non-periodic orbits in barred galaxies are trapped to oscillate about a parent periodic one (for an extended review on phase space analysis see Sellwood and Wilkinson sellwood (1992)). Such orbits are often referred to as quasi-periodic.
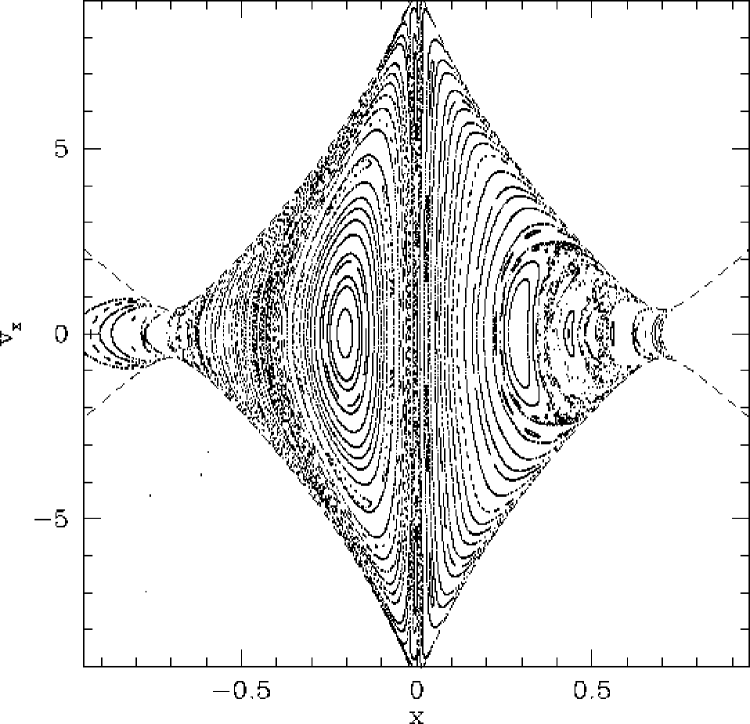
Therefore the examination of periodic orbits is an important tool, because the structure of the bar is largely shaped by those parent orbits. To derive the spatial extent of the regions supported by the parent orbits, the division of phase space has to be studied by means of numerical methods. For those purposes, cuts through phase space at a certain orbit energy – the Poincaré-Surfaces of Section (hereafter ) – are widely used. Positions and velocities are measured every time a particle crosses the plane (or ), thereby constituting the - (or ())-Surface of Section at a given Jacobian energy .
The division of phase space in the case of the NGC 2336-models exhibits characteristic features which are explained using results of a model with a moderately flattened () bulge (model parameters are listed in Table 5).
| bar | |
|---|---|
| [LE/kpc] | |
| [LE/kpc] | |
| 1.5 | |
| bulge | |
| [LE/kpc] | |
| 1.0 | |
| disk | |
| [LE/kpc] | |
| 2.5 | |
| [km/sec/kpc] | |
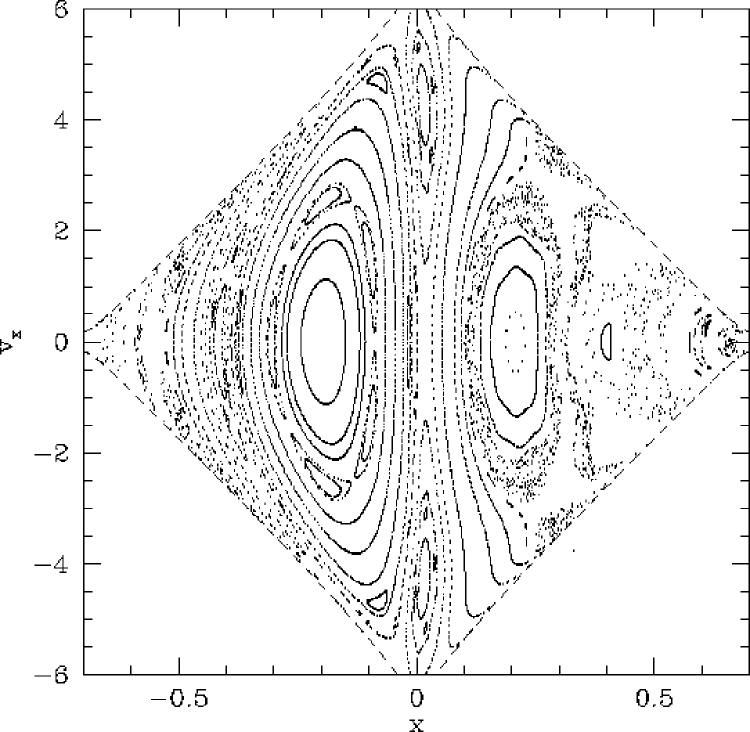
The -Surfaces of Sections for different -values are displayed in Fig. 7.
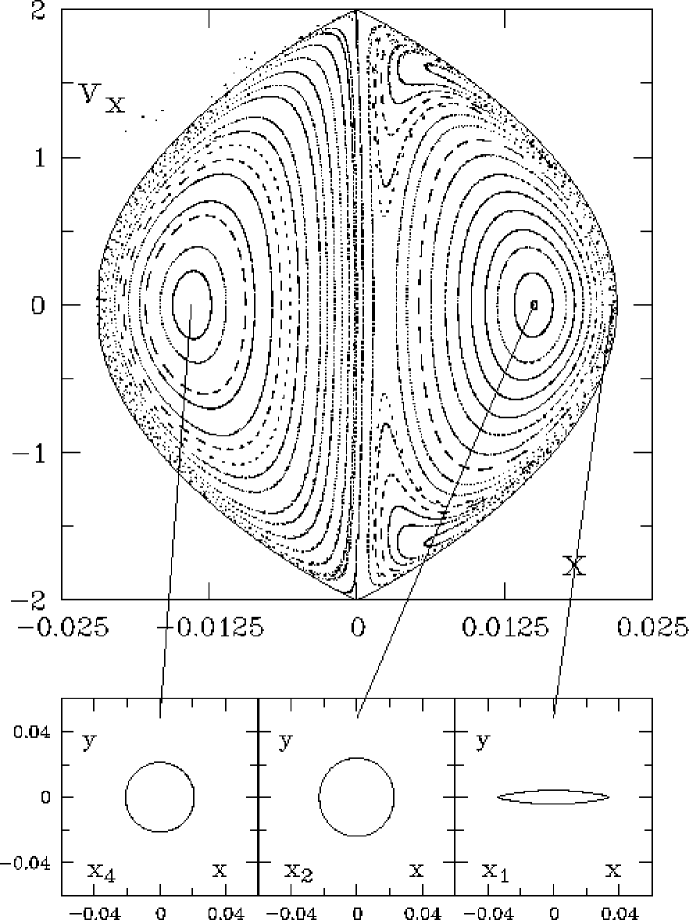
For low -values (left plot in Fig. 7), the phase space of the NGC 2336 is dominated by - and -orbits on the prograde side () and by -orbits in the retrograde half () of the Surface of Section. Each periodic orbit is surrounded by closed invariant curves (hereafter s) of quasi-periodic orbits. For this energy well below that of the inner Lindblad resonance (), -orbits cover a considerable area in phase space. This behaviour originates from the centrally condensed model with a high bar mass that produces a strong . Notice that particles at that -values can travel a small region within the bar only, since the -boundary extend only up to , while the bar axes lengths are and , respectively.
At higher -values (central plot in Fig. 7), the retrograde side remains nearly unchanged, while on the prograde side -orbits are now completely absent since . The -orbits have become rounder and a small amount of semi-ergodic motion can be traced that surrounds the -island. These semi-ergodic orbits, indicating irregular motions, are always present in models with a massive bar and hint at a self-regulating mechanism for the bar strength: The more mass is accreted in the center of a barred galaxy, the steeper the central potential will become and the higher will be the percentage of semi-ergodic orbits. But with too much semi-ergodic motion, a bar will not be able to sustain its length and mass on longterm scales because of a lack of particles on orbits supporting the bar. If therefore two NGC 2336-models with the same artificial HII-rotation curves contain different amounts of semi-ergodicity at comparable energies, the model with the smaller amount of semi-ergodic motion will be chosen for stability reasons.
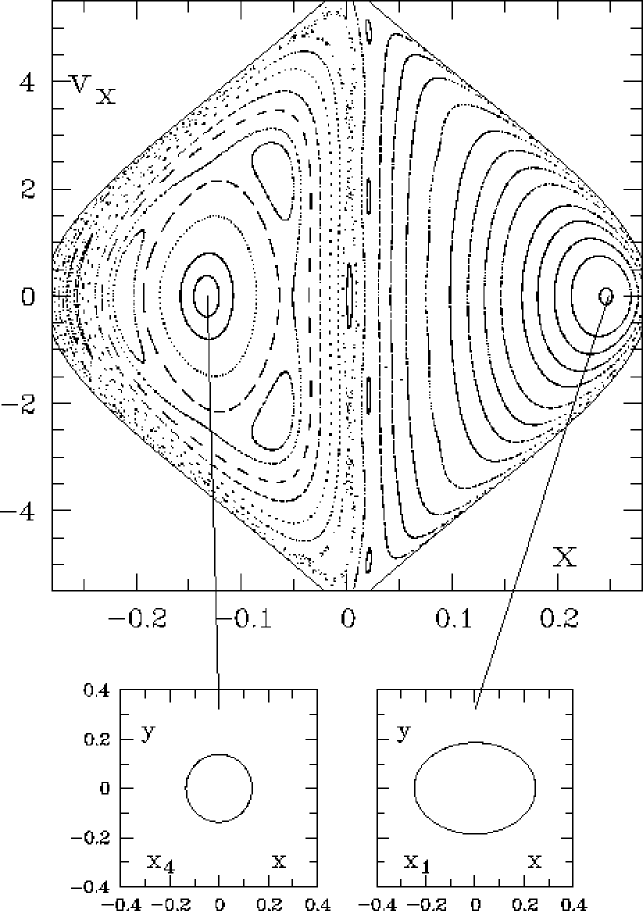
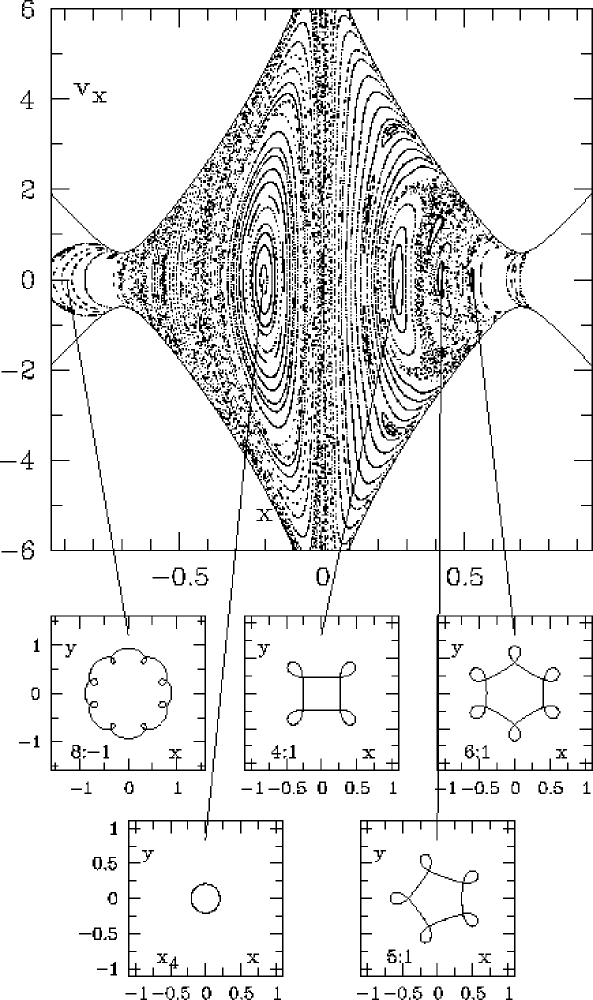
Slightly above the energy , the Surfaces of Section look completely different. At , the regions outside the bar become energetically accessible to closed orbits, as can be seen in Fig. 7 (right plot). But the phase space outside is only partially populated with orbits, which is a tendency that becomes even more evident when proceeding towards even higher energies. For this model, is placed at (at the end of the bar) by adjusting the pattern speed . In the prograde half of the phase space, numerous islands belonging to (n:m)-families of higher resonant orbits have replaced the -orbit and its surrounding s. For the HII-kinematics, those higher resonances are of no importance due to their small occupation number, which is caused by their self-intersections leading to a depletion after short times. They contribute only to the stellar bar in a significant manner. The most important of those islands belongs to the (4:1)-resonance, which is located at in Fig. 7 (right). Other higher resonant families (e.g. the (6:1) family) are less important.
8.2 Construction of Artificial Rotation Curves
Our orbit integrator uses HII-clouds as test particles to trace the underlying gravitational potential of the NGC 2336-models. Trajectories are integrated on a grid-based scheme, which means that in each cell of the phase space HII-clouds with certain initial conditions (e.g. energy, velocities) are started and their trajectories are followed through the phase space.
For each model, complete sets of closed orbits that belong to the - and (if they are present and/or necessary) -family are computed: The orbit integrator uses the phase space coordinates of the periodic orbits at various -values as starting points and computes a number of orbits (normally 100 of each family type) belonging to different particle energies. The program uses a continuous check for the particle energy during the integration of every orbit to ensure conservation of the Jacobian energy . The energy interval for which the orbit sets are computed is adjusted with regard to the different Lindblad Resonances in the model (e.g. orbits between and or and ).
All resulting orbit sets are then projected to the sky with the same inclination and orientation as the galaxy. The orbits generate the kinematical “backbone” of our artificial galaxy. A virtual longslit is projected to the sky as well. Corresponding to the observations, a constant slit width of is chosen for all models discussed below. The orbit integrator looks for the points where an orbit crosses the virtual slit and computes and for every crossing point. All crossing points together yield the artificial rotation curves for a given orientation angle of the virtual slit. The large number () of orbits in each complete set ensures a sufficient spatial resolution of the artificial rotation curves even in the central regions of the NGC 2336-model.
In a last step the rotation curves are convolved with a gaussian point spread function of constant width () to correct for the seeing conditions of the original longslit spectra. By varying the position angle of the virtual slit, all position angles from the observations can be traced.
9 Variations of the Model Parameters
The model parameters were varied to check for qualitative and quantitative changes in the synthetic kinematics of the HII gas. We also tried to answer the question whether a possible best-fitting model could be subject to ambiguities that are caused by the fact that the variation of two independent model parameters may have the same effect on the artificial rotation curves. Therefore, the following parameters were varied in a range that agrees well with the photometrical observations:
-
1.
The bar offset from the line of nodes, : Several cases were calculated with this parameter varied in the range which is well in agreement with the -band-observations. Since the Euler angles and are subject to very small deprojection uncertainties only, they remain fixed for all models.
-
2.
Major and minor axis of the bar, and : Due to the presence of another dominant component in the center of NGC 2336 – the bulge – errors may occur when evaluating . In principle, a larger could be compensated by a different choice of the bulge scale length, .
-
3.
The bar mass, : The exact determination of is not easy since the bulge component contributes to the luminosity in the inner regions as well. The bar mass (equivalent: ) was varied at the expense of the bulge and vice versa.
-
4.
The bulge scale length, : The fit of the bulge scale length, , to the -band luminosity distribution is difficult because of the small detector area covered by this component. Variations of in the models are therefore necessary.
-
5.
The flattening of the bulge, : This parameter is important because it determines the percentage of the total projected bulge mass that is concentrated in the disk plane. The value of could in principle be estimated directly from the photometric data by evaluating the different apparent axis ratios of the (flattened) bulge and the (infinitesimally thin) disk, and . But as it is the case for , the reliability of the estimated -value suffers from the low resolution in the bulge area. In our models, is therefore varied in the reasonable range , well consistent with the photometrically derived apparent axis ratio.
-
6.
The bulge mass, : The effects of different bulge masses (-values) strongly mix up with the results of changing (), therefore models have to be checked for this parameter indepenently.
-
7.
The disk scale length, : The exact determination of is limited by the size of the -detector that partially omits the outer disk regions. Since no further information about can be obtained, the photometrically derived value is used for all models.
-
8.
The disk mass, : Changing () causes significant velocity changes in the regions far outside the bar. Its contribution to the total mass varies according to the masses of bulge and bar.
-
9.
The bar pattern speed, : This parameter does not only depend on the radial mass distribution of a model, but can also be varied independently since no direct observational constraint is available. To make the models better comparable when varying the other parameters, each NGC 2336-model should have placed at the same absolute radius, since certain features in phase space are spatially connected to the radius, e.g. the regions of semi-ergodic motion or the occurrence of higher resonant families. To achieve a constant value for , it is necessary to change each time the radial mass distributions are changed by variations of scale lengths and masses.
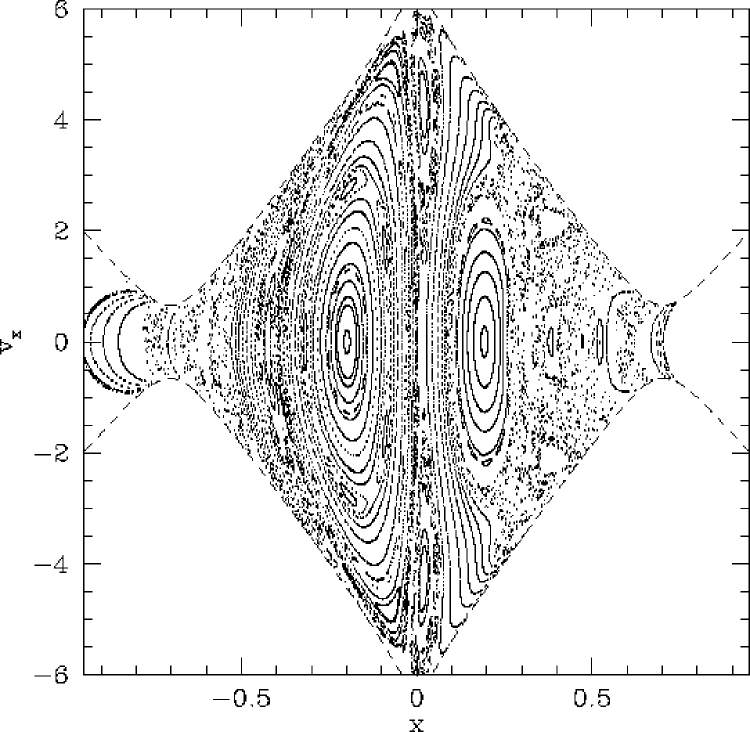
Model 1 2 bar 0.7/7.17 0.87/7.17 0.245/2.51 0.245/2.51 0.35 0.35 1.0 5.0 bulge 0.9 0.9 0.20/2.04 0.20/2.04 0.4 0.4 1.0 1.0 disk 0.46/4.76 0.46/4.76 2.5 2.5 18.2 19.1 Table 6: Model parameters for two models with different bar masses. The scale lengths are given in model (LU) and absolute units (kpc). All other parameters are the same as in Table 5. To illustrate the qualitative difference between low and high bar masses, the bar conversion factor is set to an (observationally not confirmed) value of in model 2, while model 1 uses , corresponding to the mass directly obtained from the morphological decomposition procedure. 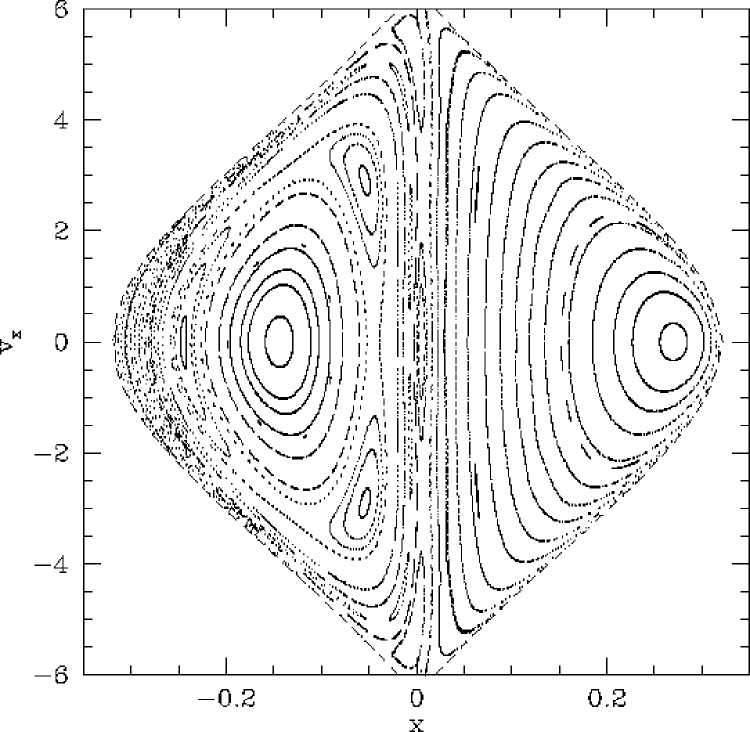
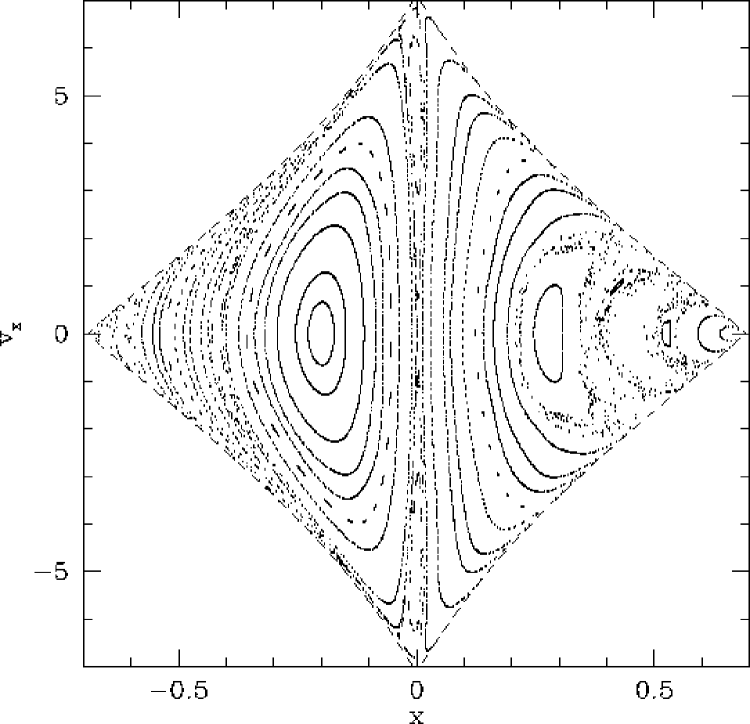
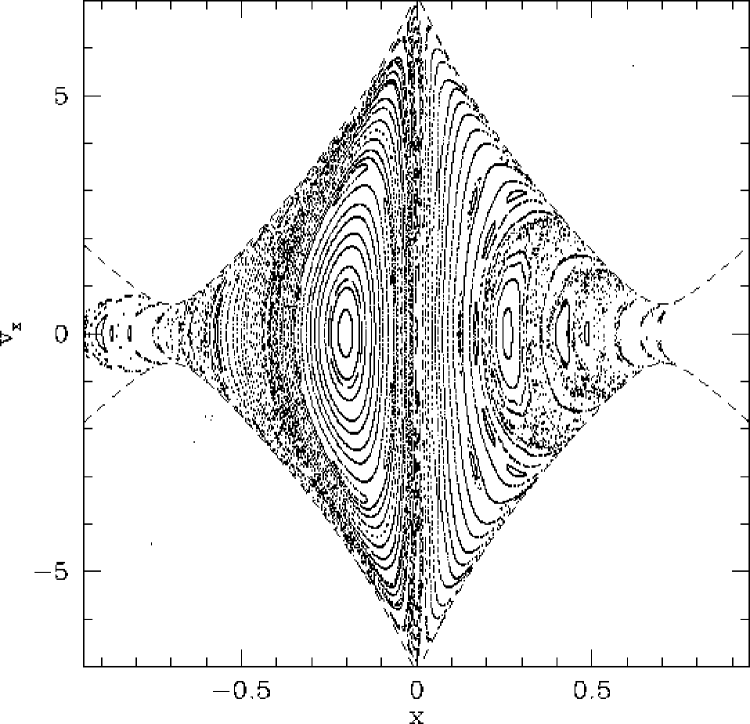
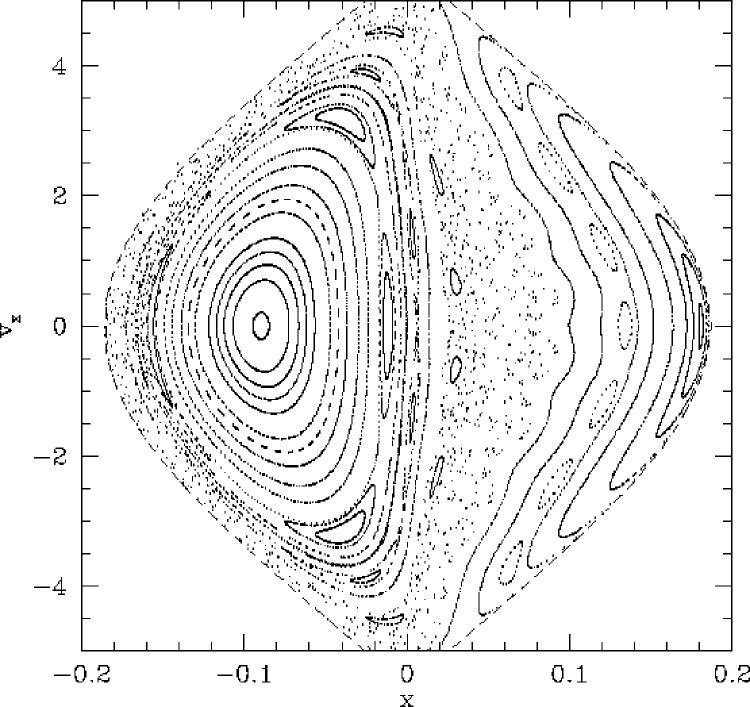
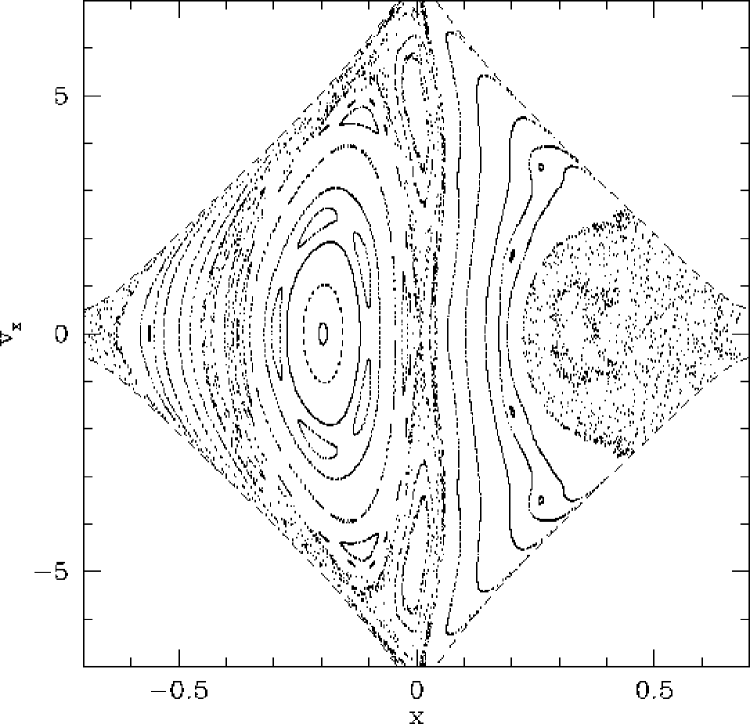
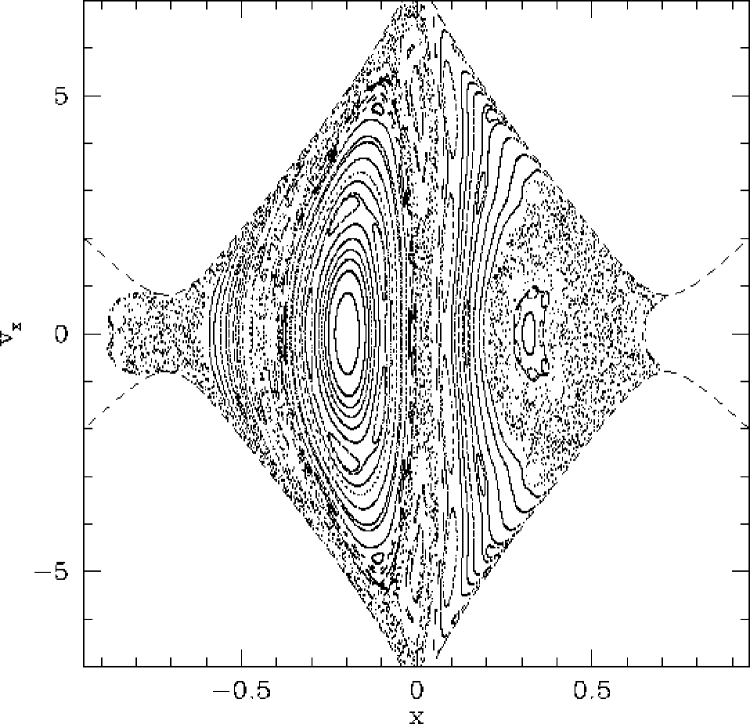
Figure 8: s for model 1 (, upper row) and 2 (, lower row). Energy values are increasing from left to right. The values are: (model 1) and (model 2). Corotation is placed at . On the other hand, has to be varied independently (with all other parameters fixed) to study the influence of different corotation radii on the NGC 2336-kinematics. The results of those variations are helpful for positioning with regard to the bar length. This is a step that can only roughly be performed using morphological features (e.g. bifurcations, spiral arms or rings).
-
10.
The profile parameter of the bulge, : Different values of change the radial mass distribution of only the bulge component. The effects of such changes are already examined by the variations of in a sufficient manner. Therefore, we adopt for all models.
To illustrate the effects of the variations of the model parameters, the Surfaces of Section and the rotation curves of four different models are shown in the following two Sections. Section 9.1 deals with two models with different bar mass . In Section 9.2, the effects of two different disk masses are studied. Section 9.3 describes the effects of various -values.
9.1 Variation of the bar mass
The bar mass is changed by variations of . Table 6 lists the basic parameters for two models with different bar masses. Model 1 with a of uses the observationally determined value. Model 2 uses which obviously is not confirmed observationally but is useful for illustration purposes. In both cases, is placed at the end of the bar: .
In general, the division of phase space resembles the one of the introductory model: s around the periodic -orbit are dominating the prograde side and -s cover the retrograde one. -orbits are completely absent for both models, even at very low -values that are not shown here.
Comparing the Surfaces of Section in Fig. 8, a much larger percentage of semi-ergodic motion for model 2 (lower row) can be detected at every energy level. This result supports a well-known fact: massive bars with their strong non-axisymmetric potential favour the existence of numerous semi-ergodic orbits. In the of model 2 at low energies (lower row, left plot), a small number of islands around the s of the -family is located within a sea of irregular or semi-ergodic motions. Due to the limited resolution of the grid and the limited time over which the non-periodic orbits are traced by our integration program, the space between the s is not completely filled wih islands and single points.
Further differences between model 1 and 2 occur when one approaches higher energies (central and right columns in Fig. 8) around (model 1) and (model 2), respectively. The (4:1)-resonance, visible at (Fig. 8, central column), is much stronger for model 1 than for model 2.
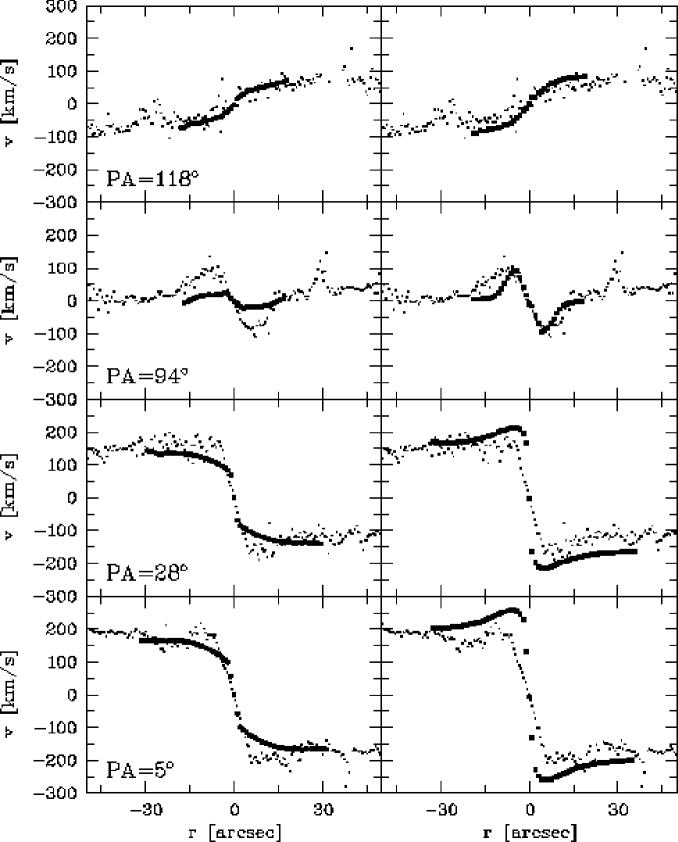
When comparing the artificial HII-rotation curves of both NGC 2336-models in Fig. 9, significant differences occur for nearly all slit orientations: Model 2 (right column) predicts higher velocities for the bar-dominated inner region of NGC 2336, especially for slit positions that trace the streaming velocities of particles which are moving on -orbits along the bar (). While model 1 (left column) seems to be a good description for the HII-kinematics for slit orientations along the major axis of the disk ( and ), model 2 produces velocities that are too high up to regions around . Only along the major axis of the bar (), no differences between model 1 and model 2 are visible.
Model 1 mainly suffers from the fact that the overshootings in the rotation curves at cannot be traced to their full extent: velocities are too low by km/sec when comparing the peak values of observed and predicted rotation curves. In addition, the radial extent of these humps is too small by a factor of 2.
A general mismatch between observations and model calculations occurs in the innermost regions up to , where the slopes of the artificial rotation curves of model 1 and 2 are too steep, compared with the observed ones. This is a hint at a too high bulge mass concentration in both models.
The results of this section show that is too low to explain the observed velocity field in the inner regions, while is too high. The optimal value should lie in the range .
Second, -ratios which are close to the photometrically derived value () or agree with it, are reasonable, since it seems possible to achieve a good agreement between the model and the observations. If discrepancies between observed and predicted velocity field are still remaining for observationally confirmed bar parameters, other parameters which are closely connected to the kinematics of the inner regions of NGC 2336 will have to be adjusted. E.g., the velocity contributions that are still missing in model 1 at with reasonable bar parameters could be generated by slight changes of or by raising the central mass ().
9.2 Variation of the disk mass
| Model | 3 | 4 |
|---|---|---|
| bar | ||
| 0.7/7.17 | 0.87/7.17 | |
| 0.245/2.51 | 0.245/2.51 | |
| 0.35 | 0.35 | |
| 1.5 | 1.5 | |
| bulge | ||
| 0.9 | 0.9 | |
| 0.20/2.04 | 0.20/2.04 | |
| 0.4 | 0.4 | |
| 0.63 | 0.63 | |
| disk | ||
| 0.46/4.76 | 0.46/4.76 | |
| 5.0 | 2.5 | |
| 20.3 | 22.2 | |
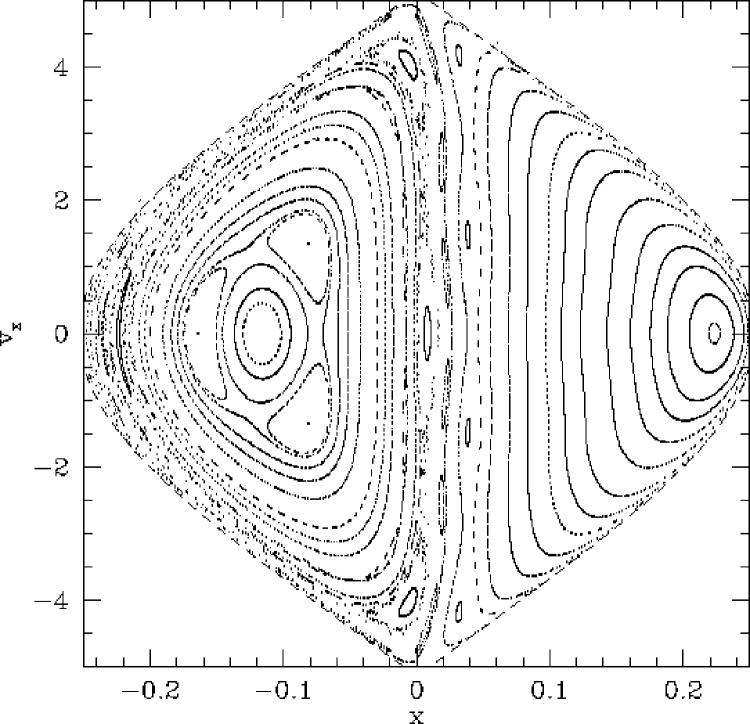
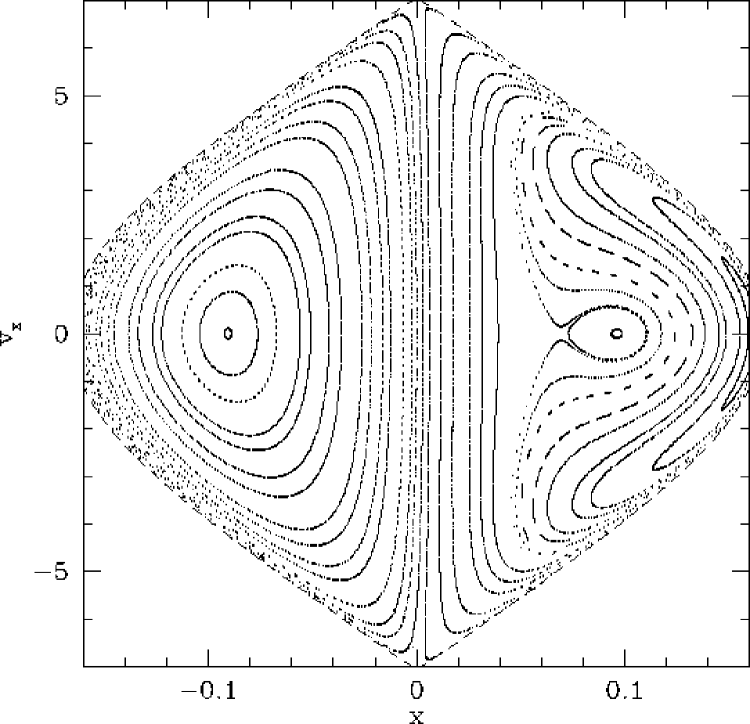
To examine the effects of different disk masses , Models 3 and 4 include disks with a of 5.0 and 2.5, respectively. In contrast to models 1 and 2, is placed at in both cases.
The main difference between the two models is the presence of a periodic -orbit in model 4 at (Fig. 10), surrounded by s. Those orbits are completely missing in the corresponding Surface of Section of model 3 at comparable -values. Model 3 produces -orbits only in the very center of NGC 2336. This fact is illustrated by the corresponding -rotation curves shown in Fig. 12 which cover a very small region only. Additionally, the closed s of model 3 around the -orbit are surrounded by islands and semi-ergodic regions already at those low energies, a feature that is missing in model 4.
Semi-ergodicity becomes more important when we proceed to higher energies (central and right column in Fig. 10): At , in model 3 the prograde side of the phase space is dominated by a very strong (4:1)-resonance at which is surrounded by large regions of semi-ergodic motions (upper row, central plot). In contrast to this, model 4 (lower row, central plot) exhibits a much weaker (4:1)-resonance at and nearly no semi-ergodic motion at comparable energies (). Even at the highest energy values slightly above (right column), semi-ergodic motion plays a less important role in case of model 4 than in model 3.
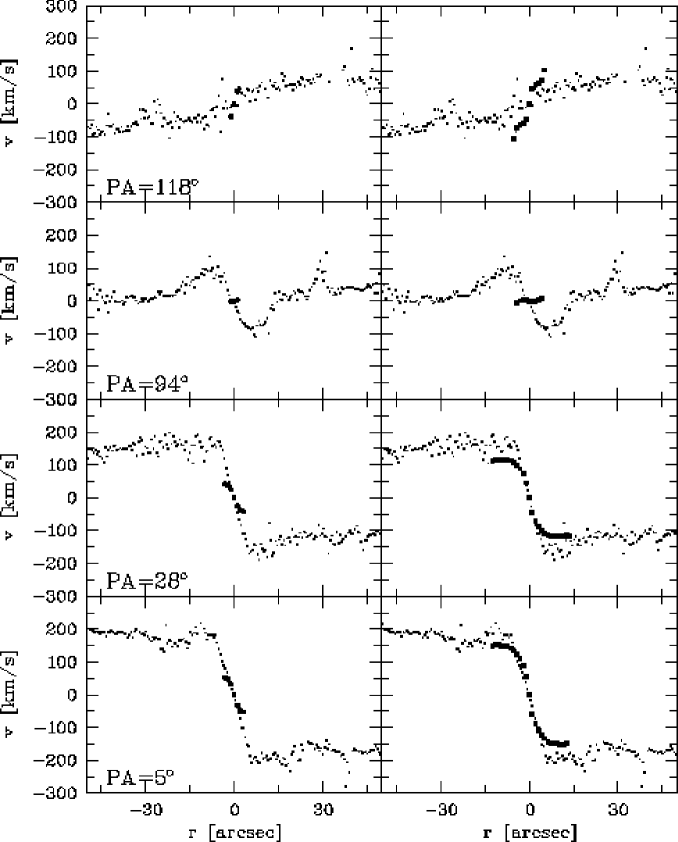
Both models are not able to reproduce the observed kinematics with sufficient accuracy: A of produces -velocities that are much too low for the central -orbits (model 3, Fig. 11, left column). A moderately lower -value of yields a better fit (model 4, Fig. 11, right column, see also the results of the optimal model in Fig. 13 which were obtained with ). In addition, model 3 suffers from the fact that the humps and dips in the observed HII-rotation curves at and are not reproduced to their full extent. This is caused by the large overall disk mass (), with a correspondingly small non-axisymmetric contribution of the bar to the total potential. Therefore, the -orbits supporting the bar structure become less elongated, and the streaming velocities of the HII-clouds along the major axis of the bar are much lower.
However, a simple reduction of with all the other parameters remaining fixed is no solution either, as is quite obvious from the results of model 4 (Fig. 11, right column): With , the central slopes of the rotation curves of this model are too steep due to the increased importance to the non-axisymmetric bar contribution to and to the small bulge scale length . Additionally, the maximum velocities of model 4 exceed the observed ones by km/sec at and . Another feature of model 4 is the strong decline of the rotation curves after reaching the (correct) maximum velocities for a slit orientation of , which is not supported by observations, either.
It can be shown that a slightly larger bulge mass ( instead of ), increasing the mass concentrated in the center of NGC 2336, extends the HII-streaming motions along the bar to larger radii (). At the same time, a larger -value would induce a flatter rise of the velocities in the innermost part of NGC 2336 and reduce the observed humps in model rotation curves at and to the correct height.
Both models produce -orbits, the corresponding rotation curves are also computed and shown in Fig. 12. While model 3 (left column) generates -orbits only in the very central region () of NGC 2336, in model 4 (right column) -orbits are present up to radii of in the case of and . As far as those orbits are present in both models, no significant differences occur between the -rotation curves. However, supporting the results of models 1 and 2, the -orbits of models 3 and 4 cannot explain the kinematics of the inner regions of NGC 2336, which is clearly visible for a slit position of .
To summarize, large -values lead to an increased axisymmetric potential component, therefore the bar becomes less important. The consequences of the massive disk in model 3 are -streaming velocities that are in general too low by far to reproduce the observed velocity field. We draw the conclusion that a final model of NGC 2336 should use a . The necessary adjustment of the mass distribution in the central region could then be achieved by varying other parameters, e.g. the bulge mass, which was chosen especially low for the models 3 and 4. The slope of the rotation curves could be adjusted by varying , the streaming velocities by lowering .
9.3 Variation of the bar pattern speed
In contrast to the parameters resulting from the morphological decomposition (e.g. component masses and scale lengths), cannot be observed directly. Therefore a sequence of identical models with different -values is examined. In general, all models produce similar velocity fields. Major differences occur only for a slit orientation of , where models with lower predict significantly larger humps in the rotation curves. This is a consequence of the fact that the rotation curves result from the -streaming velocities – which are identical for all models – subtracted by the various -values. In contrast to that, the other slit orientations show only minor deviations. Obviously, variations of are an appropriate tool to adjust the velocities perpendicular to the bar major axis.
Upper and lower limits for are given by the following arguments: Since must be located outside the bar, must not exceed a certain value, depending on the mass distribution in the model. This leads to an upper limit for . Estimating the lower limit is more complicated since the height of the humps in the rotation curves is not exclusively determined by , but is also influenced by several other model parameters.
Examples for this mutual influence of several parameters are the cases of models 1 and 2: Numerical N-body-simulations of barred galaxies strongly suggest that the of intermediate type galaxies (e.g. NGC 2336) normally is located at . In models 1 and 2 (Section 9.1), is placed at the end of the bar at , which in fact is the lower boundary for . Even for the more realistic model 1 with the lower bar mass, the HII-velocities are still too small. Therefore, if we reduce of model 1 to a value shifting Corotation to , the velocity humps of the -rotation curve increase towards values that are in much better agreement with the observations.
10 The Optimal Model for NGC 2336
In the last Section we used models with different bar masses (1 and 2) and different disk masses (3 and 4) to illustrate the qualitative and quantitative changes in the division of the phase space and the HII-kinematics which are caused by the variation of and . The effect of -variations was described as well. But as was discussed in the beginning of Section 9, there are many more parameters which may induce changes in the predicted kinematics, e.g. the scale lengths of disk, bulge and bar, , , and . The results of the studies of changes in the latter parameters, as well as the results of the models 1-4, can be summarized in the following constraints applying to the construction of the final NGC 2336-model:
-
1.
Since changing the vertical flattening of the bulge, , results in minor changes in the HII-rotation curves only, is chosen for the optimal model, which is well in agreement with the photometric observations.
-
2.
The examination of models with different offset angles between the bar and the shows that a deviation of a few degrees () leads to small changes in the model gas kinematics that tend to change the rotation curves in the same way as do variations of the bar axis ratio . Since the morphological decomposition of NGC 2336 suggests as the most probable number and since a good fit to the observed velocity field can be achieved with this value, will be used for the final model.
-
3.
Models with being varied support those values that place at . Placing outside the bar in an interval is supported by results from numerical studies (cf. Athanassoula athanassoula (1992) and references herein).
-
4.
A bar- of is in good agreement with the kinematic requirements and the observations as well.
-
5.
The bar mass-to-light ratio should not exceed .
-
6.
Due to the difficulties in determining the bulge scale length, , this parameter cannot be determined exactly from observations. The results of the wide range of models examined suggests that should lie within (kpc).
-
7.
The photometrically derived bulge mass () is a reasonably good choice.
-
8.
The observed disk scale length of (kpc, unchanged in all models) agrees well with the requirements of the rotation curves, assumed that all other parameters are precisely adjusted as well.
-
9.
With unchanged, a small disk mass (i.e. ) seems to be a plausible choice when one tries to fit the model rotation curves to the observed kinematics in the outer disk regions at via adjusting the cloud speeds on the -orbits beyond .
-
10.
In order to adjust the height of the overshootings in the rotation curves for a slit orientation and to place at , the pattern speed has to take low values km/sec/kpc.
The final model was optimized by studying 32 parameter variations with total number of closed orbits. Finally, the best results were obtained with the parameter set listed in Table 8.
| bar | |
|---|---|
| [LU/kpc] | |
| [LU/kpc] | |
| [] | |
| 1.5 | |
| bulge | |
| [LU/kpc] | |
| [] | |
| 1.0 | |
| disk | |
| [LU/kpc] | |
| [] | |
| 2.5 | |
| [km/sec/kpc] | |
The total mass of the final model was calibrated according to equation 28 and equation 29 with the outer circular velocity value from the kinematical observations. We obtain a total mass of . If we identify for a rough estimate the relative mass-to-light-ratios and with the normal astrophysical values, we obtain from our optimal model:
| (32) | |||||
| (33) | |||||
| (34) |
Thus we have a bulge/disk ratio of and a bar/disk ratio of . One should keep in mind that especially the disk mass contains a certain contribution of dark matter which can not be separated within the framework of this paper.
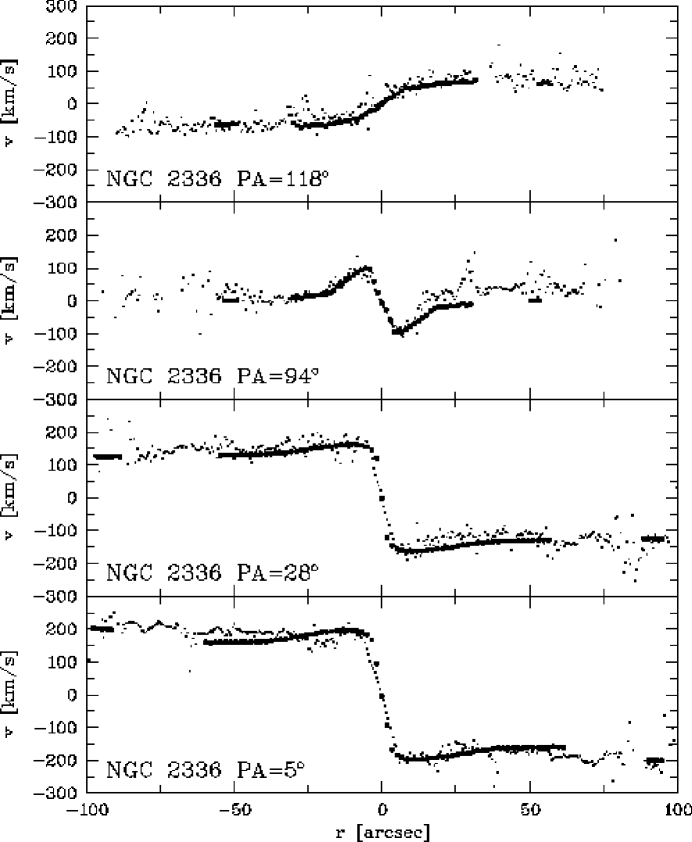
Looking at the artificial rotation curves in Fig. 13 one recognizes the excellent agreement between the artificial curves and the observed ones. Not only does the optimal model produce the correct maximum rotational velocities of the slit orientations and , but also traces the overshootings of the -rotation curve correctly. The positions of the velocity maxima and minima in the model rotation curves and the observed ones are identical. The theoretical rotation curves in Fig. 13 display gaps in the vicinity of , since the orbit integrator can not compute orbits near the Lindblad resonances.
Small discrepancies that remain between observation and theory are the central parts of the rotation curves for and , where the theoretical slopes rise slightly faster than the observed ones.
11 Discussion
11.1 Morphological Decomposition
The morphological decomposition of the -band image of NGC 2336 seems well established, since nearly all parameters that were initially derived from the multi-component 2D model of the -band surface brightness distribution appear in the final model with the same numerical values. There are justified exceptions, e.g. the bulge scale length , where the limited spatial resolution of the images and the small area covered by the bulge component prevent us from a more precise determination. The moderate increase of the final value of – compared to the morphological decomposition – nevertheless agrees well with observations. It is also remarkable that the bar- determined from observations is nearly the same as that used for the optimal model. This is not self-evident, as the inclined position of the bar in the sky makes the determination of the deprojected bar- difficult.
Uncertainties of the model parameters become large wherever the spatial resolution or the area of the -detector is concerned: The determination of the bulge scale length is certainly precise to a level only, due to the small bulge area (i.e. , the small number of pixels) and the residuals remaining after the subtraction of the bulge and disk components. For the disk, similar uncertainties are introduced by the limited size of the detector chip which omits the outer parts of the disk, leading to an uncertainty in of . The luminous masses of disk, bulge, and bar can be determined more precisely, especially the contribution of the bar is uncertain by only, since the very regular disk structure ensures a reliable decomposition. For the photometrically derived values of and , a precision of seems a realistic estimate, due to the reasons discussed above.
The deprojection angles , , and are reliably determined with an error of at most, since otherwise a mismatch between the observed kinematics and that of the optimal NGC 2336-model would occur in at least one slit orientation. Obviously this is not the case.
11.2 Analysis of Phase Space
From the -analysis we conclude that the best NGC 2336-models show a phase space partition characteristic for barred galaxies with a bar contributing roughly to the total potential: For all realistic parameter sets, an is produced together with -orbits that dominate the motion in the innermost parts of the NGC 2336-models at low -values.
For energy values , the -orbits disappear, only the prograde - and the retrograde -family remain. In the vicinity of , the -family dissolves and is replaced by higher resonances, e.g. the (4:1)- and the (6:1)-family. The (4:1)-resonance ist not very strong, so we conclude that in time dependent models the stellar bar of NGC 2336 would be moderately box-shaped only. The small amount of semi-ergodicity leads to the conclusion that a time-dependent model with our optimal parameter set would be secularly stable on time scales of the bar rotation period.
Summarizing the results of phase space analysis, the optimal model for NGC 2336 exhibits the typical behaviour of disk-dominated barred galaxies with the bar- and being moderately small.
11.3 Rotation curves
In our studies, special emphasis was put on the reproduction of the gas kinematics in those regions influenced by the bar, i.e. the large streaming motions of HII-clouds orbiting on -orbits around the center of NGC 2336. However, the overall kinematics with the observed rotational velocities in the outer regions of the disk had to be described correctly as well. Our final model fulfills both requirements, as is obvious from the excellent agreement between observed and artificial rotation curves in every part of NGC 2336 and for every slit orientation.
Moreover, the success of adjusting the outer parts of the model rotation curves is an evidence for the good deprojection performed here. Otherwise the final velocities in the outer disk regions could not be fitted simultaneously for all slit directions.
In general, all characteristic features of all velocity curves are traced well by the final model, especially the overshootings that can be observed in slit orientations of , and , are produced by the model to full extent. Small differences between observed and artificial gas velocities remain in the innermost region of NGC 2336 and are probably caused by the uncertainties in the bulge scale length due to possible errors in the morphological decomposition. The precise determination of the latter is difficult due to the limited spatial resolution of the -detector and the small area covered by the bulge component.
From the observational point of view there is no necessity for including -orbits in the final sets of closed orbits, because a perfect fit to the observed kinematics is already achieved by -orbits alone. Moreover, the possibility of -orbits contributing significantly to the HII-kinematics in the inner part of the bar are definitely ruled out, since no model with -orbits can account for the streaming velocities measured at a slit orientation of . Though our final model produces a moderately strong and therefore numerous -orbits, this is no contradiction to their uselessness in the case of NGC 2336, because our model does not make any statements with regard to the occupation number of single orbit families.
To correct for the presence of dark matter in the outer regions of NGC 2336, moderate corrections of the conversion factors and had to be applied in order (i) to produce the large streaming velocities along and (ii) to normalize the circular -velocities in the outer disk regions: changed from the observationally determined value of to , while the visible bar mass () had to be increased by only . The value is a further hint at a reliable morphological decomposition: For the bar component which is not strongly affected by a possible dark matter halo, a moderate increase of the - seems plausible, especially when considering possible stellar population changes between bulge and bar that are not known in detail.
Summarizing the results of our kinematical analysis, the final NGC 2336 model rotation curves are a very good representation of the observed velocity field. Obviously, there is no necessity of including additional hydrodynamical or magnetical effects in order to explain the observed kinematics. It is also remarkable that these results can be achieved based on models that neglect spiral arms and an explicit dark halo component with independent scale length.
12 Summary
In this paper, 2D models of the observed -band luminosity of NGC 2336 were constructed by fitting a disk, a bulge, and a bar to the observed surface brightness distribution. The resulting model was deprojected and converted to an underlying mass distribution. The total 2D potential, , was obtained by numerical expansions of the potential of the single components and coadding them. For the examination of test particle motions in the potential of NGC 2336, we used a numerical orbit integrator, in which and its derivatives are implemented. The time-dependent motions of single HII-clouds are traced by a grid-based integration scheme, in which particles move on arbitrary orbits in the stationary potential of the rotating bar.
The resulting partition of the phase space was examined by analysing the appropriate cuts through phase space at a given energy, the Poincaré Surfaces of Section. They provided us with the start values – coordinates and velocities – of the main orbit families constituting the bar. Given those initial values, complete sets of closed orbits in a certain energy range were computed and projected to the sky. Using a virtual longslit in various orientations, artificial rotation curves were constructed and compared to the observed kinematics of the HII-gas.
In a further step, the effects of parameter variation on the division of phase space and the predicted HII-rotation curves of numerous NGC 2336-models were examined. The effects of varied - and -values were shown here in greater detail, while the effects of all other free parameters being changed and studied are described qualitatively. The models led to narrow limits for the parameter values of an optimal model which should (i) reproduce the observed HII-kinematics directly and (ii) use the parameter values directly obtained from the morphological decomposition procedure wherever possible.
From the final NGC 2336-model, the following results are obtained:
-
1.
The model parameter values obtained from observations and those needed for an optimal fit of the HII-kinematics are identical (with justified exceptions), therefore the aim of constructing a consistent NGC 2336-model is achieved.
-
2.
The overall quality of the morphological decomposition model is sufficiently good to produce a realistic mass model of NGC 2336. Nevertheless, to check whether the kinematically supported scale length values of bulge and disk are fully consistent with the more uncertain morphological ones, we would need -data with (i) a better spatial resolution and (ii) larger areas covered by the detector chip. With the small pixel number and the comparably large pixel size of the -detector, the determination of and especially remains crucial.
-
3.
The phase space of all acceptable models, especially the optimal one, exhibits a structure which is typical for a disk-dominated galaxy with a bar roughly contributing to the total potential, i.e. small amounts of semi-ergodicity as well as the presence of the -, - and -family of periodic orbits.
-
4.
-orbits can definitely be excluded when one tries to fit the observed velocities within the bar, since the streaming velocities produced by them are by far too low.
-
5.
The optimal model favours a low pattern speed (km/sec/kpc), a small bar axis ratio () and – compared with the luminous matter – moderately increased bar and disk masses due to the presence of dark matter (, ).
-
6.
An excellent agreement between the observed and the artificial rotation curves is achieved, the optimal NGC 2336-model describes correctly the large streaming motions of the HII-clouds along the bar as well as the rotation velocities in the outer regions of the disk.
-
7.
In general, the case of NGC 2336 shows that the peculiar HII-kinematics of a strongly barred galaxy can be completely explained by consistent stationary models which are constructed from observationally derived parameter sets.
Acknowledgements.
The authors want to thank R. Bender (Universitätssternwarte München) for providing the software for the Fourier quotient correlation analysis of the stellar spectra, FCQ4. We also acknowledge the help of J. Heidt with the data reduction. This work has been supported by the DFG Sonderforschungsbereich 328.References
- (1) Athanassoula, E., 1992, MNRAS 259, 345
- (2) Bender, R., 1990, A&A 229, 441
- (3) Binney, J., Tremaine, S., 1987, Galactic Dynamics, Princeton University Press
- (4) Combes, F., 1994, in: The Formation of Galaxies, Muñoz-Tuñon C. (ed.),5th Canary Island Winter School
- (5) Contopoulos, G., Papayannopoulos, Th., 1980, A&A 92, 33
- (6) Dehnen, W., 1993, MNRAS 265, 250
- (7) de Vaucouleurs, G., 1948, ARA&A 11, 247
- (8) Ferrers, N.M., 1877, QJPAM 14, 1
- (9) Frogel, J.A., Quillen, A.C., Pogge, R.W., 1996, in: New Extragalactic Perspectives in New South Africa, D.Block (ed.), Kluwer, Dordrecht, 65
- (10) Goldstein, H., 1981, Classical Mechanics, Addison-Wesley Publishing Company, 145
- (11) Hernquist, L., 1990, ApJ 356, 359
- (12) Jaffe, W., 1983, MNRAS 202, 995
- (13) Martin, P., 1995, AJ 109, 2428
- (14) Matthias, M., 1993, diploma thesis, University of Heidelberg
- (15) Salucci, P., Ashman, K., Persic, M., 1991, ApJ 379, 89
- (16) Sellwood, J.A., Wilkinson, A., 1992, Reports on Progress in Physics
- (17) Toomre, A., 1962, ApJ 138, 385
- (18) Tully, R., B., 1988, Nearby Galaxies Catalogue, Cambridge University Press
- (19) van Moorsel, G.A., 1983, A&AS 54, 19