X-ray study of the NGC 383 group of galaxies
and the source 1E 0104+3153
Abstract
We present results from an analysis of the X-ray properties of the NGC 383 galaxy group based on ROSAT PSPC and HRI data. X-ray emission can be traced out to Mpc, the estimated virial radius of the system. We determine a total mass of M⊙ for the group inside this radius with a gas mass fraction of 21%. The intragroup gas temperature of keV is both consistent with the galaxy velocity dispersion and the X-ray luminosity - temperature relation of groups and clusters suggesting that the group is fairly relaxed. This is also indicated by the almost spherically symmetric appearance of the group’s X-ray halo.
The X-ray properties of the radio galaxy NGC 383 (3C 31) which is located near the center of the group are discussed. Its spectrum is best described by a two-component model, consisting of emission from a low-temperature Raymond-Smith plasma, and a hard tail. The emission from NGC 383 is not resolved by the ROSAT HRI. The possible interaction of the radio jets of 3C 31 with the IGM is studied.
A spatial, spectral and temporal analysis of the Einstein source 1E0104+3153 located within the field of view is performed, one goal being the identification of the optical counterpart (with both, a high-redshift BAL quasar and a nearby elliptical galaxy, member of a small group, located within the Einstein X-ray error circle). We find evidence that the IGM of the small group contributes significantly to the X-ray emission of 1E0104, which can be described by a Raymond-Smith model of 2 keV and a soft X-ray luminosity of erg/s.
Key Words.:
X-rays: galaxies, clusters – Galaxies: elliptical and lenticular – Galaxies: individual: NGC 383=3C 31, 1E 0104+3153 – Galaxies: clusters: individual: NGC 383 group – dark matterskomossa@xray.mpe.mpg.de
1 Introduction
NGC 383, of type S0 (Arp 1968), is a member of a bright chain of galaxies (Arp 1966, Arp & Bertola 1971, Kormendy & Bahcall 1974), which itself belongs to a group of galaxies (Zwicky et al. 1961) located within the Perseus-Pisces filament. NGC 383 is at redshift =0.017 and has a companion galaxy in 33″ distance.
NGC 383 is a moderately bright radio galaxy (3C 31) and has been extensively studied at radio wavelengths in the past (e.g., Macdonald et al. 1968, Burch 1977,1979, Klein & Wielebinski 1979, Fomalont et al. 1980, Ekers et al. 1981, van Breugel 1982, Strom et al. 1983, Condon et al. 1991, Andernach et al. 1992, Artyukh et al. 1994, Lara et al. 1997, Henkel et al. 1998). It shows a symmetric edge darkened double-source structure with two strong jets. The origin of the structures seen in the radio morphology of dominant cluster/group members is still not well understood. The structures of the jets of NGC 383 were interpreted by Blandford & Icke (1978) as due to tidal interaction with the companion galaxy NGC 382. However, Fraix-Burnet et al. (1991) found no evidence for interaction between the two galaxies. Further jet models were presented by Bridle et al. (1980) and Bicknell (1984). Whereas Butcher et al. (1980) reported evidence for a detection of the jet at optical wavelengths, this was not confirmed by later studies (Keel 1988, Owen et al. 1990, Fraix-Burnet et al. 1991).
The optical spectrum of the nucleus is characterized by emission lines. The optical emission was found to be extended, and in form of a rotating disk (Owen et al. 1990) or ring (Fraix-Burnet et al. 1991) that coincides with a dust-ring reported by Butcher et al. (1980). The emission line ratios in the disk were found to be similar to those at the nucleus and Owen et al. concluded that the disk ionization is probably driven by the nucleus.
NGC 383 is the brightest member of a rich group of galaxies. The group is included in the Zwicky catalogue; membership studies based on velocity measurements were performed by Moss & Dickens (1977), Garcia (1993), Sakai et al. (1994), and Ledlow et al. (1996), who included 25, 22, 16, 32 member galaxies, respectively. Among the 27 groups studied, Ledlow et al. found the galaxy velocity distribution to significantly deviate from a Gaussian in 55% of them; the NGC 383 group was not among those. Sakai et al., using a standard estimator as in Heisler et al. (1985), derived a virial mass of = 0.2 1014 , and a mass-light ratio = 240. Extended X-ray emission from the group was first detected by Einstein (Fabbiano et al. 1984). The data were analyzed by Morganti et al. (1988) in the course of a large sample study of the effect of gas pressure on radio sources.
To perform a detailed spatial and spectral analysis of the X-ray emission from NGC 383, the intra-group medium (IGM), and an investigation of the relation with the radio jet, a ROSAT PSPC observation was applied for. These data presented here have been previously partly analyzed by Trussoni et al. (1997; T97 hereafter) in a study of hot coronae in nearby radio galaxies. Here, we extent their analysis and focus on the properties of the IGM and the NGC 383 group as a whole, in particular, the determination of gas and total mass; and the nature of the X-ray emission from NGC 383. We also briefly discuss new HRI data which were retrieved from the archive.
Also located in the field of view is the high-redshift (=2.027) BAL quasar QSO 0104+3153. X-ray emission from the direction of this quasar was discovered in the Einstein Medium Sensitivity Survey (Stocke et al. 1984). The QSO, and a nearby (10″) giant elliptical galaxy, member of a small group, were identified as possible counterparts of the X-ray emission. Due to its proximity to the elliptical, the quasar is considered as prime candidate for lensing by halo stars. Optical variability of 0.5m was detected by Gioia et al. (1986). The ROSAT PSPC spectrum was briefly discussed in a large sample study by Ciliegi & Maccacaro (1996). The identification of the source (QSO, elliptical galaxy or IGM of the small group) remained unclear. Here, we perform a detailed study of the properties of this X-ray source and address the counterpart question on the basis of (i) long- and short-term variability behaviour, (ii) X-ray spectral shape, (iii) improved spatial position obtained with the HRI.
Physical parameters are calculated for = 50 km/s/Mpc, = 0.5 and assuming the galaxies/group to follow the Hubble flow. For the distance of the NGC 383 group, 1″ corresponds to a scale of 0.5 kpc.
2 X-ray data
2.1 PSPC
The group was the target of a pointed ROSAT PSPC (Trümper 1983; Pfeffermann et al. 1987) observation with NGC 383 in the center of the field of view. Our observation was performed from July 28 – 29, 1991 with a duration of 27.5 ksec. The satellite was not in wobble mode during this observation.
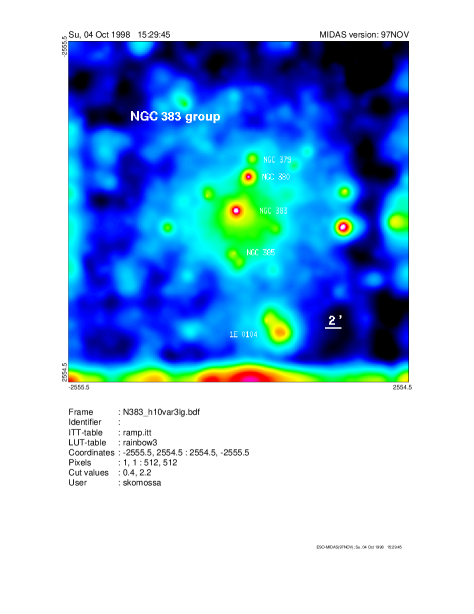
The background was usually determined in a source-free ring around the target source (for details see below). The data were corrected for vignetting and dead-time, using the EXSAS software package (Zimmermann et al. 1994). Widely extended X-ray emission is present (Fig. 1). The central region appears roughly circularly symmetric. Emission from the group can be traced out to a distance of 33′ radius ( 1 Mpc). The total countrate (channels 52–201) within this region is 0.58 cts/s. Several group ellipticals are individually detected, the brightest with countrates of 0.024 cts/s (NGC 383), 0.0058 cts/s (NGC 379), 0.0124 cts/s (NGC 380), 0.0041 cts/s (NGC 385), and 0.0021 cts/s (NGC 384) as summarized in Table 2. X-ray emission from the direction of 1E 0104 is detected with 0.028 cts/s.
To carry out the spectral analysis of the individual sources, photons in the amplitude channels 11-240 were binned according to a constant signal/noise ratio of 5.
Results given below refer to the PSPC data if not mentioned otherwise.
2.2 HRI
An HRI observation centered on NGC 383 was performed between July 11 and 25, 1994 with a duration of 25.0 ksec. The data were retrieved from the archive. (An earlier HRI observation, of Jan. 1992 with 2.8 ksec duration, is briefly discussed in T97.) Due to the lower sensitivity of the HRI, essentially only the bright point-like sources are detected. These data are analyzed mainly to study the spatial structure of the X-ray emission from the bright group galaxies, and to search for variability in individual sources.
3 Group analysis
3.1 Spectral properties
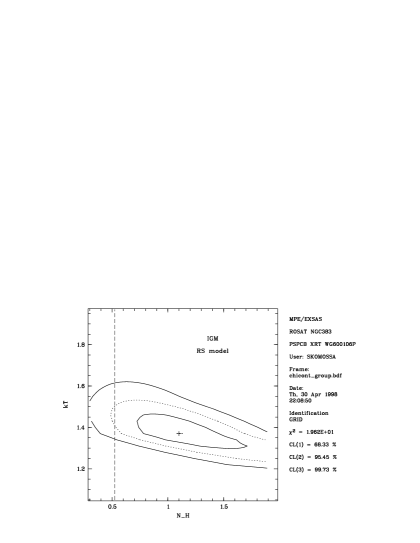
A Raymond-Smith (rs) model was fit to the extended X-ray emission. If not noted otherwise, abundances were fixed to 0.35solar (Anders & Grevesse 1989). In a first step, the group photons within a circular region of radius 1000″ were selected; in a second step, this region was split into an inner circle (radius 200″), an intermediate ring (200″ out to 500″) and an outer ring (500″ to 1000″). Point-like sources were removed. To this end, we first carried out a source detection using the EXSAS software. This resulted in about 35 sources detected within the total field of view. For the brightest sources, extents were then determined by inspecting the radial source profiles (the radius where the source profile merges with the local background taken as source extent) and by comparison with the profile expected from the PSF of the detector (for a more detailed discussion of NGC 383 see Sect. 4.1.2). This resulted in source extraction radii of 100″ for the brightest central sources. The detected sources were then removed within circular regions centered on their X-ray positions. As background we selected a source-free circular region in the outer part of the fov. Since the spectrum below 0.5 keV is strongly dominated by background, we usually excluded photons below this energy from the spectral fit. Treating the cold absorption as free parameter always resulted in a value (nearly) consistent with the Galactic absorption towards NGC 383 ( cm-3, Dickey & Lockman 1990) within the errors. We therefore fixed = .
For the total emission within 1000″ we find a temperature = 1.5 keV. The temperature values derived for the three separate regions are consistent with this value and with each other within the errors (Table 1). This value of is somewhat lower than the one given in Morganti et al. (1988; their Tab. 2) on the basis of an Einstein IPC observation; they estimate 3 keV. To check the robustness of the obtained temperature, we performed a few tests: If we do not remove the point sources and re-fit the total spectrum we get = 1.4 keV; if we fit a thermal bremsstrahlung model we obtain = 1.4 keV; if an rs plasma with solar instead of depleted abundances is assumed, the quality of the fit slightly improves without affecting the value of the temperature within the errors and we derive = 1.6 keV. T97 obtain = 1.5 keV for abundances of 0.35solar. Results of our spectral fits are summarized in Table 1.
Using = 1.5 keV and , the total (0.1–2.4 keV) luminosity within 33′ is erg/s (= 1.3 1043 erg/s if the abundances are fixed to the solar value).
3.2 Spatial analysis
All bright ellipticals of the optical chain Arp 331 are individually detected in X-rays. The center of the X-ray emission maximum from NGC 383 at = 1h7m25.9, = 32°24′445 (J 2000) coincides well with the position of the optical nucleus at = 1h7m25.0, = 32°24′448. For an overlay of the PSPC X-ray contours on an optical image of the NGC 383 group see T97 (their Fig. 1).
To derive physical properties of the group, we first assume spherical symmetry of the extended X-ray emission, the emission to be centered on NGC 383, and rough isothermality to hold. For critical comments on and justification of ‘standard’ assumptions see, e.g., Böhringer et al. 1998 (their Sects. 2, 3). A -model (e.g., Cavaliere & Fusco-Femiano 1976, Gorenstein et al. 1978, Jones & Forman 1984) of the form
| (1) |
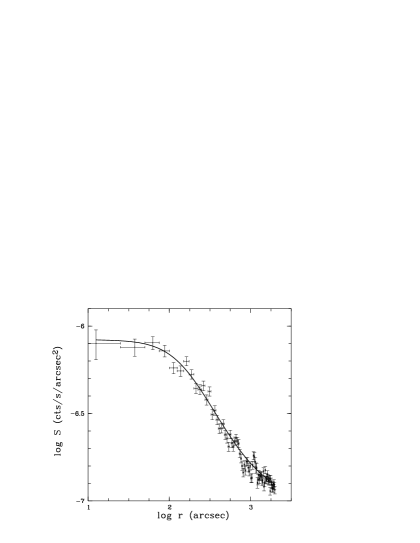
was fit to the azimuthally averaged surface brightness profile of the PSPC observation (detected point sources were, again, removed except emission from NGC 383, inner bins were then excluded from the fit since they are dominated by emission from NGC 383 itself). This yields a central surface brightness cts/s/arcmin2, a slope parameter = 0.34 and a core radius = 64 kpc. The gas mass enclosed inside 1 Mpc amounts to = 1.5 1013 M⊙. Inspection of Fig. 1 shows that NGC 383 is not located perfectly in the center of the large scale X-ray emission, but offset by about 1′ to the North-East. In fact, using the best-fit beta-model to construct a synthetic model image and subtracting the model image from the observed one leaves some residual extended emission to the SW and some ‘negative’ emission levels to the NE.
Therefore, in a second step, the surface brightness profile was centered at = 1h7m22.8, = 32°23′457 and re-fit after emission from NGC 383 was removed within a segment. In this case, we obtain cts/s/arcmin2, , and kpc (errors are 1). The only slight change of the fit parameters underlines the robustness of the fit. The beta-model fit to the surface brightness profile is shown in Fig. 2. Again constructing a model image and subtracting this from the observed one now does not show any residual emission except the point-like sources. This model is also used for the gas and total mass estimate below.
These results differ from the previous analysis of T97 in yielding a smaller core radius (they derived = 230 kpc) and shallower slope (they found = 0.6) for the data presented here. We have checked that our results are robust ( varying between 0.3 and 0.45 in extreme cases) against non-removal of individual sources (up to all), shifts of the central position, and to systematic exclusion of individual bins (e.g., the inner or outer ones) before fitting the surface brightness profile. Our best fit leads to a larger ratio of gas to total mass at large radii. It also has consequences when comparing the pressure of the IGM with the non-thermal pressure of the radio jet (Sect. 5.1.3).
3.3 Mass determination
For the beta-modell applied in the previous section, the gas density distribution is given by
| (2) |
This implies a central density = 1.3 10-3 cm-3 and a gas mass within 1 Mpc of = 1.3 1013 M⊙.
Assuming spherical symmetry and the group to be approximately in hydrostatic equilibrium, the total gravitating mass follows the relation
| (3) |
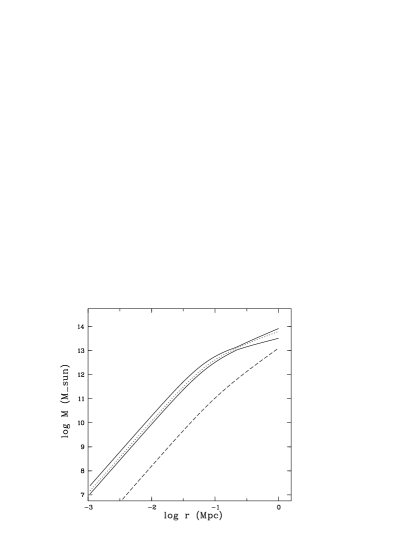
With the observed parameters this results in an integrated total mass of = 6.3 1013 M⊙ within 1 Mpc radius and a gas mass fraction of 21%. Using instead the galaxy velocity dispersion as derived from optical observations, = 466 km/s (Ledlow et al. 1996; see also Sakai et al. 1994), and a core radius of 73 kpc we get a mass of 7 1013 M⊙ within 1 Mpc, which is well consistent with the value obtained purely from the X-ray data.
The profile of total and gas mass is displayed in Fig. 3. Errors on the mass are obtained from the temperature range allowed by the X-ray spectral analysis, = 1.5 keV, and a temperature profile for a family of models with polytropic index in the range 0.9 – 1.3. In the polytropic models the nominal temperature is fixed at the core radius.
3.4 Radio – X-ray morphology
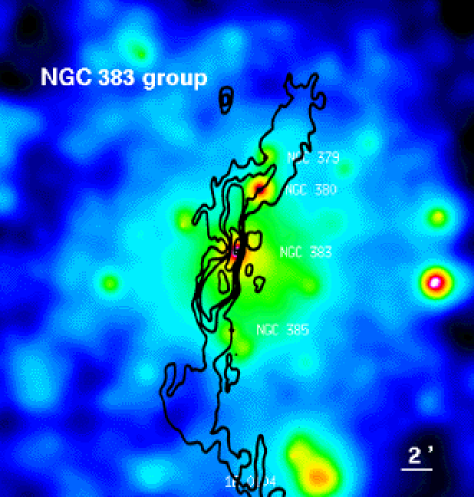
There are some spectacular examples of pressure interaction between the radio and X-ray gas in clusters of galaxies (e.g., Böhringer et al. 1993, 1995, Harris et al. 1994, Clarke et al. 1997, Otani et al. 1998). In the present case, we do not find conspicuous morphological correlations between radio- and X-ray emission (Fig. 4). This may be partly due to the narrowness of the jet, the still limited spatial resolution of the ROSAT PSPC, and the 2D view of the 3D source structure.
Changes of the jet orientation angle near the locations of some optical chain galaxies, now also detected as strong X-ray sources, were already noted by Strom et al. (1983).
4 Individual sources
4.1 NGC 383 = 3C 31
4.1.1 Spectral analysis
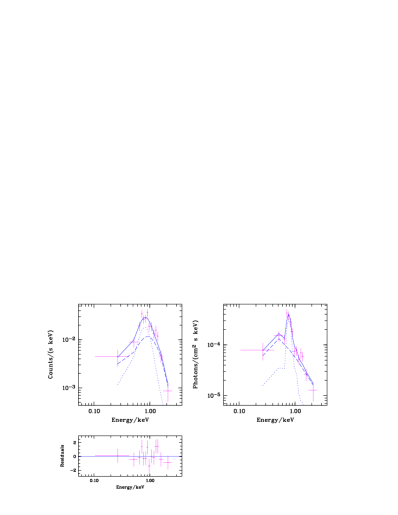
As background we chose (i) a source-free ring around the target source, and (ii) a source-free circular region near the target source. This allows to check for sensitivity against the background correction. All majour fits were repeated for both background geometries. Further, we note that the source emission in the first bin (below 0.4 keV) is weak. We repeated all fits after having removed the first bin from the spectrum. In all cases, the results presented below are found to be robust.
First, several single component models were fit to the X-ray
spectrum, starting with a powerlaw (pl).
Although this model
fits the X-ray spectrum ( = 1.3),
the derived parameters
are unusual. The slope is extremely steep –5, and there is evidence
for strong excess absorption (about 8 times the Galactic value).
A single steep pl may be mimicked by a flat pl plus soft excess.
Parameterizing the excess as black body and fixing =–1.9, we do not
find a successful fit. This also holds for a single pl in which absorption
is fixed to the Galactic value ( = 3.3).
A single rs model with metal abundances of 0.35 solar
does not give an acceptable fit, either ( = 2.4).
Lowering the abundances up to 0.1 solar
yields an acceptable fit (see also T97), but such low abundances are unexpected
for dominant group galaxies111E.g., Fabbiano et al. (1994)
find that assuming typical stellar mass loss rates,
originally primordial
gas would be 10% metal-enriched after 107 yr;
see also Sarazin (1997).
For a recent thorough discussion of the issue of single- models
of very subsolar abundances vs. two-component models of solar abundances
see also Buote & Fabian (1998)..
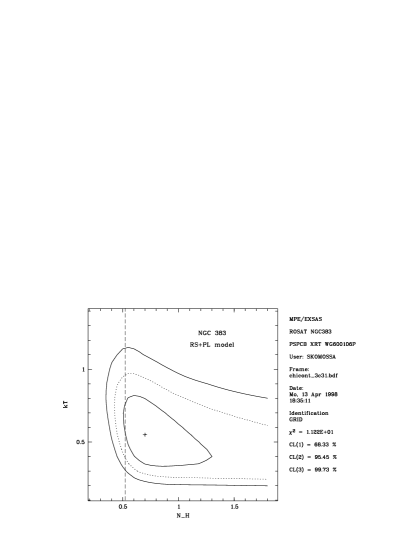
In a second step, two-component models consisting of contributions from both, a rs plasma and a pl source, or two rs sources were applied. In the rs+pl description, the pl index was fixed to =–1.9 (the value typically observed in Sy; since we want to specifically test for the presence of an AGN). This provides a good fit ( = 1.1). If is treated as additional free parameter, it is found to be of the order of the Galactic value. For the rs component, we obtain 0.6 keV (error contours are displayed in Fig. 7). The pl component contributes with a (0.1–2.4 keV) luminosity of erg/s, the total (0.1–2.4 keV) luminosity is erg/s (for fixed to ). Alternatively, the spectrum can be fit with a double rs model. In this case we find the hotter component to be ill-constrained. If we fix = 1.5 keV, we get = 0.4 keV ( = 1.1; we used ) and luminosities of erg/s, erg/s. For comparison, if = 5 keV is chosen, = 0.5 keV ( = 1.0) and erg/s, erg/s. The results of the spectral fits are summarized in Table 1.
| model | ||||||
| 1021 cm-2 | keV | x solar | ||||
| NGC 383 | pl | 4.4 | – | – | 1.38 (11) | |
| pl | 0.5232 | – | – | 3.25 (12) | ||
| rs | 0.43 | – | 1.14 | 0.353 | 2.42 (11) | |
| rs | 0.59 | – | 0.98 | 0.103 | 1.50 (11) | |
| rs+pl | 0.69 | 0.55 | 0.353 | 1.12 (10) | ||
| rs+pl | 0.5232 | 0.67 | 0.353 | 1.18 (11) | ||
| rs+rs | 0.5232 | – | 0.5/55 | 0.353 | 1.02 (11) | |
| rs+rs | 0.5232 | – | 0.4/55 | 1.003 | 1.01 (11) | |
| NGC 380 | pl | 0.5232 | – | – | 5.58 ( 7) | |
| rs | 0.5232 | – | 0.92 | 0.353 | 0.84 ( 7) | |
| NGC 379 | pl | 0.5232 | – | – | 3.38 ( 4) | |
| rs | 0.5232 | – | 0.50 | 0.353 | 1.03 ( 4) | |
| IGM | rs; total | 0.5232 | – | 1.46 | 0.353 | 1.14 (22) |
| rs; total | 0.5232 | – | 1.56 | 1.003 | 0.73 (22) | |
| rs; inn. | 0.5232 | – | 1.48 | 0.353 | 1.43 (18) | |
| rs; mid. | 0.5232 | – | 1.56 | 0.353 | 1.79 (19) | |
| rs; out. | 0.5232 | – | 1.37 | 0.353 | 1.42 (14) |
(2) fixed to the Galactic value; (3) fixed; (5) temperature of second
rs component, fixed
4.1.2 Spatial analysis
The X-ray emission from the direction of NGC 383 is strongly peaked. To check how much of the emission might arise from a point source we compared the radial source profile with the instrumental point-spread function (PSF). We find that the emission from NGC 383 is not significantly extended beyond the PSF of the PSPC. Thus, the data are consistent with the bulk of the X-ray emission arising from a point source.
Performing a similar analysis for the HRI observation, we find a deviation of the source profile from the HRI PSF. However, similar deviations are found for the (presumably pointlike) F star which is located within the field of view (after taking into account the appropriate off-axis PSF for the star). We conclude that in the present data there is no evidence for source extent.
4.1.3 Temporal analysis
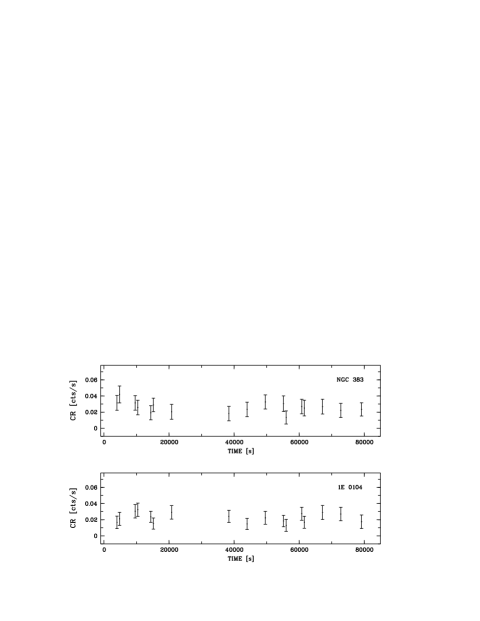
The X-ray lightcurve of NGC 383 is displayed in Fig. 8. An AGN/point-source might reveal itself by variability (but not necessarily). We find a constant source flux within the errors.
4.2 NGC 379, NGC 380, NGC 384, NGC 385
A spectral analysis was performed for the two X-ray brightest galaxies, NGC 379 and NGC 380. A pl model does not provide an acceptable fit ( = 3.4 and 5.6) with residuals strongly indicative of the presence of an rs component. Such a model indeed gives an excellent fit ( = 1.0 and 0.8). We find temperatures of 0.5 keV (NGC 379) and 0.9 keV (NGC 380). The absorption-corrected fluxes for this model description in the (0.1–2.4) keV band are erg/cm2/s (NGC 379) and erg/cm2/s (NGC 380), and the corresponding luminosities erg/s (NGC 379) and erg/s (NGC 380).
To estimate luminosities also for NGC 384 and 385, which are too weak to allow direct spectral fits, we adopted a rs spectrum of 0.5 keV. The derived luminosities are given in Table 2.
| galaxy | ||||
|---|---|---|---|---|
| 10-2 cts/s | keV | erg/s | erg/s | |
| NGC 379 | 0.58 | 0.5 | 1.1 1041 | 3.1 1043 |
| NGC 380 | 1.24 | 0.9 | 2.3 1041 | 4.0 1043 |
| NGC 383 | 2.40 | 0.6+pl | 4.7 1041 | 5.1 1043 |
| NGC 384 | 0.21 | 0.5∗ | 5.0 1040 | 1.8 1043 |
| NGC 385 | 0.41 | 0.5∗ | 7.6 1040 | 2.6 1043 |
(1) either determined directly from spectral fit (Sect. 4.1.1, 4.2) or fixed to 0.5 keV (marked with ‘∗’) in cases where the spectrum could not be fit directly.
4.3 relation
To compare the derived X-ray luminosities with blue luminosities we used the observed blue magnitudes of de Vaucouleur et al. (1991 via NED; see also Smith et al. 1997). For the extinction correction we converted the Galactic as given in Dickey & Lockman (1990) into assuming a standard gas/dust ratio, the relation of Bohlin et al. (1978; see also Predehl & Schmitt 1995), and the extinction curve as given in Osterbrock et al. (1989, his Tab. 7.2). This yields = 0.38m. was then calculated using and assuming the same =0.017 for all galaxies. Results are listed in Table 2.
5 Discussion
5.1 The group
5.1.1 IGM
The NGC 383 group turns out to be the brightest group in X-ray luminosity when compared to the samples of Ponman et al. (1996) and Mulchaey & Zabludoff (1998).
How does it fit into the known relation for groups and clusters of galaxies (e.g., Fabian et al. 1994, White 1996, Ponman et al. 1996, Arnaud & Evrard 1998, Reiprich 1998)? Since is outside the range for which Ponman et al. find a very steep dependence, we use the relation of Markevitch (1998) which predicts a (0.1-2.4 keV) X-ray luminosity erg/s. This agrees well with the observed value of erg/s.
For the given = 1.5 keV, and a galaxy velocity dispersion of = 466 km/s (Ledlow et al. 1996; see also Sakai et al. 1994) we derive .
The low value of the slope parameter derived from the X-ray spatial analysis is in line with earlier findings of a trend of decreasing toward lower (e.g., David et al. 1990, White 1991, Arnaud & Evrard 1998) which is reproduced by models of cluster formation that incorporate galactic winds (e.g., Metzler & Evrard 1997).
Assuming spherical symmetry and isothermality, the total gravitating mass within 1 Mpc amounts to = 0.6 1014 M⊙. We find a gas mass fraction of 21% which is at the upper end of the values typically observed in groups (3–25%, e.g., David et al. 1995, Böhringer 1995) but not inconsistent with similar results for such X-ray luminous groups as for example NGC 533 or NGC 4104 (Mulchaey et al. 1996). The gas mass fraction slightly decreases with decreasing radius.
| spectral fits: |
| =1.5 keV, = 1.5 1043 erg/s |
| beta-model results: |
| cts/s/arcmin2, , kpc |
| central density, mass: |
| = 1.3 10-3 cm-3; = 0.6 1014 M⊙, |
| gas mass fraction 21% (at = 1 Mpc) |
Concerning the morphology of the IGM, we note that the rather spherically symmetric shape of the extended emission, as compared to the completely different morphology defined by the bright ellipticals aligned in a chain, argues against an origin of the gas in terms of halos of the chain galaxies, but rather for an association with the global group potential.
The X-ray emission of the IGM can be traced out to about 1 Mpc, which turns out to be about the virial radius of the group if we use the total mass value determined from the X-ray observations and the assumption that the virial radius is approximately characterized by the region inside which the mean overdensity is a factor of 200 above the critical density of the universe (e.g., Evrard et al. 1996).
The fairly spherically symmetric appearance of the group’s X-ray halo (except possibly for some faint outer extensions) taken together with the perfect consistency of the mass determined from the velocity dispersion and the X-ray properties, and the findings of Ledlow et al. (1996) that the galaxy velocity distribution does not significantly deviate from a Gaussian, implies that the matter in the group inside a radius of about 1 Mpc is most probably quite relaxed.
The position of the central galaxy NGC 383 is found to be slightly off-set from the center of the extended X-ray emission, and thus presumably from the center of the dark matter potential. Such off-sets of cD galaxies have also been observed in a number of other poor systems (e.g., AWM 7, Neumann & Böhringer 1995; Fornax cluster, Ikebe et al. 1996) and some Abell clusters (e.g., Lazzati & Chincarini 1998). In Lazzati & Chincarini (1998), this is traced back to a small-amplitude oscillation of the cD galaxy around the bottom of the cluster potential.
5.1.2 Presence of a cooling flow ?
The cooling time in the center is yr, i.e. no ‘large-scale’ cooling flow is expected to have developed. Further, the enhanced X-ray emission from the direction of NGC 383 is consistent with originating from a point source.
We also note that although strong low-ionization optical emission lines have been reported for some central galaxies in cluster cooling flows (e.g., Cowie et al. 1983, Heckman 1989, Crawford & Fabian 1992), the morphology of the ring- or disk-like emission line region in NGC 383 (Owen et al. 1990, Fraix-Burnet et al. 1991) does not argue for a connection to a cooling flow. Further, we find the locus of NGC 383 in the emission line-ratio diagram [SII] vs. [NII] to ly outside of the ‘class I’ and ‘class II’ cooling flow nebulae of Heckman et al. (1989; see their Fig. 6). (This alone does not exclude the presence of a cooling flow, though, since not all of them are associated with emission line nebulae.)
5.1.3 Radio - X - relations, pressure estimate
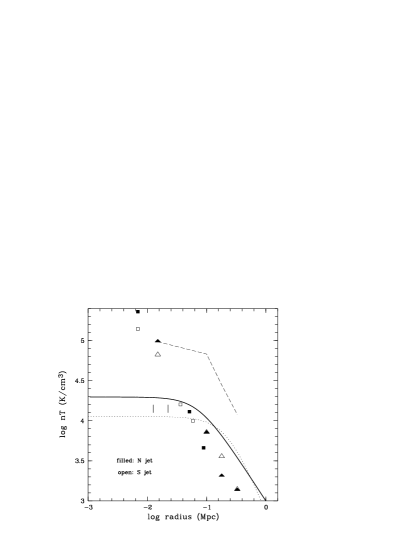
Although 3C 31 is only a moderately bright radio galaxy, its jets could be studied in detail due to its proximity. Concerning the origin, morphology and confinement of the jets, several models were explored (e.g., Blandford & Icke 1978, Bridle et al. 1994, Bicknell 1994).
The gas density and temperature derived for the X-ray gas allow a comparison with the pressure of the radio gas, and an assessment of the confinement of the jet material. In Fig. 9 we compare the pressure of the radio emitting region as given in Strom et al. (1983) and Morganti et al. (1988)222To derive the equipartition pressure, they used the equations of Pacholczyk (1970) and made the standard assumptions of equal energy density in protons and electrons, filling factor of 1, and a powerlaw representation of the radio spectrum with cut-offs at 10 MHz and 100 GHz. with the thermal pressure of the X-ray gas derived from the run of density (Sect. 3.3) and a temperature of =1.5 keV. Whereas in the central region (i.e. within NGC 383), there seems to be a strong overpressure of the radio gas (but note that there certainly is an additional contribution to thermal pressure from higher-density gas within the galaxy), pressure equilibrium is reached at about 35 kpc (projected distance from the center). Further out the thermal pressure increasingly exceeds the nonthermal pressure.
It is interesting to note that Bridle et al. (1980) find the expansion rate of the jets of 3C 31 transverse to their length to decrease with increasing distance from the radio core. This may be related to the relative increase of the thermal pressure of the ambient medium with increasing radius. While Bridle’s trend refers mainly to the presently in X-rays barely resolved core region it may be interesting to explore this relation further with higher-resolution X-ray data.
A similar comparison of thermal vs. non-thermal pressure was performed in T97. They derived a somewhat different surface brightness profile and thus change in thermal pressure with the consequence that the radius where both pressure values are of the same order shifts further out which led them to suggest that NGC 383 might have a giant halo that escaped detection in the (short) HRI exposure.
5.2 Individual sources
5.2.1 relation
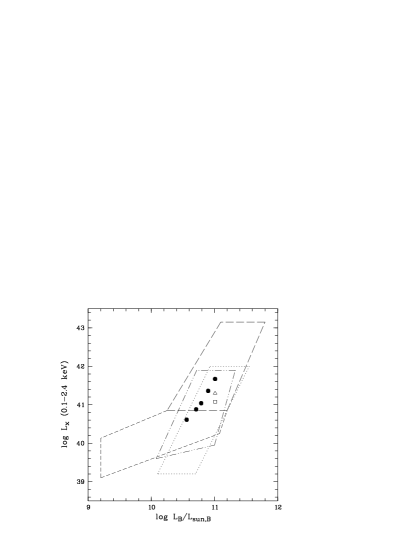
The galaxies of the chain are among those with high and show a larger spread in than in as often observed (e.g., Eskridge et al. 1995).
The high in cluster/group ellipticals (e.g., Fig. 1 of Brown & Bregman 1998, Fig. 2 of Beuing et al. 1998, Fig. 1 of Irwin & Sarazin 1998) are usually traced back to the influence of the surroundings, via accretion of gas from the group environment (e.g., Beuing et al. 1998), or stiffling of winds by the ambient medium (Brown & Bregman 1998); see also Mathews & Brighenti (1998). The low systems seem to be dominated by discrete sources, mainly LMXBs (e.g., Canizares et al. 1987, Irwin & Sarazin 1998).
The present galaxies show a wide range in reaching up to the high end of the / relation. (Fig. 10; note that the objects of very high of the sample of Beuing et al. 1998 are all ellipticals in the cluster environment). The X-ray luminosities generally exceed those expected from a discrete source contribution and the X-ray properties of most galaxies are consistent with the bulk of the X-ray emission arising from the ISM of the individual galaxies. NGC 383 is separately discussed in the next Section.
5.2.2 NGC 383
The X-ray analysis suggests the presence of two components in the X-ray spectrum of NGC 383: emission from a rs plasma of 0.4–0.7 keV and a second component that was parameterized as powerlaw or second rs contribution.
Compact pl emission could originate from an AGN or via SSC at the base of the radio jet; e.g., Jones et al. (1974), Marscher (1987), Birkinshaw & Worrall (1993). Using the correlation of 1 keV X-ray core flux with 5 GHz radio core flux of Worrall et al. (1994, their Fig. 3; see also Fabbiano et al. 1984) we find 3C 31 above this relation (a factor 6 in X-ray flux for the given radio core flux333we used the 5 GHz core radio flux as given in Lara et al. (1997), 90 mJy, and the rs+pl X-ray spectral model with for which we derive a 1 keV X-ray flux in the pl component of 0.058 Jy), and within the region populated by lobe-dominated quasars.
Is there evidence for a relatively unobscured view on an AGN ? Optical emission line ratios were presented by Owen et al. (1990), who found the line ratios in the disk to be similar to those at the nucleus ([NII]/H=1.5, [SII]/H=0.5, [OIII]/H=0.1) and concluded that the disk ionization is probably driven by the nucleus. Plotting these line ratios in the diagnostic diagrams of Veilleux & Osterbrock (1987) we find them to be LINER-like. The dominant excitation mechanism in LINERS is still under discussion, but there is growing evidence that the bulk of them is accretion-powered (e.g., Ho et al. 1998). Owen et al. also briefly mention the presence of a broad emission line component.
Alternatively, two-component rs models fit the X-ray spectrum; a second component may originate from non-perfect correction of the cluster contribution or a temperature range in emission from the ISM of the galaxy. In fact, more than one temperature component is favoured for nearly every early-type galaxy examined in, e.g., Matsushita et al. (1994), Matsumoto et al. (1997) and Buote & Fabian (1998). Whereas the hot component is occasionally interpreted in terms of emission from discrete sources (e.g., Matsushita et al. 1994), we find its luminosity ( erg/s, erg/s if parameterized by a pl or rs model, respectively) to be higher than expected from discrete sources (e.g., Canizares et al. 1987) for the given .
In conclusion, although the exact shape and strength of the hard X-ray component cannot be determined with present data, its presence and high luminosity suggest as origin emission from an active nucleus in NGC 383.
6 1E 0104+3153 (=2 BAL quasar/ elliptical/ IGM of group)
The source 1E 0104 was serendipitously detected as bright X-ray emitter by Einstein and was found to be close to a BAL quasar with =2.027 (Stocke et al. 1984). Since the QSO is also located very near (10″) to a giant elliptical galaxy at =0.111, which is part of a small group, it remained unclear from which of the three the X-ray emission originated: the QSO, the giant elliptical, or the IGM of the small group (Stocke et al. 1984). Gioia et al. (1986), in a deep EXOSAT observation, could not detect X-ray emission in the 0.05–2 keV band, which they traced back to either variability (intrinsic to the source, or caused by a microlensing event during the Einstein observation; which would favour the quasar identification of the X-ray source), or a strongly absorbed X-ray spectrum. The incidental ROSAT PSPC observation of the source was briefly discussed by Ciliegi & Maccacaro (1996) in a large sample study of ROSAT spectra of EMSS AGN. They applied a powerlaw to the spectrum and found excess absorption.
Below, we analyze the X-ray spectral properties in more detail and also perform a timing analysis, in order to get clues on the origin of the X-ray emission (elliptical galaxy, group or quasar).
6.1 Data analysis
6.1.1 Spatial analysis
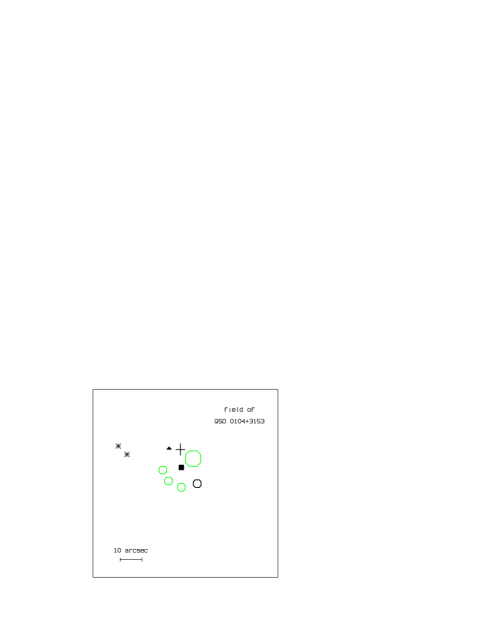
The HRI data improve the position of 1E 0104, but not much, since the source is weak and located near the border of the fov. In Fig. 11 we compare the ROSAT HRI position with the optical positions of the quasar and the galaxies (as given in Stocke et al. 1984; all coordinates were converted to J 2000) and the Einstein IPC position. Both sources, the quasar and the elliptical, remain within the error circle.
We note, however, that the X-ray source appears to be extended. Although the analysis is complicated by a newly detected closeby second source, a comparison with the X-ray emission from the F star at nearly the same off-axis angle, clearly suggests that the X-ray emission from 1E 0104 does not originate from a point source (see Fig. 1; the F star is the brightest source at the right border of the image, 1E 0104 is the one at the lower border).
6.1.2 Temporal analysis
We do not detect short-time variability during the PSPC observation (Fig. 8). To examine the long-term trend, we converted the PSPC countrate to HRI countrate assuming constant spectral shape. Again, the source emission is found to be constant. We then compared with the Einstein IPC flux (this obs. was performed 11 yrs prior to the ROSAT PSPC observation) given in Stocke et al. (1984). To this end, we first re-fit the ROSAT data with the same spectral model as in Stocke et al. (they used =–1.5 and cm-2; see Gioia et al. 1986 for similar parameters). We then derive an observed flux (converted to the 0.3 – 3.5 keV band) of erg/cm2/s which is in excellent agreement with the Einstein flux of erg/cm2/s.
6.1.3 Spectral analysis
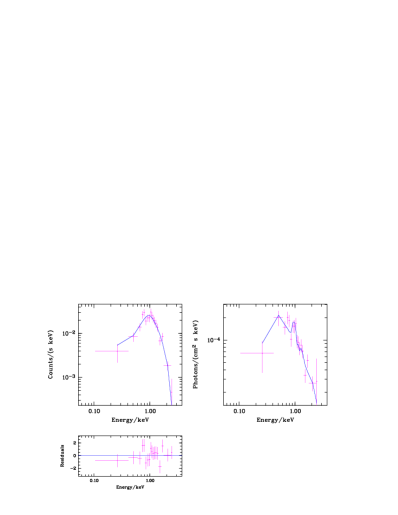
A powerlaw with absorption fixed to the Galactic value does not give a good fit with = –1.7 and = 1.5. The fit improves after allowing for excess cold absorption. This yields cm-2, = –3.2 and = 1.1. Alternatively, the spectrum can be successfully described in terms of a rs model. In this case we used =0.111 since rs emission is more likely to originate from the elliptical and/or IGM. If is treated as free parameter it is consistent with but comes with large errors. We obtain cm-2 and keV ( = 1.0). For =, = 1.9 keV and erg/s.
Plugging this temperature into the relation for groups/clusters (Markevitch 1998) we predict a (0.1–2.4 keV) X-ray luminosity of 5 1043 erg/s which is of the order of the observed value and thus consistent with an identification of 1E 0104 with the IGM of the small group.
6.1.4 Discussion
The X-ray emission of 1E 0104 turned out to be constant. In particular, there is excellent agreement with the flux derived for the Einstein observation (adopting the same spectral model). This renders one of several possibilities discussed in Stocke et al. (1984) – the one that the quasar was temporarily brightened via microlensing during the Einstein observation – unlikely.
We confirm the excess cold absorption in case of the pl description of the X-ray spectrum, not unexpected for a BAL quasar, but find an rs model to be similarly successful. The best-fit parameters of the latter model, which due to its shape would argue for an origin from the group’s IGM or brightest group elliptical, are well consistent with the known - relation of clusters and groups of galaxies, i.e., with the IGM as counterpart. Further, the derived erg/s would be rather high for an elliptical outside a rich cluster environment (particularly for the observed (Stocke et al. 1984) R-magnitude of = 15.1), but usual for the IGM. The HRI position is intermediate between the elliptical and the quasar, and consistent with all three identifications. However, there is evidence that the source emission is extended.
In summary, if only one emitter dominates the X-ray flux (instead of a contribution from all three potential counterparts, which would strongly complicate matters but cannot be excluded) it seems that the available data (constancy in source flux, high , fit into - relation, evidence for source extent) favour an identification with the IGM of the nearby group at =0.111. A deep high spatial resolution observation centered on 1E 0104 should finally resolve the counterpart question.
7 Summarizing conclusions
We have presented a study of the X-ray properties of the NGC 383 group of galaxies, extending the work of T97, and of the source 1E 0104+3135.
The properties of the intra-group medium derived from the ROSAT PSPC observation are summarized in Tab. 3. The X-ray emission of the IGM can be traced out to about Mpc, which turns out to be about the virial radius of the group. Several lines of evidence were presented that the group inside this radius is quite relaxed. With the given depth of the ROSAT PSPC observations we can therefore characterize the entire galaxy system as far as it has approached a dynamical equilibrium state. For this part of the group we find a total mass of M⊙ and a gas mass fraction of 21%. The latter value is at the upper end of the distribution for groups. The result implies that the gravitational potential of the group is deep enough to prevent a majour gas loss, in contrast to less massive groups (Davis et al. 1998).
The surface brightness profile is characterized by a slope parameter which is shallower than for most of the galaxy clusters but a quite common value for groups. The temperature of keV found for the IGM is well consistent with the relation giving further support to the picture that the group is a well relaxed and normal system.
With an estimated central cooling time larger than the Hubble time no central cooling flow is expected and no signature for it is found neither in the spatial and spectral X-ray data nor in the optical spectrum.
We do not find any conspicuous spatial correlation of X-ray emission and radio jet which might be partly due to the narrowness of the jet and the 2D view of the 3D source structure.
We also discussed the X-ray properties of the well-studied radio galaxy 3C 31 which is located near the center of the extended X-ray emission. If one wishes to avoid excessively depleted metal abundances, the spectrum of 3C 31 is best described by a two-component model, consisting of a low-temperature rs component and a hard tail (pl or second rs), confirming T97. The soft component contributes with erg/s to the total X-ray luminosity of erg/s (assuming metal abundances of 0.35solar). No temporal variability in the X-ray flux is detected.
X-ray emission from the direction of the interesting source 1E 0104+3135, by chance located in the field of view, was analyzed. One scenario (transient brightening of the =2 BAL QSO 0104+3135 due to lensing during the earlier Einstein observation) turned out to be unlikely. Besides an absorbed powerlaw, the spectrum of 1E 0104 can be described by a Raymond-Smith model with 2 keV resulting in an intrinsic luminosity of erg/s at =0.111. Although no potential counterpart (QSO, nearby elliptical galaxy or IGM of the small group to which the elliptical belongs) can be safely ruled out at present, there are several hints (constancy in source flux, high , consistency with - relation for groups/clusters, evidence for source extent) for an identification of the X-ray source with the IGM of the nearby group of galaxies at =0.111.
Acknowledgements.
We acknowledge support from the Verbundforschung under grant No. 50 OR 93065. It is a pleasure to thank Vadim Burwitz for help with Figure 4. The ROSAT project is supported by the German Bundesministerium für Bildung, Wissenschaft, Forschung und Technologie (BMBF/DLR) and the Max-Planck-Society. This research has made use of the NASA/IPAC extragalactic database (NED) which is operated by the Jet Propulsion Laboratory, Caltech, under contract with the National Aeronautics and Space Administration.References
- (1)
- (2) Andernach H., Ferretti L., Giovannini G., et al., 1992, A&AS 93, 331
- (3) Anders E., Grevesse N., 1989, Geochimica & Cosmochimica Acta 53, 197
- (4) Arnaud M., Evrard A.E., 1998, astro-ph/9806353
- (5) Arp H., 1966, Atlas of peculiar galaxies, Pasadena: Cal. Inst. of Techn.
- (6) Arp H., 1968, PASP 80, 129
- (7) Arp H., Bertola F., 1971, ApJ 163, 195
- (8) Artyukh V.S., Ogannisyan M.A., Tyul’bashev C.A., 1994, Astr. Let. 20, 211 (= Pis’ma Astr. Zh. 20, 258)
- (9) Beuing J., Döbereiner S., Böhringer H., Bender R., 1998, submitted to MNRAS
- (10) Bicknell G.V., 1984, ApJ 286, 68
- (11) Birkinshaw M., Worrall D.M., 1993, ApJ 412, 568
- (12) Blandford R.D., Icke V., 1978, MNRAS 185, 527
- (13) Böhringer H., 1995, in ‘17th Texas Symp. on Relativistic Astrophys. and Cosmology’, Ann.N.Y.Acad.Sc. 759, H. Böhringer, G.E. Morfill, J. Trümper (eds), 67
- (14) Böhringer H., Voges W., Fabian A.C., Edge A.C., Neumann D.M., 1993, MNRAS 264, L25
- (15) Böhringer H., Nulsen P.E.J., Braun R., Fabian A.C., 1995, MNRAS 274, L67
- (16) Böhringer H., Tanaka Y., Mushotzky R.F., Ikebe Y., Hattori M., 1998, A&A 334, 789
- (17) Bohlin R.C., Savage B.D., Drake J.F., 1978, ApJ 224, 132
- (18) Bridle A.H., Henriksen R.N., Chan K.L., et al., 1980, ApJ 241, L145
- (19) Brown B.A., Bregman J.N., 1998, ApJ 495, L75
- (20) Buote D.A., Fabian A.C., 1998, MNRAS 296, 977
- (21) Burch S.F., 1977, MNRAS 181, 599
- (22) Burch S.F., 1979, MNRAS 187, 187
- (23) Butcher H.R., van Breugel W., Miley G.K., 1980, ApJ 235, 749
- (24) Canizares C.R., Fabbiano G., Trinchieri G., 1987, ApJ 312, 503
- (25) Cavaliere A., Fusco-Femiano R., 1976, A&A 49, L137
- (26) Ciliegi P., Maccacaro T., 1996, MNRAS 282, 477
- (27) Clarke D.A., Harris D.E., Carilli C.L., 1997, MNRAS 284, 981
- (28) Condon J.J., Frayer D.T., Broderick J.J., 1991, AJ 101, 362
- (29) Cowie L.L., Hu E.M., Jenkins E.B., York D.G., 1983, ApJ 272, 29
- (30) Crawford C.S., Fabian A.C., 1992, 259, 265
- (31) David L.P., Arnaud K.A., Forman W., Jones C., 1990, ApJ 356, 32
- (32) David L.P., Jones C., Forman W., 1995, ApJ 445, 578
- (33) Davis D.S., Mulchaey J.S., Mushotzky R.F., 1998, ApJ in press, astro-ph/9808085
- (34) de Vaucouleurs G., et al., 1991, Third reference catalogue of bright galaxies, (New York: Springer)
- (35) Dickey J.M., Lockman F.J., 1990, ARA&A, 28, 215
- (36) Ekers R.D., Fanti R., Lari C., Parma P., 1981, A&A 101,194
- (37) Eskridge P.B., Fabbiano G., Kim D.-W., 1995, ApJS 97, 141
- (38) Evrard A.E., Metzler C.A., Navarro J.N., 1996, ApJ, 469, 494
- (39) Fabian A.C., Crawford C.S., Edge A.C., Mushotzky R.F., 1994, MNRAS 267, 779
- (40) Fabbiano G., Miller L., Trinchieri G., Longair M., Elvis M., 1984, ApJ 277, 115
- (41) Fabbiano G., Kim D.-W., Trinchieri G., 1994, ApJ 429, 92
- (42) Fomalont E.B., Bridle A.H., Willis A.G., Perley R.A., 1980, ApJ 237, 418
- (43) Fraix-Burnet D., Golombek D., Macchetto F.D., 1991, AJ 102, 562
- (44) Garcia A.M., 1993, A&AS 100, 47
- (45) Gioia I.M., Maccacaro T., Schild R.E., Giommi P., Stocke J.T., 1986, ApJ 307, 497
- (46) Gorenstein P., Fabricant D., Topka K., Harnden F.R. Jr, Tucker W.H., 1978, ApJ 224, 718
- (47) Harris D.E., Carilli C.L., Perley R.A., 1994, Nat 367, 713
- (48) Heckman T.M., Baum S.A., van Breugel W.J.M., McCarthy P., 1989, ApJ 338, 48
- (49) Heisler J., Tremaine S., Bahcall J.N., 1985, ApJ 298, 8
- (50) Henkel C., Wang Y.P., Falcke H., Wilson A.S., Braatz J.A., 1998, A&A 335, 463
- (51) Ho L., 1998, astro-ph/9807273, to appear in The 32nd COSPAR Meeting, Adv. Space Res.
- (52) Ikebe Y., Ezawa H., Fukazawa Y., et al., 1996, Nat 379, 427
- (53) Irwin J.A., Sarazin C.L., 1998, ApJ 499, 650
- (54) Jones C., Forman W., 1984, ApJ 276, 38
- (55) Jones T.W., O’Dell S.L., Stein W.A., 1974, ApJ 188, 353
- (56) Keel W.C., 1988, ApJ 329, 532
- (57) Klein U., Wielebinski R., 1979, A&A 72, 229
- (58) Kormendy J., Bahcall J.N., 1974, AJ 79, 671
- (59) Lara L., Cotton W.D., Feretti L., et al. 1997, ApJ 474, 179
- (60) Lazatti D., Chincarini G., 1998, A&A in press, astro-ph/9807170
- (61) Ledlow M.J., Loken C., Burns J.O., Hill J.M., White R.A., 1996, AJ 112, 388
- (62) Macdonald G.H., Kenderline S., Neville A.C., 1968, MNRAS 138, 259
- (63) Markevitch M., 1998, ApJ in press, astro-ph/9802059v2
- (64) Marscher A.P., 1987, in ‘Superluminal Radio Sources’, A. Zensus, T.J. Pearson (eds), 280
- (65) Mathews W.G., Brighenti F., 1998, astro-ph/9806350
- (66) Matsumoto H., Koyama K., Awaki H., et al., 1997, ApJ 482, 133
- (67) Matsushita K., Makishima H., Awaki C.R., et al., 1994, ApJ 436, L41
- (68) Metzler C.A., Evrard A.E., 1997, astro-ph/9710324
- (69) Morganti R., Fanti R., Gioia I.M., et al., 1988, A&A 189, 11
- (70) Moss C., Dickens R.J., 1977, MNRAS 178, 701
- (71) Mulchaey J.S., Davis D.S., Burstein D., 1996, ApJ, 456, 80
- (72) Mulchaey J.S., Zabludoff A.I., 1998, ApJ 496, 73
- (73) Neumann D.M., Böhringer H., 1995, A&A 301, 865
- (74) Osterbrock D.E., 1989, Astrophysics of Gaseous Nebulae and Active Galactic Nuclei, Univ. Sci. Books: Mill Valley
- (75) Otani C., Brinkmann W., Böhringer H., et al., 1998, A&A in press (IoA prep. A98-16)
- (76) Owen F.N., O’Dea C.P., Keel W.C., 1990, ApJ 352, 44
- (77) Pacholczyk A.G., 1970, Radio Astrophysics, Freeman & Co., San Francisco
- (78) Pfeffermann E., Briel U.G., Hippmann H., et al., 1987, SPIE 733, 519
- (79) Ponman T.J., Bourner P.D.J., Ebeling H., Böhringer H., 1996, MNRAS 283, 690
- (80) Predehl P., Schmitt J.H.M.M., 1995, A&A 293, 889
- (81) Reiprich T., 1998, Diplom thesis, LMU München
- (82) Sarazin C., 1997, in ‘The Nature of Elliptical Galaxies’, M. Arnaboldi, G. DaCosta, P. Saha (eds), ASP conf. ser. 116, 375
- (83) Sakai S., Giovanelli R., Wegner G., 1994, AJ 108, 33
- (84) Smith R.J., Lucey J.R., Hudson M.J., Steel J., 1997, MNRAS 291, 461
- (85) Stocke J.T., Liebert J., Schild R., Gioia I.M., Maccacaro T., 1984, ApJ 277, 43
- (86) Strom R.G., Fanti R., Parma P., Ekers R.D., 1983, A&A 122, 305
- (87) Trümper J., 1983, Adv. Space Res. 2, 241
- (88) Trussoni E., Massaglia S., Ferrari R., et al., 1997, A&A 327, 27 (T97)
- (89) van Breugel W., 1982, A&A 110, 225
- (90) Veilleux S., Osterbrock D.E., 1987, ApJS 63, 295
- (91) White R.E. III, 1991, ApJ 367, 69
- (92) White D.A., 1996, in ‘Röntgenstrahlung from the Universe’, MPE report 263, H.U. Zimmermann, J. Trümper, H. Yorke (eds), 621
- (93) Worrall D.M., Lawrence C.R., Pearson T.J., Readhead A.C.S., 1994, ApJ 420, L17
- (94) Zimmermann H.U., Becker W., Belloni T., et al., 1994, MPE report 257
- (95) Zwicky F., Herzog E., Wild P., Karpowicz M., Kowal C.T., 1961–68, Catalogue of Galaxies and Clusters of Galaxies, Pasadena: Cal. Inst. of Techn., Vol. 1-6