LOTIS Search for Early Time Optical Afterglows: GRB 971227
Abstract
We report on the very early time search for an optical afterglow from GRB 971227 with the Livermore Optical Transient Imaging System (LOTIS). LOTIS began imaging the ‘Original’ BATSE error box of GRB 971227 s after the onset of gamma-ray emission. Continuous monitoring of the position throughout the evening yielded a total of 499 images (10 s integration). Analysis of these images revealed no steady optical afterglow brighter than R= in any single image. Coaddition of the LOTIS images also failed to uncover transient optical emission. In particular, assuming a constant early time flux, no optical afterglow brighter than R= was present within the first 1200 s and no optical afterglow brighter than R= was present in the first 6.0 h.
Follow up observations by other groups revealed a likely X-ray afterglow and a possible optical afterglow. Although subsequent deeper observations could not confirm a fading source, we show that these transients are not inconsistent with our present knowledge of the characteristics of GRB afterglows. We also demonstrate that with the upgraded thermoelectrically cooled CCDs, LOTIS is capable of either detecting very early time optical afterglow or placing stringent constraints on the relationship between the gamma-ray emission and the longer wavelength afterglow in relativistic blast wave models.
1 Introduction
Recent observations of long wavelength (X-ray, optical and radio) afterglows of gamma-ray bursts (GRBs) have provided precise localizations (e.g., Levine et al. (1998); van Paradijs et al. (1997); Frail et al. (1997)). Redshift measurements of the apparent host galaxies strongly suggest that GRBs are located at very large distances (Metzger et al. (1997); Kulkarni et al. (1998); Djorgovski et al. (1998)). These distances together with the measured gamma-ray fluxes imply that GRBs are extremely energetic phenomena (e.g., Kulkarni et al. (1998)). X-ray and optical afterglows have consistently displayed a power law decay in time (Wijers et al. (1997); Groot et al. (1998); Bloom et al. (1998)) with some notable deviations (Galama et al. 1997a ). Flux variations in radio afterglows have been interpreted as diffractive scintillation effects. The decreasing amplitude of these variations with time suggests a relativistically expanding source (Goodman (1997); Frail et al. (1997)).
All of the above GRB and afterglow characteristics are, for the most part, consistent with a relativistic blast wave model (Rees & Mészáros (1992); Mészáros & Rees (1993)). However it is still unclear what physical mechanism is producing the underlying energetic fireballs. In fact a definitive signature of the central engine may be impossible to observe directly due to the optically thick baryon-loaded fireball (Goodman (1986)).
Perhaps more can be learned about the source of GRBs through early time observations of the afterglow. These observations may reveal whether the central engine deposits energy impulsively (Mészáros & Rees (1993)) or in an unsteady wind (Mészáros & Rees (1994); Paczyński & Xu (1994)). The impulsive blast wave model produces both the GRB and the afterglow in an external shock. The early time afterglow flux is predicted to roughly scale to the initial gamma-ray flux. At later times the flux decays in a power law fashion as the shock slows due to the sweeping up of the external circum-burster material (CBM).
In the unsteady wind model the GRB is produced by collisions between internal shocks (e.g., Sari & Piran (1997)) while the afterglow is produced in the external shock. Both models predict similar late time long wavelength behavior. However the early time optical afterglow in the case of the unsteady wind may be more complex and is less constrained by the initial gamma-ray flux.
Observations of GRB 990123 have established the existence of prompt optical emission (Akerlof et al. (1999)). The peak optical flux appears to be slightly delayed relative to the peak gamma-ray flux. Sari & Piran (1999) have suggested that this delay is indicative of the different production regions for the gamma-ray and the prompt optical emission. The GRB may form in the internal shocks, while the prompt optical and X-ray emission result from the reverse and forward external shocks, respectively (e.g., Sari & Piran (1999)). Previously reported LOTIS upper limits (Park et al. 1997a ; Williams et al. (1997); Park et al. 1998a ), as well as those presented here and in the future may provide constraints on the emission sites in the expanding GRB fireball.
2 Observations Following GRB 971227
LOTIS is a robotic wide field-of-view telescope capable of responding to a GRB Coordinates Network (GCN; Barthelmy et al. (1997)) trigger within 10 s of the start of a burst. The system consists of four cameras mounted in a array which cover a total field-of-view of . To ensure maximum light gathering power the cameras have not been equipped with standard filters. Since the response of the 2k 2k Loral CCDs most closely resembles the R-band, we assume R-band photometry. The small errors introduced by this assumption have been accounted for in the analysis and are included in the stated uncertainties. Specific information on the LOTIS system and operational method is provided in Park et al. (1997a), Park et al. (1998b) and at the LOTIS homepage111http://hubcap.clemson.edu/ggwilli/LOTIS/.
GRB 971227 was detected by the Burst and Transient Source Experiment (BATSE) instrument aboard Compton Gamma-Ray Observatory (CGRO) on December 27.34938 (8:23:06.72 UT). This burst was simultaneously detected by both the Gamma-Ray Burst Monitor (GRBM) and the Wide Field Camera WFC2 aboard the BeppoSAX satellite (Coletta et al. (1997)). GRB 971227 consisted of a single main peak and a weaker second peak with a total duration of s (T; Meegan et al. (1998)). BATSE measured a peak photon flux and fluence of cm-2 s-1 (64 ms; 50–300 keV) and erg cm-2 ( 25 keV) respectively (Woods et al. (1997)). The peak flux measured by the BeppoSAX WFC2 was 1.8 Crab ( erg cm-2 s-1; 2–10 keV; Coletta et al. (1997)). The ‘Original’ BATSE coordinates for the burst were RA=, Dec= (J2000.0). These ‘Original’ coordinates are calculated using the first 1 or 2 seconds of the burst light curve, sacrificing positional accuracy in favor of rapid dissemination (Barthelmy et al. (1997) and the GCN homepage222http://gcn.gsfc.nasa.gov/gcn). The initial BeppoSAX WFC2 position was RA=, Dec= (J2000.0) with an error radius of (Coletta et al. (1997)). GRB 971227 was also detected by the Ulysses gamma-ray burst monitor (Hurley et al. (1992)). The Ulysses/BATSE triangulation provided a wide annulus intersecting the final 3 BATSE and the initial BeppoSAX WFC2 error circles.
Follow up observations 14 h after the GRB by the BeppoSAX Narrow Field Instruments (NFI) detected two previously unknown X-ray sources within the initial WFC2 error box. One source (1SAX J1257.5+5915) did not show significant variation during the 20 h observation period. The second source (1SAX J1257.3+5924), with coordinates RA= (), Dec= (; J2000.0) and an error radius of , had a time average flux of erg cm-2 s-1 (2–10 keV) during the first 8 h but was undetectable at the 3 level for the remainder of the observation (Piro et al. (1997)). Although the association of the fading X-ray source with GRB 971227 could not be confirmed it is considered the most likely candidate for the X-ray afterglow.
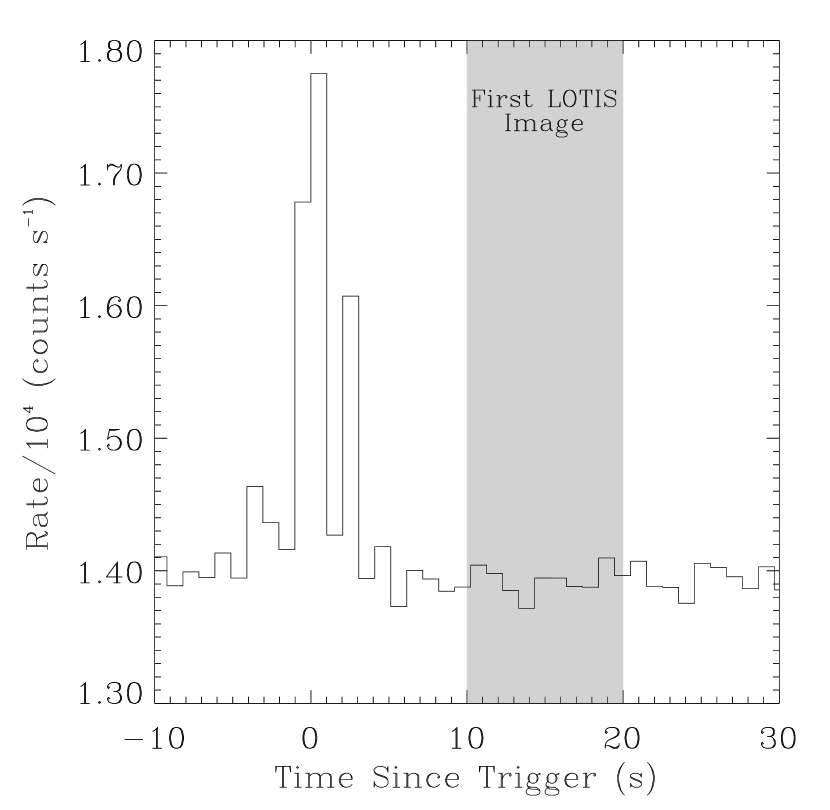
LOTIS received the GCN coordinates at 8:23:10.9 UT and after a slew time of 5.8 s began imaging the area near the ‘Original’ GRB coordinates. The first LOTIS image began 10.0 s after the BATSE trigger. Figure 1 shows the BATSE gamma-ray (E 20 keV) light curve for GRB 971227 (Meegan et al. (1998)). The shaded area represents the duration (10 s integration) of the first LOTIS image. Although the ‘Original’ BATSE coordinates were from the more precise BeppoSAX WFC2 coordinates, the LOTIS wide field-of-view camera system allowed full coverage of the X-ray counterpart error box. Figure 2 shows the area covered by LOTIS camera 1. Coverage of cameras 2, 3 and 4 is not shown. The center of the array of cameras is in the upper left hand corner. Each of the dots represents a stellar object detected (3) by the system. The final 1 and 3 BATSE error circles as well as the Interplanetary Network (IPN; Hurley (1998)) annulus and BeppoSAX WFC2 error circles are also shown.
3 Data Analysis and Results
In the 6 dark hours following GRB 971227 LOTIS obtained 499 images (10 s integration) which fully covered the X-ray counterpart error box. All the images were dark subtracted and flat fielded. Visual inspection was carried out on the full images () as well as on a subsection of the images () centered on the suspected X-ray counterpart. No astrophysical transient events consistent with the point spread function of the system were found. DAOPHOT (Stetson (1987)) routines were used to identify all stellar objects brighter than 3 above the background for the entire LOTIS data set. All objects were traced from image to image and variable objects were flagged. These objects were then carefully inspected by eye and in all cases discarded as a possible afterglow candidate. All objects found within the initial 10′ radius X-ray counterpart error circle were identified with known stars in the Guide Star Catalog (GSC; Jenkner et al. (1990)). No transient events or previously unidentified sources brighter than R= were found within the error circle.
Since the simplest fireball model predicts a constant early-time optical flux we coadded LOTIS images to increase the signal-to-noise ratio. We first coadded and analyzed every set of ten images (1–10, 11–20, 21–30,…,491–499). Including the 10 s CCD readout time each set of images corresponds to an interval of s. In this manner the LOTIS sensitivity to short term transient events was increased to a limiting magnitude of R=. No previously unknown sources were detected. We then coadded consecutive sets of images in increments of ten (1–10, 1–20, 1–30,…,1–499). All stellar objects in the summed images were matched with previously identified objects in the USNO-A1.0 Catalog (Monet et al. (1996)). No new sources brighter than R= were revealed during the first 1200 s (1–56) and no new sources brighter than R= were revealed during the first 21300 s (1–490). We present the results of summing the first 1200 s of data because LOTIS was in ‘burst mode’ during that time. While in ‘burst mode’ LOTIS obtains one 10 s image every 20 s. At later times LOTIS was in ‘sky patrol mode’ obtaining one 10 s image every 40 s.
Figure 3 shows a broadband light curve of the afterglow of GRB 971227 based on the simple fireball model (Mészáros & Rees (1993); Wijers et al. (1997)). The data for this plot are listed in Table 1. The crossed circle and the square are the gamma-ray (100 keV) and X-ray (5 keV) flux densities derived from BATSE data. We fit the High Energy Resolution Burst data (HERB; consisting of 128 separate high energy resolution spectra from four Large Area Detectors) from 0.033 s to 6.976 s (29.16–1881.5 keV) to the Band functional form (Band et al. (1993)) and extracted the value of the fit at 100 keV and at 5 keV (extrapolation). The error bars reflect the range of the best fit Band functional form. The times have been offset by s to avoid confusion.
The BeppoSAX data are represented by triangles. The first triangle is the approximate X-ray flux density (/8 keV) measured by the WFC2 during GRB 971227. The second triangle is the approximate flux density (/8 keV) of the suspected X-ray afterglow measured with the BeppoSAX NFI.
The LOTIS upper limits are plotted as diamonds. The first point indicates the upper limit of R= derived from the first LOTIS image. The second and third diamonds are the upper limits of R= and R= achieved after adding the first 1200 s and 21300 s of LOTIS data. The dotted straight line connecting the LOTIS points is an approximation of how the sensitivity changes with integration time. The line changes slope because of the decrease in total integration time per unit real time when LOTIS changes from ‘burst mode’ to ‘sky patrol mode’.
The circles plotted at late times are the R-band upper limits obtained by several different groups. The photometric values have not been dereddened since the burst occurred at high galactic latitude (l=121.464,b=57.853). The single open circle is the upper limit quoted by Groot et al. (1997). The area covered in this observation was the inner of the initial X-ray counterpart error box (Groot et al. (1997)). It is important to note that this observation does not cover the area of the optical afterglow candidate suggested by Castro-Tirado et al. (1997) which is plotted as a star. Preliminary photometry of the afterglow candidate yielded an apparent magnitude of R= (Castro-Tirado et al. (1997)). Further analysis found an apparent magnitude of R= (Bartolini et al. (1998)).
The solid line is a fit to the data assuming a simple fireball model. In this case the synchrotron break frequency evolves as due to the decay of the bulk Lorentz factor as the blast wave engulfs increasing amounts of CBM. Prior to passage of the synchrotron break frequency through the observation band the early time flux varies as . At later times, after the break frequency passes through the observation band, the flux decays as or where is the high energy spectral index (Mészáros & Rees (1993); Wijers et al. (1997)). We adjust the predicted early time flux to the initial gamma-ray and X-ray fluxes. The optical decay is fit with a power law through the possible afterglow detection and the most constraining late time upper limit of Djorgovski et al. (1997). Using this method we find a lower limit on the power law decay index of . The optical counterparts detected to date have decay indices ranging from approximately for GRB 980703 (Bloom et al. (1998)) to for GRB 980326 (Groot et al. (1998)). If the transient detected by Castro-Tirado et al. (1997) is indeed associated with GRB 971227 it displayed one of the fastest decays of the optical counterparts detected to date.
To constrain the relationship between GRB properties and the intensity of prompt optical emission, we compare GRB 971227 with GRB 990123. The ratios of the peak flux and fluence for the two events is and (Woods et al. (1997);Meegan et al. (1998)). If the prompt optical flux scales with the gamma-ray fluence then GRB 971227 would have had a peak magnitude of m and therefore would have been undetectable by LOTIS. If the peak optical flux scales with the peak gamma-ray flux then GRB 971227 would have produced an optical flash which peaked at m . If this flash occured during the first LOTIS image it would have easily been detected. However the level of optical emission during the first LOTIS image depends on the time of the optical peak and its rate of decay; both uncertain parameters. A full comparison between properties of GRB 990123 and the set of GRBs which have resulted in LOTIS upper limits will be presented in a future publication.
4 Conclusion
Although identifications of an X-ray and optical afterglow of GRB 971227 are inconclusive we have shown that the properties of these suspected transient events can be made consistent with the fireball model. Assuming the transients are associated with the burst we find a lower limit on the index of the power law decay for the afterglow of GRB 971227 of .
In addition to characterizing the early time afterglow from GRBs, early detection could allow differentiation between physical processes causing the GRB itself and the afterglow. Although LOTIS was able to provide meaningful constraints on early time optical afterglow from GRB 971227 at intermediate times ( s), these constraints were not stringent since this was not a particularly intense burst in terms of peak flux. A recent upgrade to thermoelectrically cooled CCDs has increased the LOTIS sensitivity by a factor of 10 (R=12.0 to R=14.5 in a single exposure). With this upgrade in place LOTIS is now much more likely to detect or significantly constrain early time optical afterglows.
| log | Band | Instrument | Ref. | ||
|---|---|---|---|---|---|
| (s) | (Jy) | ||||
| 0.6021 | 1934. | X | BeppoSAX(WFC2) | 1 | |
| 0.8454 | 314. | BATSE | Band Fit | ||
| 0.8454 | 601. | X | BATSE | Band Fit | |
| 1.2672 | 34144. | R | LOTIS | 2 | |
| 3.0792 | 5933. | R | LOTIS | - | |
| 4.3284 | 2840. | R | LOTIS | - | |
| 4.6852 | 28. | 400 | R | CAHA Tele. | 3,12 |
| 4.8006 | 0. | 0155 | X | BeppoSAX(NFI) | 4 |
| 4.8847 | 2. | 154 | R | Isaac Newton Tele. | 5 |
| 4.9580 | 11. | 306 | R | Palomar 60 in Tele. | 6 |
| 5.2751 | 7. | 134 | R | Kitt Peak 0.9 m Tele. | 7 |
| 5.3853 | 4. | 501 | R | Loiano 1.5 m Tele. | 8,12 |
| 5.4744 | 0. | 713 | R | Keck | 9 |
| 5.5483 | 17. | 919 | R | DAO 1.8 m Plaskett Refl. | 10 |
| 6.7680 | 4. | 501 | R | 1.2 m OHP Tele. | 11 |
References
- Akerlof et al. (1999) Akerlof, C. W. et al. 1999, Nature, submitted
- Band et al. (1993) Band, D. L. et al. 1993, ApJ, 413, 281
- Barthelmy et al. (1997) Barthelmy, S. D. et al. 1997, in the 4th Huntsville Symposium on Gamma-Ray Bursts, eds. C. A. Meegan, R. D. Preece and T. M. Koshut, AIP Conference Proceedings 428, 99
- Bartolini et al. (1997) Bartolini, C. et al. 1997, GCN Circ. 20
- Bartolini et al. (1998) Bartolini, C. et al. 1998, A&A, Proceedings of Gamma-Ray Bursts in the Afterglow Era
- Bloom et al. (1998) Bloom, J. S. et al. 1998, ApJ, 508, L21
- Bond et al. (1997) Bond, H. E. et al. 1997, GCN Circ. 22
- Castro-Tirado et al. (1997) Castro-Tirado, A. J. et al. 1997, GCN Circ. 20
- Coletta et al. (1997) Coletta, A. et al. 1997, IAU Circ. 6796
- Djorgovski et al. (1997) Djorgovski, S. G. et al. 1997, GCN Circ. 25
- Djorgovski et al. (1998) Djorgovski, S. G. et al. 1998, ApJ, 508, L17
- Frail et al. (1997) Frail, D. A. et al. 1997, Nature, 389, 261
- (13) Galama, T. J. et al. 1997a, ApJ, 497, L13
- (14) Galama, T. J. et al. 1997b, GCN Circ. 26
- Goodman (1986) Goodman, J. 1986, ApJ, 308, L47
- Goodman (1997) Goodman, J. 1997, New Astronomy, 2, 449
- Groot et al. (1997) Groot, P. J. et al. 1997, GCN Circ. 17
- Groot et al. (1998) Groot, P. J. et al. 1998, ApJ, 502, L123
- Hurley et al. (1992) Hurley, K. et al. 1992, A&AS, 92, 401
- Hurley (1998) Hurley, K. 1998, http://ssl.berkeley.edu/ipn3/index.html
- Ilovaisky & Chevalier (1997) Ilovaisky, S. A. & Chevalier, C. 1997, IAU Circ. 6803
- Jenkner et al. (1990) Jenkner, H. et al. 1990, ApJ, 99, 2082
- Kulkarni et al. (1998) Kulkarni, S. R. et al. 1998, Nature, 393, 35
- Levine et al. (1998) Levine, A. et al. 1998, IAU Circ. 6966
- Meegan et al. (1998) Meegan, C. A. et al. 1998, Current BATSE Gamma-Ray Burst Catalog at http://www.batse.msfc.nasa.gov/data/grb/catalog/
- Mészáros & Rees (1993) Mészáros, P. & Rees, M. J. 1993, ApJ, 405, 278
- Mészáros & Rees (1994) Mészáros, P. & Rees, M. J. 1994, ApJ, 430, L93
- Metzger et al. (1997) Metzger, M. R. et al. 1997, Nature, 387, 879
- Monet et al. (1996) Monet, D. et al. 1996, USNO-A1.0 Catalog, (U.S. Naval Observatory, Washington, D.C.)
- Paczyński & Xu (1994) Paczyński, B. & Xu, G. 1994, ApJ, 424, 708
- (31) Park, H. S. et al. 1997a, ApJ, 490, L21
- (32) Park, H. S. et al. 1997b, GCN Circ. 19
- (33) Park, H. S. et al. 1998a, A&A, Proceedings of Gamma-Ray Bursts in the Afterglow Era
- (34) Park, H. S. et al. 1998b, Proc. SPIE, Optical Astronomical Instrumentation, ed. D’Odorico, S., Vol. 3355, 658
- Piro et al. (1997) Piro, L. et al. 1997, IAU Circ. 6797
- Ramaprakash et al. (1997) Ramaprakash, A. N. et al. 1997, GCN Circ. 24
- Rees & Mészáros (1992) Rees, M. J. & Mészáros, P. 1992, MNRAS, 258, 41
- Sari & Piran (1997) Sari, R. & Piran, T. 1997, MNRAS, 287, 110
- Sari & Piran (1999) Sari, R. & Piran, T. 1999, submitted (astro-ph/9902009)
- Stetson (1987) Stetson, P. B. 1987, PASP, 99, 191
- van Paradijs et al. (1997) van Paradijs, J. et al. 1997, Nature, 386, 686
- Wijers et al. (1997) Wijers, R. A. M. et al. 1997, MNRAS, 288, L51
- Williams et al. (1997) Williams, G. G. et al. 1997, in the 4th Huntsville Symposium on Gamma-Ray Bursts, eds. C. A. Meegan, R. D. Preece and T. M. Koshut, AIP Conference Proceedings 428, 837
- Woods et al. (1997) Woods, P. M. et al. 1997, IAU Circ. 6798