The Host Galaxy of GRB 990123
Abstract
We present deep images of the field of -ray burst (GRB) 990123 obtained in a broad-band UV/visible bandpass with the Hubble Space Telescope, and deep near-infrared images obtained with the Keck-I 10-m telescope. Both the HST and Keck images show that the optical transient (OT) is clearly offset by 0.6 arcsec from an extended object, presumably the host galaxy. This galaxy is the most likely source of the metallic-line absorption at seen in the spectrum of the OT. With magnitudes and mag this corresponds to an galaxy, assuming that it is located at . The estimated unobscured star formation rate is yr-1, which is not unusually high for normal galaxies at comparable redshifts. The strength of the observed metallic absorption lines is suggestive of a relatively high metallicity of the gas, and thus of a chemically evolved system which may be associated with a massive galaxy. It is also indicative of a high column density of the gas, typical of damped Ly systems at high redshifts. We conclude that this is the host galaxy of GRB 990123. No other obvious galaxies are detected within the same projected radius from the OT. There is thus no evidence for strong gravitational lensing magnification of this burst, and some alternative explanation for its remarkable energetics may be required. The observed offset of the OT from the center of its apparent host galaxy, proper kpc (projected) in the galaxy’s rest-frame, both refutes the possibility that GRBs are related to galactic nuclear activity and supports models of GRBs which involve the death and/or merger of massive stars. Further, the HST image suggests an intimate connection of GRB 990123 and a star-forming region.
1 Introduction
A great deal of progress has been achieved in our understanding of cosmic –ray bursts (GRBs) over the past two years. The breakthrough development was the precise localization of bursts by the BeppoSAX satellite (Boella et al. (1997)), which led to the discovery of long-lived afterglows of GRBs, ranging from x-rays (Costa et al. (1997)), to optical (van Paradijs et al. (1997)) and radio (Frail et al. (1997)). This, in turn, has opened the possibility of detailed physical studies of the afterglows, and measurements of their distances.
To date, several optical transients (OTs) associated with GRBs have been found, and in almost every case a faint galaxy was found at the same location (to within a fraction of an arcsecond) after the OT has faded. So far, redshifts have been obtained for four such GRB host galaxies: for GRB 970508 (Metzger et al. (1997), Bloom et al. (1998)), for GRB 971214 (Kulkarni et al. (1998)), for GRB 980703 (Djorgovski et al. (1998)), and for GRB 980613 (Djorgovski et al. 1999a ). These measurements have established that most or all GRBs are located at cosmological distances (Paczyǹski (1995)), involving substantial energy release (isotropic equivalent in the -rays alone).
While the ultimate origin of GRBs is still not established, studies of their afterglows provide several crucial constraints for theoretical models. First, the measurement of distances establishes the energetics of the bursts, modulo the unknown beaming factor. Second, detailed studies of the afterglow light curves over a range of wavelengths can constrain the physical parameters of the afterglows, including the energetics and beaming. Finally, the location of the afterglows within their host galaxies and measurements of the star formation rates (SFR) in these galaxies can constrain the nature of the population of GRB progenitors.
The two leading models for GRBs involve the formation of a black hole (BH): either via coalescence of a massive stellar remnant binary (eg. BH–NS, NS–NS; Paczyǹski (1986),Goodman (1986),Narayan, Paczyǹski, & Piran ) or direct collapse of a massive star (Woosley (1993), Paczyǹski (1998)). Both models predict that GRBs rates should strongly correlate with the cosmic star-formation rates (SFR) and so most GRBs should occur in the redshift range . The former model predicts a tight spatial correlation between GRBs and star-forming regions in the disk. In the latter scenario, however, the coalescence site of a NS–NS binary can be quite distant ( few kpc) from the stellar birth site (see Bloom, Sigurdsson, & Pols (1999)). GRBs could also be associated with nuclear black holes (AGN); see Roland et al. (1994). In this scenario, unlike either model described above, the GRBs will occur in the center of the host.
Until recently, the most spectacular example of GRB energetics was seen with GRB 971214 at (Kulkarni et al. (1998)): the implied isotropic energy released from the burst in the -rays alone was erg, some two orders of magnitude higher than the commonly assumed numbers. However, this was further surpassed by an order of magnitude by the recent discovery of GRB 990123.
Following the detection by BeppoSAX (Piro et al. (1999)), an optical transient was discovered at Palomar (Odewahn, Bloom, & Kulkarni (1999)), and subsequently a coincident radio transient was found at the VLA (Frail & Kulkarni (1999)), within the error-circles of the GRB itself and the associated new x-ray source (Piro et al. (1999)). Examination of the ROTSE images taken within minutes of the burst revealed an unprecedented bright ( mag) phase of the optical afterglow (Akerlof & McKay (1999)). Spectroscopy of the OT obtained at the Keck-II 10-m telescope revealed an absorption system with (Kelson et al. (1999)). Together with the GRO/BATSE measurement of the burst fluence (Kippen (1999)), this implied a phenomenal energetics for the burst and its afterglow. The absorption redshift was subsequently confirmed independently by Hjorth et al. 1999a , and further refinement of the spectroscopy improved the redshift measurement to (Hjorth et al. 1999b , Djorgovski et al. 1999d ). A fading infrared counterpart was discovered at the Keck-I 10-m telescope (Bloom et al. 1999b ).
The early reports indicated a presence of an apparent foreground galaxy within arcsec from the OT (Odewahn, Bloom, & Kulkarni (1999), Bloom et al. 1999a , Gal et al. (1999)) and, later found, the presence of foreground emission and absorption lines at and (Hjorth et al. 1999a ). Motivated by these reports, and the unprecedented apparent energetics of the burst, it was proposed that this burst may have been gravitationally lensed (Djorgovski et al. 1999b ). However, subsequent observations and analysis did not confirm the existence of this foreground galaxy (Yadigaroglu et al. (1999), Djorgovski et al. 1999c ) nor low-redshift absorbers close to the line-of-sight (Hjorth et al. 1999b , Djorgovski et al. 1999d ). Thus, the empirical motivation for the gravitational lensing of this burst was all but removed leaving open the problem of its energetics.
Kulkarni et al. (1999) present a detailed study of the ground-based work on this burst to date, and analyze its physical properties and energetics. Early ground-based observations are dominated by the afterglow light, which makes difficult the detection and study of the host galaxy (and possible foreground objects near the line of sight). In this Letter we report on the Hubble Space Telescope (HST) observations of the host galaxy of this burst, about 16 days after the burst itself, as well as the ground-based Keck imaging in the near-infrared, starting from about 6 days after the burst.
2 Observations and Data Reductions
The ground-based near-IR images of the field were obtained using the NIRC instrument (Matthews & Soifer (1994)) at the Keck-I 10-m telescope. A log of the observations and a detailed description of the data and the reduction procedures are given by Kulkarni et al. (1999). The observations were obtained in the or bands, and were calibrated to the standard band (m). The Galactic extinction corrections are negligible in the band, assuming in this direction (Schlegel, Finkbeiner, & Davis (1998)).
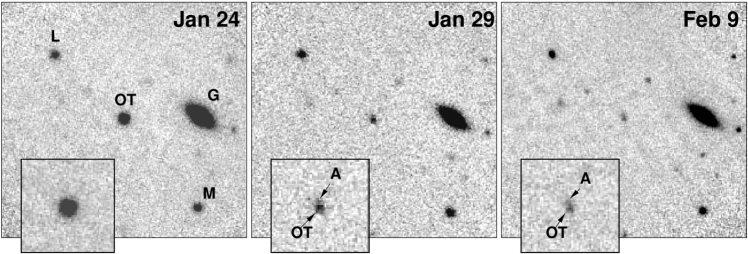
The first evidence of the underlying galaxy, approximately 0.5 arcsec from the OT was seen in the Keck images taken on 27 January 1999 UT. We estimated a magnitude mag (Djorgovski et al. 1999c ). The galaxy, the putative host, which we designate as “A”, was then clearly detected in the images obtained on 29 January 1999 UT (Djorgovski et al. 1999e ), as shown in Figure 1. The total -band magnitude of the OT plus the galaxy at that time (January 29.665 UT) was mag (including both random and systematic errors). We estimate the contribution of the galaxy to the total flux by masking the appropriate pixels of the transient, and find that the galaxy contributed about 21% 5% of the total -band light at that time, implying the magnitudes mag (at this epoch), and mag.
The total -band magnitude measured on 9 February 1999 UT is mag. If the OT had a power-law spectrum with and the extinction-corrected Gunn -band flux at the same epoch Jy (Kulkarni et al. (1999)), then the predicted band magnitude of the OT alone would be mag (at this epoch), and the resulting magnitude of the galaxy would be mag. However, the slope of the OT power-law continuum may have changed by that time, and if we assume instead, we derive mag, and mag. We thus assume the estimate of mag from this decomposition.
Taking the weighted average of the two estimates, we find mag, corresponding to the flux Jy. We assume for the flux zero-point of the band 636 Jy for mag (Bessel & Brett (1988)).
The HST observations of the GRB 990123 field were obtained on 8–9 February 1999 UT in response to the Director’s Discretionary time proposal GO-8394, with the immediate data release to the general community. The CCD camera of the Space Telescope Imaging Spectrograph (STIS) (Kimble et al. (1998)) in Clear Aperture (50CCD) mode was used. The CCD has a peak quantum efficiency at Å over the wavelength range Å. A total of 6 exposure of 1300 sec each was collected over 3 orbits. The field was imaged in six positions dithered in a spiral pattern. Each position was imaged twice to facilitate cosmic-ray removal (total of 12 integrations).
Initial data processing followed the STScI pipeline procedures, including bias and dark current subtraction. The six cosmic-ray removed images were then combined by registering the images and median stacking to produce a master science-grade image. Photometry and astrometry were performed with this image.
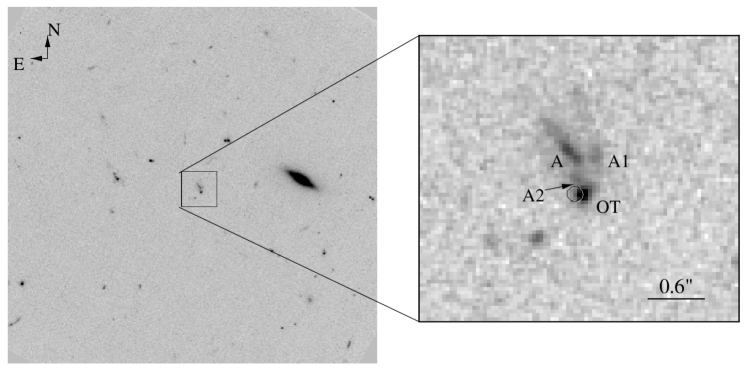
Figure 2 shows a portion of the STIS image of the GRB 990123 field. We find (see below) the OT as a point source clearly detected arcsec to the south of galaxy A. Galaxy A has an elongated and clumpy appearance, possibly indicative of star formation regions in a nearly edge-on (potentially late-type) disk galaxy, although a classification as a purely Irregular galaxy cannot be excluded. Such morphologies are typical for many galaxies at comparable flux levels, as observed with the HST. Its extension to the south clearly overlaps with the OT, and it is thus virtually certain that this galaxy is responsible for the absorption line system at (Kelson et al. (1999), Kulkarni et al. (1999)).
Our earlier ground-based imaging suggested the OT was displaced to the south of galaxy A, and we now confirm this with a precise astrometric tie between the discovery image and the STIS image. We measured the centroid of the optical transient in our discovery image from Jan 23 (Odewahn, Bloom, & Kulkarni (1999)) at the Palomar 60-inch (P60). The OT was bright ( = 18.65) at this early epoch and its position is well-determined with respect to other objects in the field. Next we computed the astrometric mapping of the P60 coordinate system to a deep Keck II 10-m R-band image (see Kulkarni et al. (1999)) using 75 well-centroided objects common to the two images. Similarly, we tie the Keck II coordinates to the STIS image using 19 common tie objects. We find the ground-based position of the OT is consistent with the STIS point-source with a negligible offset of arcsec.
The coordinates of the OT as measured in the HST image are 152530.3026, (J2000). This is in an excellent agreement with an absolute astrometric measurement, tied to the USNO A-2.0 catalogue (Monet (98)), from the ground-based image discussed in Bloom et al. 1999a . The coordinates of the center of galaxy “A” (extended North-South) are 152530.3175, (J2000). The brightest knot connected with galaxy A is located at 152530.2835, (J2000). The uncertainties in the relative positions are mas, but the positions in an absolute sense (relative to Hipparcos) are larger ( arcsec).
No other galaxies brighter than mag are detected in the STIS image closer to the OT than galaxy A, and we see no evidence for a distant cluster (or even a sizable group) in this field. This effectively removes the possibility that the burst was significantly magnified by gravitational lensing.
We will assume for the Galactic reddening in this direction mag (Schlegel, Finkbeiner, & Davis (1998)), and use the standard Galactic extinction curve with to estimate extinction corrections at other wavelengths. We assume the photometric flux zero points as tabulated by Fukugita, Shimasaku, & Ichikawa (1995).
In order to convert the observed counts to fluxes and magnitudes, we use the web-based STIS exposure simulator (ETC). Since the bandpass of the STIS CLEAR is so broad, the conversion depends on the assumed spectrum of the object. For the OT, we can assume a power-law spectrum with (Kulkarni et al. (1999)). At the effective wavelength of the STIS bandpass, Å, for the OT alone we derive Jy, uncertain by a few percent. Applying the Galactic extinction correction increases that number by about 5%. Assuming the same power-law, we derive the extinction-corrected magnitudes mag in the standard Johnson system, and mag in the Gunn-Thuan system.
For galaxy A, using the same power-law spectrum (which is a good approximation for star-forming galaxies with modest extinction, in this redshift range), we obtain Jy, uncertain by a few percent, at Å, before the extinction correction. If we assume instead (as it may be appropriate in the rest-frame UV for an actively star-forming galaxy and no extinction), we obtain Jy. The difference is indicative of the net uncertainty of the flux conversion. We thus derive for the galaxy alone, in the case: mag, mag, and the flux at Å, corresponding to Å, Jy (all corrected for the Galactic extinction). If we assume , these values become: mag, mag, and Jy.
We note that the simple power-law approximation to the broad-band spectrum of the galaxy, as defined by our STIS and -band measurements, is . This relatively blue color is suggestive of active star formation, but it cannot be used to estimate the SFR directly.
3 Discussion
We will assume a standard Friedman model cosmology with km s-1 Mpc-1, , and . For , the luminosity distance is cm, and 1 arcsec corresponds to 8.64 proper kpc or 22.45 comoving kpc in projection.
It is practically certain that the absorption system at originates from galaxy A, as no other viable candidate is seen in the HST images. The proximity of the center of galaxy A to the OT line of sight ( arcsec), corresponding to 5.5 proper kpc at this redshift, strongly suggests that the two are physically related, and we propose that A is the host galaxy of the GRB. Visual inspection of Figure 2 suggests that a probability of chance superposition on this magnitude level is negligibly small.
In order to estimate the rest-frame luminosity of galaxy A, we interpolate between the observed STIS and -band data points using a power-law, to estimate the observed flux at Å, corresponding approximately to the effective wavelength of the rest-frame band. We obtain Jy, corresponding to the absolute magnitude . At , assuming km s-1 Mpc-1, an galaxy has . We thus conclude that this object has the rest-frame luminosity . Given the uncertainty of the possible evolutionary histories, it may evolve to become either a normal spiral galaxy, or a borderline dwarf galaxy.
We can make a rough estimate of the SFR from the continuum luminosity at Å, following Madau et al. (1998). Using the estimates given above, the corresponding monochromatic rest-frame power is erg s-1 Hz-1 (for , as it may be appropriate in the UV continuum itself), or erg s-1 Hz-1 (for ). The corresponding estimated unobscured star formation rates are yr-1 and yr-1, probably accurate to within 50% or better. This is a relatively modest value, but it may be typical for normal galaxies at such redshifts. It is of course a lower limit, as it does not include any extinction corrections in the galaxy itself, or any fully obscured star formation.
Further insight into the physical properties of this galaxy comes from its absorption spectrum, presented in Kulkarni et al. (1999). The lines are unusually strong, placing this absorber in the top 10% of all Mg II absorbers detected in complete surveys (Steidel & Sargent (1992)). Unfortunately, without a direct measurement of the hydrogen column density, it is impossible to estimate the metallicity of the gas. However, the data suggest that the gas originated in a chemically evolved, massive galaxy. We note that strong metallic line absorbers are frequently associated with high hydrogen column density systems, such as damped Ly absorbers. The scatter in the redshift measurements of the individual lines implies a very small velocity dispersion, less than 60 km s-1 in the galaxy’s rest-frame (Djorgovski et al. 1999d ), implying that the absorber is associated either with a dwarf galaxy, or a dynamically cold disk of a more massive system, a possibility which we consider to be more likely.
It is worth examining the observed offset between the OT and the galaxy’s center, in the context of previously studied cases. At least five GRBs now have offsets between the centroid of the visible host and the OT measured with sufficient accuracy to test association with galactic nuclei. Figure 3 shows the measured offset between the centroid of the host galaxy and the OT as a function of the host galaxy magnitude. Two of these offsets are based on previous STIS observations with HST: GRB 970228 by Fruchter et al. (1998) and GRB 971214 by Odewahn et al. (1998). The host magnitude is correlated with galaxy radius, and we use it as an objective measure of the host size. The two curves in Fig. 3 represent the median trend in effective radius ( half-light radius) as a function of apparent magnitude. Smooth relations were computed with overlapping magnitude bins using approximately 1304 faint galaxies measured in F814W and F606W in two deep WFPC2 fields by Odewahn et al. (1996). Applying these mean trends to the total magnitude of all known host galaxies to date we note that the optical transients (except for 990123) lie well within the effective radius predicted for each host.
While the offset of the OT with respect to the effective radius (as inferred from observed magnitude) is a useful estimate of the relation of the GRB to the host, resolved imaging using HST provides the clearest picture. The transient of GRB 970228 is clearly displaced from its host center, but within the effective radius. GRB 970508, on the other hand, is coincident with the nucleus of its host galaxy to 0.01 arcseconds. Lastly, GRB 990123 is clearly separated from the central region of host and appears to be coincident with a star-forming region (see Fig. 2).
It has been clear since the discovery of GRB optical transients that GRBs are connected with galaxies. Gradually, however, a more specific picture has emerged. Imaging of the transient of GRB 990123 and its host is perhaps the best direct observational evidence that GRBs are intimately connected with the formation of stars: GRBs are clearly not a nuclear phenomenon, nor do most occur far-outside their host. The present suggestion of the spatial coincidence of GRB 990123 with a star-formation regions opens the possibility of studying not just GRBs in galaxies, but GRBs in their host environments.
References
- Akerlof & McKay (1999) Akerlof, C. W., & McKay, T. A. 1999, G.C.N. 205
- Bessel & Brett (1988) Bessell, M. S. & Brett, J. M. 1988 PASP, 100, 1134
- Bloom et al. (1998) Bloom, J. S., Djorgovski, S., Kulkarni, S. R., & Frail, D. A. 1998, ApJ, 507, L25
- Bloom, Sigurdsson, & Pols (1999) Bloom, J. S, Sigurdsson, S. & Pols, O. R. 1998, MNRAS, in press (astro-ph/9805222)
- (5) Bloom, J. S., Gal, R. R., Lubin, L. L., Mulchaey, J. S., Odewahn, S. C., & Kulkarni S. R. 1999a, G.C.N. 206
- (6) Bloom, J. S., et al. 1999b, G.C.N. 240.
- Boella et al. (1997) Boella G., et al. 1997, A&ASup, 122, 299
- Costa et al. (1997) Costa, E., et al. 1997, Nature, 387, 783
- Djorgovski et al. (1998) Djorgovski, S., Kulkarni, S. R., Bloom, J. S., Goodrich, R., Frail, D. A., Piro, L., & Palazzi, E. 1998, ApJ, 508, L17
- (10) Djorgovski, S., Kulkarni, S. R., Bloom, J. S., Frail, D. A., Chaffee, F., & Goodrich, R. 1999a, GCN Circ. No. 189
- (11) Djorgovski, S. G., Kulkarni, S. R., Bloom, J. S., Odewahn, S. C., Gal, R. R., Frail, D. A. 1999b, G.C.N. 216
- (12) Djorgovski, S. G., et al. 1999c, G.C.N. 243
- (13) Djorgovski, S. G. et al. 1999d, G.C.N. 250.
- (14) Djorgovski, S. G. et al. 1999e, G.C.N. 256.
- Frail et al. (1997) Frail, D. A., Kulkarni, S. R., Nicastro, L., Feroci, M., & Taylor, G. 1997, Nature, 393, 35
- Frail & Kulkarni (1999) Frail, D. A., Kulkarni, S. R. 1999, G.C.N. 211
- Fruchter et al. (1998) Fruchter, A., et al. 1998, astro-ph/9807295
- Fukugita, Shimasaku, & Ichikawa (1995) Fukugita, M., Shimasaku, K., Ichikawa, T. 1999 PASP, 107, 945.
- Gal et al. (1999) Gal, R. R., Djorgovski, S. G., Odewahn, S. C., Bloom, J. S., Kulkarni, S. R. 1999, G.C.N. 213.
- Goodman (1986) Goodman, J. 1986, ApJ, 308, L17.
- (21) Hjorth, J., Andersen, M. I., Cairos, L. M., Caon, N., Zapatero Osorio, M., Pedersen, H., Lindgren, B., Castro Tirado, A. J. 1999a, G.C.N. 219
- (22) Hjorth, J., Andersen, M. I., Pedersen, H., Zapatero-Osorio, M. R., Perez, E., Castro Tirado, A. J. 1999b, G.C.N. 249
- Kelson et al. (1999) Kelson, D. D., Illingworth, G. D., Franx, M., Magee, D., van Dokkum, P. G. 1999, I.A.U.C. 7096
- Kimble et al. (1998) Kimble, R. A., et al. 1998, ApJ, 492, L83
- Kippen (1999) Kippen, R. M. 1999, G.C.N. 224
- Klebesadel, Strong, & Olson (1973) Klebesadel, R. W., Strong, I. B., & Olson, R. A. 1973, ApJ, 182, L85.
- Kulkarni et al. (1998) Kulkarni, S. R., et al. 1998, Nature, 393, 35
- Kulkarni et al. (1999) Kulkarni, S. R., et al. 1999, Nature, submitted.
- Madau et al. (1998) Madau, P., Pozzetti, L., & Dickinson, M. 1998, ApJ, 498, 106
- Matthews & Soifer (1994) Matthews, K., & Soifer, B. T. 1994 Infrared Astronomy with Arrays, the Next Generation, ed. I. McLean (Dordrecht: Kluwer), 239.
- Metzger et al. (1997) Metzger, M., et al. 1997, Nature, 387, 878
- Monet (98) Monet, D. G. 1998, Bull. Amer. Astro. Soc., 193, 120.03.
- (33) Narayan, R., Paczyǹski, B., Piran, T. 1992 ApJ, 395, 83.
- Odewahn et al. (1996) Odewahn, S. C., Windhorst, R. A., Driver, S. P., Keel, W. 1996, ApJ, 472, L13.
- Odewahn et al. (1998) Odewahn, S. C., et al. 1998, ApJ, 509, L8.
- Odewahn, Bloom, & Kulkarni (1999) Odewahn, S. C., Bloom, J. S., Kulkarni, S. R. 1999, G.C.N. 201.
- Paczyǹski (1986) Paczyǹski, B. 1986, ApJ, 308, L13
- Paczyǹski (1995) Paczyǹski, B. 1995, PASP, 107, 1167
- Paczyǹski (1998) Paczyǹski, B. 1998, ApJ, 494, L45
- Piro et al. (1999) Piro, L. 1999, G.C.N. 199.
- Piro et al. (1999) Piro, L. 1999, G.C.N. 203
- Roland et al. (1994) Roland, J., Frossati, G. & Teyssier, R. 1994, A&A 290, 364
- Schlegel, Finkbeiner, & Davis (1998) Schlegel, D. J., Finkbeiner, D. P., & Davis, M. 1998, ApJ, 500, 525
- Steidel & Sargent (1992) Steidel, C. C. & Sargent, W. L. W. ApJS, 80, 1
- van Paradijs et al. (1997) van Paradijs, J., et al. 1997, Nature, 386, 686
- Woosley (1993) Woosley, S. E. 1993, ApJ, 405, 273
- Yadigaroglu et al. (1999) Yadigaroglu, I. A., Halpern, J. P., Uglesich, R., & Kemp, J. 1999, G.C.N. 242