Starbursts in barred spiral galaxies
Abstract
We have measured the bar lengths and widths of 125 barred galaxies observed with CCDs. The dependence of bar strength (identified with bar axis ratio) on morphological type, nuclear activity, central and mid-bar surface brightness is investigated.
The properties of the bars are best explained if the sample is divided into early- ( SBbc) and late-type galaxies, and into active (starburst, Seyfert or LINER) and normal galaxies. We find that galaxies with very long bars are mostly active and that normal late-type galaxies have a distinct behavior from the three other groups of galaxies. We confirm earlier findings that active late-type galaxies tend to have both stronger and longer bars than normal ones. An important result of this paper is that early-type galaxies do not share this behavior : they all tend to have strong bars, whether they are active or not. We also find correlations between bar strength and relative surface brightness in the middle and at the edge of the bar, which are not followed by normal late-type galaxies.
These results are interpreted in the light of recent numerical simulations and paradigms about galaxy evolution. They suggest that normal late-type galaxies represent the first stage of galaxy evolution, and that bars in early- and late-type galaxies do not have the same properties because they have a different origin.
Key words: Galaxies: photometry – Galaxies: starburst – Galaxies: structure
1 Introduction
The presence of a bar strongly modifies the internal dynamics of spiral galaxies, as evidenced by the deviations from circular motion in the velocity maps of barred galaxies; the isovelocity curves in the bar tend to align with the bar major axis. Numerical simulations have shown that these non-circular motions induced by the presence of a bar are toward the center of the galaxy. Inside corotation, the dissipative gaseous component loses angular momentum to the stars and falls inward (e.g. Schwarz 1984, Wada & Habe 1992, Friedli & Benz 1993), as a result of the torque exerted by the bar.
The rate of gaseous inflow depends essentially on the bar strength, which is the ratio of the force of the bar to that of the axisymmetric disk. The bar strength in turn depends on the bar axis ratio and on its mass. The rate of inflow also depends on the bulge-to-disk mass ratio, but not on the bar pattern speed nor on the gas mass (Friedli & Benz 1993).
This bar driven fueling provides an obvious mechanism for producing the activity that is often observed in the center of barred spiral galaxies (e.g. Contini et al. 1998). However, the role of the bar on starburst (Hawarden et al. 1996) or Seyfert activity (Ho et al. 1997) in spiral galaxies remains controversial.
In view of these conflicting results, a detailed study of the correlation between bar strength and starburst activity would be welcome. A first step in this direction is the morphological study of Martin (1995), who measured the bar axis ratio of 136 barred galaxies on prints of blue photographs displayed in the atlas of Sandage & Bedke (1988). He found an apparent correlation between bar axis ratio and star formation activity. Martinet & Friedli (1997) selected 32 late-type galaxies from Martin’s sample and showed that the galaxies with the strongest star formation activity had both thin and long bars, but that this was not a sufficient condition for violent star formation.
The present paper is a further step in the study of the relation between bar strength and starbursts. It is based on a morphological study of bars, and uses the bar axis ratio as an estimate of the bar strength, as in Martin (1995) and in Martinet & Friedli (1997). But several significant improvements are made. Our investigation rests on CCD images, which lend themselves to more quantitative mesurements than photographic prints, and provide the photometric properties of the bars. The choice of a red filter for the observations reduces the perturbing effect of dust. We implement a method for measuring the axis ratio which is not influenced by the perturbing presence of the bulge.
Our main goal is to check whether the results of Martin (1995) and of Martinet & Friedli (1997) still hold using our CCD data and method of measurement. Since our sample of galaxies is very different, biased toward starbursting and early-type galaxies, we can also hope to discriminate universal properties from those which are merely caused by selection effects. Finally, we take advantage of the large database accumulated on our sample (Contini 1996, Contini et al. 1997) to look for correlations between bar morphology and other galaxian properties, such as starburst age, oxygen abundance, and neutral hydrogen mass.
2 The samples of barred galaxies
We used two samples of barred galaxies for this study. The first one is composed of all the Markarian galaxies that are barred and have been detected by IRAS. It contains 144 galaxies, for many of which we obtained CCD images, low-resolution CCD spectra, neutral hydrogen and CO profiles (Contini 1996).
CCD images of 121 galaxies of this sample were obtained during several runs at the Bernard Lyot 2-meter telescope of Observatoire du Pic du Midi, with a 10001000 Thomson CCD (pixel size 0.24′′ on the sky). The seeing was good, with a median value of about 1.5′′. During one of those runs, we also observed NGC 6764 for one of the papers in this series (Contini et al. 1997). The details of the observations can be found in Contini (1996).
From this sample, we selected the 100 galaxies which have a measurable bar. We decided to make the measurements on the images taken in the red (R’ Cousins; for a definition, see de Vaucouleurs & Longo 1988) band, because dust lanes which perturb the measurements are less conspicuous in that band than in the bluer ones. The calibration of the zero point of the magnitude scale was done by indirect procedures. The photometric constants of 34 galaxy images were obtained using published aperture photometry (de Vaucouleurs & Longo 1988); the accuracy of the zero point is 0.1mag. For the 66 other galaxies, we had to rely on a mean photometric constant for the night, with a resulting accuracy of only 0.4mag.
We also needed a comparison sample, with no bar or no starburst. Since we did not have images of ordinary Markarian starburst galaxies, we took the second option and selected our comparison sample among the 113 galaxies observed by Frei et al. (1996), whose calibrated CCD images are publicly available bu ftp at astro.princeton.edu/frei/Galaxies. We selected the galaxies of that sample that were classified barred in LEDA. After eliminating galaxies with no measurable bar (because of misclassification or high inclination), we were left with 26 galaxies. We made the measurements on the images taken in the red (Cousins or Gunn) band, as for the first sample. The zero point calibration of these images is very good, with an average uncertainty of about 0.05 mag (if NGC 4498 is excluded, which has an uncertainty of 0.4 mag.).
Table 1 gathers all the information on these galaxies necessary for our analysis. The galaxy name is in col. 1; the numerical morphological type and inclination (from LEDA) in col. 2 and 3; the distance (in Mpc, estimated from the redshift given in LEDA and a Hubble constant of 75 km s-1 Mpc-1) in col. 4; the absolute magnitude (from LEDA) in col. 5; the HI mass and FIR and H luminosities (in log of solar masses, solar luminosities and erg cm-2s-1 respectively, from Contini 1996) in col. 6, 7 and 8; the central (nearly central for Seyferts) oxygen abundance (from Contini et al. 1998; from the literature for the comparison sample) in col. 9; the IRAS flux ratio (in log, computed from the fluxes given in Bicay et al. 1995, or the Faint Source Catalogue) followed by L (when an upper limit) in col. 10; the spectral classification (from Contini et al. 1998; from the literature for the comparison sample) in col. 11. No IRAS flux ratio is given when the fluxes at 25 and 100m are both upper limits. Table 1 is given in electronic form only.
Early-type galaxies are defined as earlier than SBbc (t4), and late-types as SBbc and later. The IRAS flux ratio is used to distinguish between starburst/Seyfert and more quiescent galaxies. The former, which we hereafter call ’active’, have a ratio log( – 1.2; the others are called ’normal’. It is true that we have independently determined the spectral type of the Mrk galaxies by optical spectroscopy (Contini et al. 1998), but we have not done so for the sample of Frei et al. (1996), and we need a uniform criterion for both samples. The adopted criterion also has the advantage of being the same as that used by Martinet & Friedli (1997), and thus allows a comparison of our results with theirs. This criterion is essentially a measure of the star formation efficiency. Coziol et al. (1998) have in fact shown that IRAS colors are very efficient for separating starburst, quiescent and Seyfert galaxies.
3 Method of measurement of the bar parameters
The method adopted by Martin (1995) for measuring the length and width of bars is visual and relies on photographic prints in the blue band. He estimates that, with this method, the uncertainty is about 20%. He defines the semi-major axis of the bar as the length from the galaxy center to the sharp outer tip where spiral arms begin, and the semi-minor axis as the length from the center to the edge of the bar, oval, lens or spheroidal component, measured perpendicularly to the major axis.
Our CCD images allow us in principle to make a sophisticated numerical analysis, including adjustment of ellipses to the bar. However, such a method is fraught with pitfalls which have been outlined by Wozniak et al (1995), and we preferred to rely on a simpler method. We first extract a 3-pixel wide photometric profile along the major axis of the bar. The semi-major axis of the bar is the distance from the center of the galaxy to where the bar obviously ends. This is where the surface brightness profile abruptly changes slope to become steeper; this also coincides with the origin of the spiral arms. This measurement is not automatic, it relies on the subjective judgement of where the bar ends, and is comparable to that of Martin (1995). It is hopefully more reliable, since our CCD images have a large dynamic range and were taken in the red band.
On the other hand, the method for measuring the width of the bar departs significantly from that of Martin (1995). We believe that his method overestimates the bar width, because it includes the effect of the bulge. To measure the width, we extract two photometric profiles (also three pixels wide) along the minor axis of the bar at two symmetrical distances of /2 from the center and take their average. The semi-minor axis of the bar is the distance from the bar major axis to the same isophotal level as where the tip of the bar was measured. This method is comparable to that of Friedli & Benz (1993).
4 Results of the bar measurements
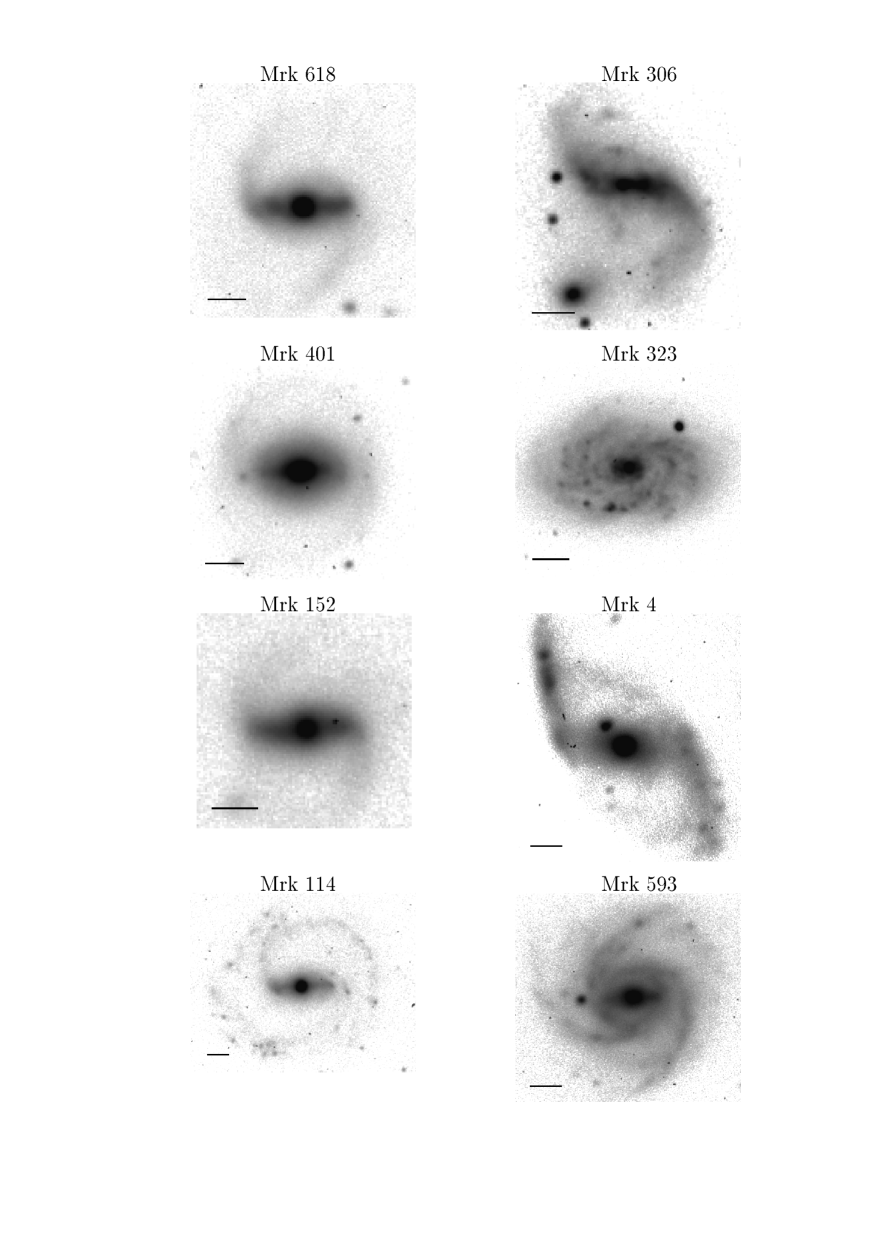
The results of our bar measurements on CCD images are summarized in Table 2. The galaxy name is in col. 1; the position angle of its major axis (from LEDA; from our images if not in LEDA) in col. 2; the angle between the bar and galaxy major axes (from our images) in col. 3; the measured semi-major and semi-minor axes (in arcsec) in col. 4 and 5; the deprojected semi-major and semi-minor axes (in arcsec) in col. 6 and 7; the deprojected axis ratio in col. 8; the ratio of deprojected major axis to corrected blue diameter at the isophote 25 (, hereafter normalized bar length, where is from LEDA) in col. 9; the surface brightness along the bar at the center (), where the semi-minor axis is measured (at half the distance to the end of the bar, ) and at the tip of the bar (), in mag.arcsec-2 in col. 10, 11 and 12. Table 2 is given in electronic form only. To give the reader a feeling for what the different types of bars look like, we show examples of each category in Fig.1.
The bar measurements were deprojected using the equations given by Martin (1995). NGC 6764, Mrk 1326 and Mrk 1452 were observed in V only. For NGC 6764, the bar surface brightnesses were transformed to R’ using the mean (V – R’) color of the galaxy computed from de Vaucouleurs & Longo (1988). For Mrk 1326 and 1452, the bar surface brightnesses were transformed to R’ using the mean (V – R’)e for their respective morphological type (Buta & Williams 1995).
The fact that we chose to normalize the bar length by deserves an explanation. Martin (1995) and Martinet & Friedli (1997) used , probably because they thought that absorption affects the galaxy diameter and bar length in the same way. Our images, however, are in the red bandpass, and, in all logic, we should use a red isophotal diameter. We did measure the isophotal diameter corresponding to a surface brightness of 24 mag.arcsec-2 on our images, and compared it to . For the Frei sample, there is a good correlation with a small scatter, from which we derived the mean relation . For the Mrk sample, on the other hand, the scatter is much larger, because two thirds of the images suffer from poor photometric calibration. We thus had to resort to . From the above relation, we estimate that the error induced by this choice (compared to a reliable ) is not larger than 5%, and reduced by the fact that we distinguish early- and late-type galaxies in the analysis.
The repeatability of our measurements was involuntarily verified when we later discovered that NGC 4123, one of Frei et al.’s (1996) galaxies, is also Mrk 1466. The comparison between the two sets of measurements for this galaxy gives an estimate of the external errors. The relative uncertainty on the bar axis ratio is 20%, while that on the bar length is less than 5%. Since this galaxy is not in de Vaucouleurs & Longo (1988), the errors on the estimated surface brightnesses reach 0.5 mag. Only the measurements performed on our image of NGC 4123 were used in the subsequent analysis.
We have compared our measurements with those of Kormendy (1979) for 13 galaxies in common and those of Martin (1995) for 15 galaxies in common. We agree qualitatively with them, except for NGC 4487, where Martin (1995) finds a bar length and width half the size of ours; we checked that there was no scale error between the two images of that galaxy. We find average differences ( = –2.6′′ and ( = 2.8′′. In other words, our estimates for the semi-major axis are intermediate between those of Martin and Kormendy. These are marginally significant results because it is not obvious to decide exactly where the bar ends. Martin finds larger semi-minor axes than us by 2.0′′ on the average, because he measures them from the center of the galaxy. For that reason, he also finds thicker bars than us by 0.14 on the average.
The largest discrepancies with Martin (1995) are on the angle between the bar and galaxy major axes, which in turn produce large differences in the axis ratios corrected for inclination, .
We consider that is a good measure of the bar strength, and subsequently use the terms strong and weak rather than thin and thick. Strong bars are defined as having 0.5; this is consistent with Martin (1995) who puts the limit at 0.6, but has weaker bars than us by 0.14 on the average.
5 Correlations with other galaxian properties
There are 125 different galaxies in the total sample, but in the astrophysical analysis of the data, we eliminated 23 galaxies for which the IRAS flux ratio log() is either an upper limit (and much larger than – 1.2) or unknown altogether. In the analyses involving the deprojected bar axis ratio , we also eliminated another 13 galaxies for which the deprojected bar axis ratio differed by more than 0.2 from the apparent one, because the uncertainties in the deprojection factor and in the true geometry of the bar mainly affect the deprojected semi-minor axis, and thus the deprojected bar axis ratio.
5.1 Bar characteristics and morphological type
The mean value of the deprojected bar axis ratio for the total sample (125 galaxies) is . For the sample restricted to reliable axis ratios and IRAS color (89 galaxies), it is 0.30. The 57 early-type galaxies seem to have a slightly stronger bar (0.28 0.10) than the 32 late-type ones (0.34 0.14), but the difference is not statistically significant.
The galaxies of our sample have on the average rather strong bars; less than 5% of them are in fact weak, compared to 36% in Martin’s (1995) sample (using the appropriate limit for each sample). The 121 galaxies of his sample with a measured bar axis ratio have a mean ratio of 0.55 0.19 (or about 0.45 if we correct for the difference in method of measurement). These differences in bar strength may be partly due to the fact that we have more early-type galaxies (60% vs 18%) and more active galaxies (57% vs 36%) than Martin (1995). The two samples are thus quite different.
| Group | ||||
|---|---|---|---|---|
| t 4, normal | 19 | 0.37 0.18 | 23 | 0.22 0.08 |
| t 4, active | 13 | 0.29 0.08 | 14 | 0.35 0.12 |
| t 4, normal | 19 | 0.29 0.11 | 22 | 0.32 0.14 |
| t 4, active | 38 | 0.27 0.11 | 43 | 0.36 0.14 |
There is marginal evidence that early-type galaxies have longer bars than late-type ones, relative to the galaxy size. Such a difference is expected on dynamical grounds (Elmegreen & Elmegreen 1985). The values of the normalized bar length for the two types are 0.37 0.17 and 0.28 0.12 respectively. This confirms earlier findings by Elmegreen & Elmegreen (1985) and Martin (1995). We have computed the mean bar lengths of early- and late-type galaxies in Martin’s sample, and find 0.33 and 0.17 respectively. The late-type galaxies of Martin have much shorter bars than ours, but, since his galaxies are mostly normal, they should be compared to our normal late-type galaxies, which have a mean bar length of 0.23, thus quite near his value.
5.2 Bar characteristics and starburst activity
The properties of the bars in relation to starburst activity are only revealed once the sample is broken into two groups, early- and late-type galaxies.
Our results are summarized in Table 3, which gives the mean values of the bar strength and length for the different groups of galaxies. The numbers of galaxies in the different groups are not the same for the statistics on bar strength and length, because galaxies with large inclination correction were excluded from the analysis and statistics involving bar strength. Our results are also shown in Figs. 2 and 3, where the relation between bar strength and length for the two types of galaxies is plotted. They reveal two main properties of bars with respect to activity:

– The normal late-type galaxies (empty squares in Fig.2) stand out from the three other groups in that there are no very long bars (). For this group, there is a good correlation between bar length and strength, of equation : , with a correlation coefficient of 0.85.
– Galaxies with very long bars () are also strong and mostly active, while galaxies with short bars () are mostly normal.
On the other hand, no trend of bar strength with activity appears, probably because our sample is biased toward strong bars.
In Figs.2 and 3, we distinguish Seyferts and LINERs (triangles) from starburst galaxies (squares). In fact, the two Figures show that the Seyferts and LINERs are undistinguishable from starbursts as far as bar characteristics are concerned. The only remarkable difference between the two types of active galaxies is that most of those with log( – 0.9 are Seyferts or LINERs. It turns out that, with the adopted activity criterion, a small minority of Seyferts and LINERs falls in the category of normal galaxies.

We now turn to a comparison with results from the literature. Using 32 late-type galaxies from the sample of Martin (1995), Martinet & Friedli (1997) showed that all the late-type galaxies with large star formation rates have both strong and long bars, but that some more quiescent galaxies also do share these properties. We confirm this result, using the 32 late-type galaxies with reliable of our sample, 5 of which are in common with Martinet & Friedli’s sample, but with independent measurements (see Fig.2). On the other hand, this is not true for the 57 early-type galaxies of our sample (see Fig.3). Most of them, whether they are active or not, have strong and long bars, just like the active late-type galaxies.
Our Fig. 2 should be compared to Fig. 3 of Martinet & Friedli (1997). These authors chose a value of 0.18 for the limit between long and short bars; we adopted a value of 0.2 for comparison, since our bar estimates are slightly larger than those of Martin (1995) for galaxies in common. Our Figs.2, 3 and 6 suggest that a value of 0.4 would in fact be a more realistic limit for general purposes.
The cumulative distribution of bar axis ratios shows that all the active late-type galaxies of our sample and 63 ( 5)% of the normal ones have strong bars. Martin (1995) finds that about 71% of his active galaxies and 59% of the quiescent ones have a strong bar; our active galaxies thus have much stronger bars than Martin’s, but the strength of the quiescent ones are comparable.
5.3 Photometric properties of the bars
We have measured the surface brightness along the bar at the center and at the distances /2 and from the center. Hereafter we call these quantities , and respectively; we also determined and . The reason for computing two surface brightness differences rather than one is that the influence of the bulge is (hopefully) confined to the first one only. While depends on seeing, it is still a good indicator of the nuclear surface brightness. We again break the sample into early- and late-type galaxies for comparing the photometric and morphological properties of the bars. The three main results are:

– The normal late-type galaxies again stand out from the three other groups. They have a fainter central surface brightness () and a smaller . This is partly due to the fact that normal late-type galaxies have fainter and shorter bars than the other groups. The main result to keep in mind here is that the middle of the bar is about two magnitudes fainter than the nucleus, or about one magnitude fainter in the case of normal late-type galaxies.
– The surface brightness difference between middle and end of the bar () is independent of morphological type or activity and is of about 0.44 mag. One can also note that is smaller than and that depends on morphological type for normal galaxies only (it is larger for early types); these last two results are due to the influence of the bulge which is more important in early-type galaxies.
– There is a correlation between bar strength and , and an opposite one between bar strength and , which are again shared by all groups except the normal late-types (see Figs.4 and 5). Stronger bars have a larger and a smaller , and vice versa. In other words, weak bars tend to have a flatter overall surface brightness gradient than strong ones.

The photometric properties of bars have already been studied in the past. Elmegreen & Elmegreen (1985) and Elmegreen et al. (1996) find that bars in early-type galaxies tend to have flat111Note that flat does not mean constant but straight light profiles and those in late-type galaxies tend to have exponential profiles outside the bulge region. Comparisons with our results are difficult because the nature of these surface brightness gradients is determined by comparison with the gradient in the disk, and the bar strength is not determined. Nevertheless, using bar strength determined by Martin (1995) for the 4 late-type galaxies with exponential profiles (NGC 3359, which has a very strong bar, is considered to have a flat profile in their second paper), we find a mean value of 0.42, thus rather weak, which is expected for bars with steep outer brightness profiles. Ohta et al. (1990) have determined the surface brightness profiles of 6 early-type galaxies. They find rather flat outer gradients, less than 0.5 mag, for 4 out of 6 galaxies; all of them have strong bars.
5.4 Bar strength and central oxygen abundance
We have investigated a possible dependence of bar characteristics on the oxygen abundance measured in the center of the galaxies. The relation between bar length and central oxygen abundance (in solar units) for early- and late-type galaxies is displayed in Fig.6. While there seems to be no trend with bar strength, we find that there are no galaxies with high oxygen abundance (O/H 1.4) and very long () bars.
| Group | ||||
|---|---|---|---|---|
| t 4, nor | 23 | 18.68 0.83 | 0.95 0.41 | 0.37 0.20 |
| t 4, act | 14 | 17.86 0.94 | 2.00 0.62 | 0.42 0.34 |
| t 4, nor | 22 | 17.96 0.63 | 1.94 0.53 | 0.48 0.25 |
| t 4, act | 43 | 17.85 0.89 | 2.25 0.70 | 0.46 0.34 |
We have also studied the relation between bar length and strength and the oxygen abundance gradient along the bar. The results are described in paper IV of this series (Considère et al., in preparation).
A search for correlations between bar characteristics and blue, far infrared and H luminosities and neutral hydrogen mass did not reveal any meaningful trends, even when normalizing these quantities by the blue luminosity.
6 The role of bars in the evolution of galaxies
We now use the bar properties determined in the previous section to discuss the possible role of bars in shaping the evolution of galaxies.
The first point is to understand why normal late-type galaxies stand out from the three other groups. This can be seen in two ways, depending on whether the activity or the morphology of the galaxy is considered the determining factor. In the first case, the normal early-type galaxies stand out because they behave like active galaxies; in the second case, the active late-type galaxies should be singled out, because they have the same properties as the early-type galaxies. In either case one reaches the conclusion that early- and late-type galaxies differ in their bar properties, and thus presumably in the way the bar originates and the galaxy evolves.
This concurs with the results of numerical simulations by Noguchi (1996), who concludes that the bars of late-type galaxies slowly form as a result of bar instability in the disk, whereas the bars of early-type galaxies form more rapidly (within one disk rotation period) in tidal interactions. He also finds that tidally induced bars have flatter surface density profiles than spontaneous bars. Even though he does not study the dependence of this profile on bar strength, there are indications in his paper that induced bars are stronger than spontaneous bars, which is expected if interactions induce a stronger perturbation than natural disk instabilities. This would confirm the relation that we find between strength of the bar and flatness of the outer surface brightness profile.

Now, to explain the specificity of normal late-type galaxies, one has to consider the overall evolution of galaxies. According to the latest paradigm (Pfenniger 1998), galaxies evolve from late to early type by forming a bar which dissolves into a bulge, then grows again to form a more massive bulge. In this scenario, a normal late-type galaxy, which initially develops a short bar, becomes active as the bar gets stronger and longer and funnels more gas toward the center to feed star formation. In the later evolution, a new and initially strong bar arises in the wake of a tidal perturbation, grows longer and star formation resumes after sufficient gas has been accreted. The evolution thus proceeds, alternating between barred and unbarred structure, until there is no more gas to be funnelled toward the center.
The correlation between bar strength and is readily understood in this context: a stronger bar favors central star formation, which in turn enhances the brightness contrast between the bar and the nucleus. The fact that stronger bars have flatter outer profiles, predicted by the simulations, is probably best understood in terms of stellar dynamics. In strong bars, the stellar orbits are more elongated and the stars spend more time near apogalacticon, thus enhancing the surface brightness of the outer regions of the bar. However, this explanation rests on the assumption that these are regular orbits; chaotic orbits are likely to fill larger regions and to smooth out the density contrast (Wozniak & Pfenniger 1999).
Finally, the absence of very long bars with high oxygen abundances can be explained in two different ways. The first one, which was suggested to us by Daniel Friedli, is that long bars allow gas from regions further out, where the oxygen abundances are very low, to reach the central regions and thus to dilute the central abundances. Alternatively, star formation increases the amount of dust, which can hide the extremities of the bars. We have indeed noticed that the bars of our galaxies are longer in K than in the R band (Bergougnan et al., in preparation); a similar trend has also been noticed by Friedli et al. (1996). We are indebted to Hervé Wozniak for pointing this out to us. The correct explanation might be a combination of these two possibilities.
-
Acknowledgements.
Data from the literature were obtained with the Lyon Meudon Extragalactic database (LEDA), supplied by the LEDA team at CRAL-Observatoire de Lyon (France). We thank the staff of Observatoire du Pic du Midi for assistance at the telescope. We also thank Christophe Bordry and David Teyssier for their contribution to the statistical analysis of the data, as well as Alessandro Boselli, Daniel Friedli, Hervé Wozniak and Ron Buta for helpful comments on this paper.
References
- 1
- 2 Bicay M.D., Kojoian G., Seal J., et al., 1995, ApJ 98, 369
- 3 Buta R., Williams K.L., 1995, AJ 109, 543
- 4 Contini T., 1996, Ph. D. thesis, Université Paul Sabatier, Toulouse, France
- 5 Contini T., Considère S., Davoust E., 1998, A&AS 130, 285 (paper III)
- 6 Contini T., Davoust E., Considère S., 1995, A&A 303, 440 (paper I)
- 7 Contini T., Wozniak H., Considère S., Davoust E., 1997, A&A, 324, 41 (paper II)
- 8 Coziol R., Contini T., Davoust E., Considère S., 1997, ApJ, 481, L67
- 9 Coziol R., Torres C.A.O, Quast G.R., Contini T., Davoust E., 1998, ApJS, 119, 239
- 10 Elmegreen B.G., Elmegreen D.M., 1985, ApJ 288, 438
- 11 Elmegreen B.G., Elmegreen D.M., Chromey F.R., et al., 1996, AJ 111, 2233
- 12 Frei Z., Guhathakurta P., Gunn J., Tyson J.A., 1996, AJ 111, 174
- 13 Friedli D., Benz W., 1993 A&A 268, 65
- 14 Friedli D., Wozniak H., Rieke M., et al., 1996, A&AS 118, 461
- 15 Hawarden T.G., Huang J.H., Gu Q.S., 1996, in : Barred Galaxies, Buta R., Crocker D.A., Elmegreen B.G. (eds.), Proc. IAU Coll. 157, ASP Conference Series, p. 54
- 16 Ho L.C., Filippenko A.V., Sargent W.L.W., 1997, ApJ 487, 591
- 17 Kormendy, J., 1979, ApJ 277, 714
- 18 de Vaucouleurs A., Longo G., 1988, The University of Texas Monographs in Astronomy No. 5
- 19 Martin P., 1995, AJ 109, 2428
- 20 Martinet L., Friedli D., 1997, A&A, 323, 363
- 21 Noguchi M., 1996, ApJ 469, 605
- 22 Ohta K., Hamabe M., Wakamatsu K.I., 1990, ApJ 357, 71
- 23 Pfenniger D., 1998, in : Abundance profiles: diagnostics tools for galaxy history, Friedli D., Edmunds M.G., Robert C., Drissen L. (eds.), ASP Conference Series, p. 237
- 24 Sandage A., Bedke J., 1988, Atlas of galaxies useful for measuring the cosmological distance scale (NASA, Washington DC)
- 25 Schwarz, M.P., 1984, MNRAS 209, 93
- 26 Wada K., Habe A., 1992, MNRAS 258, 82
- 27 Wozniak H., Friedli D., Martinet L., Martin P., Bratschi P., 1995, A&AS 111, 115
- 28 Wozniak H., Pfenniger, D., 1999, in:”Impact of Modern Dynamics in Astronomy”, Proc IAU Coll. 172, J. Henrard & S. Ferraz-Mello (eds), Celestial Mechanics, in press